Grundläggande statistik
| Institutionella ägare | 138 total, 137 long only, 0 short only, 1 long/short - change of 10,40% MRQ |
| Genomsnittlig portföljallokering | 0.1788 % - change of −22,90% MRQ |
| Institutionella aktier (lång) | 23 082 691 (ex 13D/G) - change of 0,63MM shares 2,82% MRQ |
| Institutionellt värde (lång) | $ 346 560 USD ($1000) |
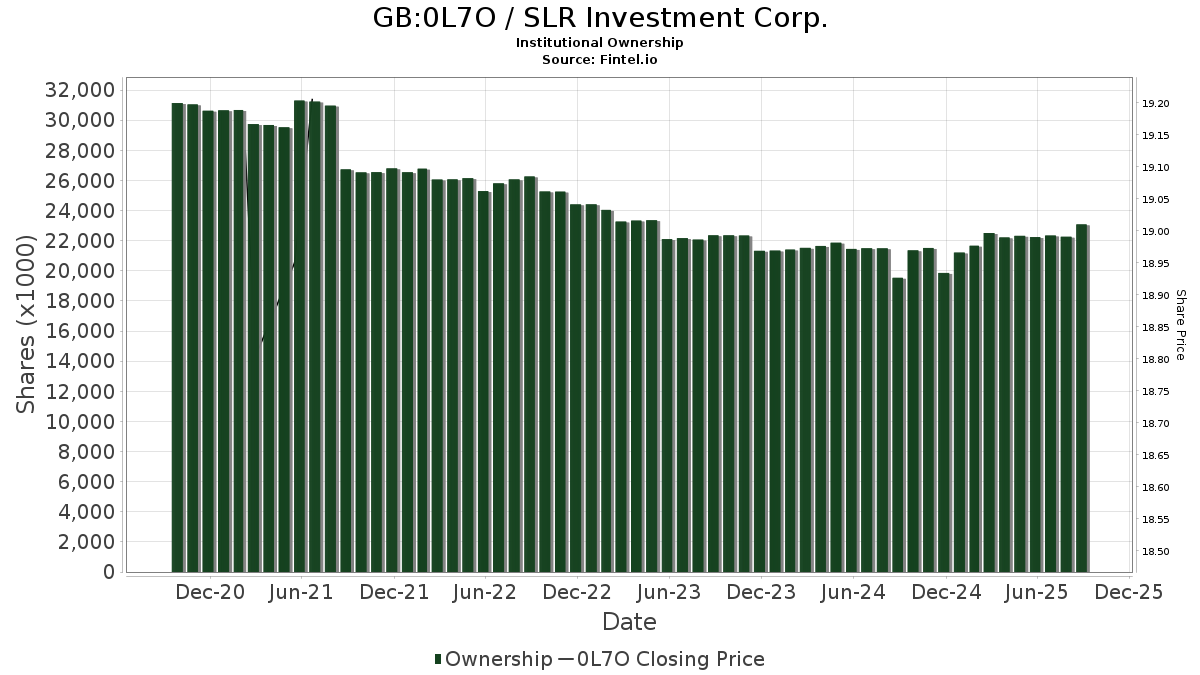
Institutionellt ägande och aktieägare
SLR Investment Corp. (GB:0L7O) har 138 Institutionella ägare och aktieägare som har lämnat in 13D/G- eller 13F-formulär till Securities Exchange Commission (SEC). Dessa institut innehar totalt 23,082,691 aktier. Största aktieägare inkluderar Thornburg Investment Management Inc, TIBAX - Thornburg Investment Income Builder Fund - Class A, Jpmorgan Chase & Co, Van Eck Associates Corp, Aristotle Capital Boston, LLC, BIZD - VanEck Vectors BDC Income ETF, Ares Management Llc, Two Sigma Advisers, Lp, UBS Group AG, and Legal & General Group Plc .
SLR Investment Corp. (LSE:0L7O) Institutionell ägarstruktur visar institutioners och fonders nuvarande positioner i företaget, samt de senaste förändringarna i positionernas storlek. Större aktieägare kan vara enskilda investerare, fonder, hedgefonder eller institutioner. Bilaga 13D visar att investeraren äger (eller ägde) mer än 5% av företaget och avser (eller avsåg) att aktivt eftersträva en förändring av affärsstrategin. Schedule 13G indikerar en passiv investering på över 5%.
Fondsentimentets poäng
Fondsentimentet poängen(fka Ägarackumulation-poäng) visar vilka aktier som är mest köpta av fonder. Det är resultatet av en sofistikerad kvantitativ flerfaktormodell som identifierar företag med de högsta nivåerna av institutionell ackumulering. Poängsättningsmodellen använder en kombination av den totala ökningen av redovisade ägare, förändringarna i portföljallokeringarna för dessa ägare och andra mått. Siffran sträcker sig från 0 till 100, där högre siffror indikerar en högre nivå av ackumulering i förhållande till sina konkurrenter, och 50 är genomsnittet.
Uppdateringsfrekvens: Dagligen
Se Ownership Explorer, som innehåller en lista över de högst rankade företagen.
AI+ Ask Fintel’s AI assistant about SLR Investment Corp..
Thinking of good questions…
13F- och NPORT-arkiveringar
Detaljer om 13F-arkiveringar är gratis. Detaljer om NP-arkiveringar kräver ett premiummedlemskap. Gröna rader indikerar nya positioner. Röda rader indikerar stängda positioner. Klicka på länk symbolen för att se hela transaktionshistoriken.
Uppgradera
för att låsa upp premiumdata och exportera till Excel ![]() .
.
| Fil Datum | Källa | Investerare | Typ | Genomsnittligt pris (beräknat) |
Aktier | Δ Aktier (%) |
Rapporterat värde (1000 USD) |
Δ Värde (%) |
Portföljallokering (%) |
|
|---|---|---|---|---|---|---|---|---|---|---|
| 2025-08-14 | 13F | BI Asset Management Fondsmaeglerselskab A/S | 66 404 | 0,00 | 1 | 0,00 | ||||
| 2025-07-31 | 13F | MQS Management LLC | 27 421 | −18,90 | 443 | −22,46 | ||||
| 2025-08-04 | 13F | Muzinich & Co., Inc. | 267 581 | 50,25 | 4 319 | 43,84 | ||||
| 2025-08-12 | 13F | Dynamic Technology Lab Private Ltd | 20 227 | 326 | ||||||
| 2025-08-13 | 13F | Lido Advisors, LLC | 41 393 | −5,07 | 668 | −9,12 | ||||
| 2025-08-07 | 13F | Campbell & CO Investment Adviser LLC | 42 259 | 297,25 | 682 | 281,01 | ||||
| 2025-08-28 | NP | SVOAX - Simt Us Managed Volatility Fund Class F | 5 471 | 88 | ||||||
| 2025-08-05 | 13F | Huntington National Bank | 1 | 0,00 | 0 | |||||
| 2025-05-08 | 13F | XTX Topco Ltd | 0 | −100,00 | 0 | |||||
| 2025-08-14 | 13F | Citadel Advisors Llc | Call | 12 800 | −58,71 | 207 | −60,54 | |||
| 2025-08-11 | 13F | NewEdge Wealth, LLC | 95 574 | 4,12 | 1 554 | 0,45 | ||||
| 2025-07-17 | 13F | HB Wealth Management, LLC | 12 614 | 0,00 | 204 | −4,25 | ||||
| 2025-07-21 | 13F | Ameritas Advisory Services, LLC | 70 | 1 | ||||||
| 2025-08-05 | 13F | Bard Associates Inc | 13 385 | −1,11 | 216 | −5,26 | ||||
| 2025-08-14 | 13F | Citadel Advisors Llc | 20 325 | 328 | ||||||
| 2025-08-04 | 13F | Flagship Harbor Advisors, Llc | 18 762 | 3,26 | 303 | −1,31 | ||||
| 2025-08-12 | 13F | Virtu Financial LLC | 13 259 | 0 | ||||||
| 2025-05-29 | NP | Resource Credit Income Fund | 115 211 | 0,00 | 1 942 | 4,35 | ||||
| 2025-07-29 | NP | ISMD - Inspire Small/Mid Cap Impact ETF | 20 999 | −9,91 | 352 | −14,39 | ||||
| 2025-08-08 | 13F | Wall Street Access Asset Management, LLC | 18 748 | 0,19 | 303 | −4,13 | ||||
| 2025-08-12 | 13F | AlphaCore Capital LLC | 52 332 | −14,40 | 845 | −18,06 | ||||
| 2025-08-14 | 13F | Jane Street Group, Llc | 46 205 | 746 | ||||||
| 2025-08-14 | 13F | Two Sigma Investments, Lp | 303 188 | −7,02 | 4 893 | −10,99 | ||||
| 2025-08-14 | 13F | AllSquare Wealth Management LLC | 1 847 | −17,80 | 30 | −21,62 | ||||
| 2025-08-13 | 13F | Invesco Ltd. | 42 469 | 17,95 | 685 | 12,85 | ||||
| 2025-08-21 | NP | TIBAX - Thornburg Investment Income Builder Fund - Class A | 4 307 900 | 0,00 | 69 530 | −4,27 | ||||
| 2025-09-04 | 13F/A | Advisor Group Holdings, Inc. | 78 004 | 0,28 | 1 259 | −4,04 | ||||
| 2025-04-28 | 13F | Strategic Financial Concepts, LLC | 0 | −100,00 | 0 | −100,00 | ||||
| 2025-06-30 | NP | PSP - Invesco Global Listed Private Equity ETF This fund is a listed as child fund of Invesco Ltd. and if that institution has disclosed ownership in this security, then these positions will not be double counted when calculating total shares and total value | 34 153 | −23,65 | 531 | −29,89 | ||||
| 2025-07-01 | 13F | Confluence Investment Management Llc | 87 560 | −53,27 | 1 413 | −55,27 | ||||
| 2025-07-28 | 13F | Harbour Investments, Inc. | 445 | 0,00 | 7 | 0,00 | ||||
| 2025-07-14 | 13F | U.S. Capital Wealth Advisors, LLC | 17 394 | 0,12 | 281 | −4,11 | ||||
| 2025-08-06 | 13F | Pekin Hardy Strauss, Inc. | 100 700 | 2,20 | 1 625 | −2,17 | ||||
| 2025-08-14 | 13F | Bank Of America Corp /de/ | 53 582 | −41,61 | 865 | −44,15 | ||||
| 2025-05-15 | 13F | D. E. Shaw & Co., Inc. | 0 | −100,00 | 0 | |||||
| 2025-07-18 | 13F | Trust Co Of Vermont | 500 | 8 | ||||||
| 2025-07-28 | NP | PEX - ProShares Global Listed Private Equity ETF | 9 789 | −4,80 | 164 | −9,39 | ||||
| 2025-08-14 | 13F | Comerica Bank | 1 814 | 0,00 | 29 | −3,33 | ||||
| 2025-08-05 | 13F | Simplex Trading, Llc | 275 | 0 | ||||||
| 2025-08-05 | 13F | Simplex Trading, Llc | Call | 700 | −90,28 | 0 | ||||
| 2025-07-18 | 13F | Founders Capital Management | 2 640 | 0,00 | 43 | −4,55 | ||||
| 2025-08-13 | 13F | Northern Trust Corp | 20 432 | 330 | ||||||
| 2025-08-12 | 13F | Jpmorgan Chase & Co | 1 331 363 | −0,68 | 21 488 | −4,92 | ||||
| 2025-07-29 | NP | SVYAX - SIIT U.S. Managed Volatility Fund - Class A | 22 862 | 383 | ||||||
| 2025-08-05 | 13F | Simplex Trading, Llc | Put | 1 400 | 7,69 | 0 | ||||
| 2025-08-07 | 13F | Allworth Financial LP | 7 482 | 121 | ||||||
| 2025-08-14 | 13F | GWM Advisors LLC | 99 497 | 10,51 | 1 606 | 5,73 | ||||
| 2025-08-13 | 13F | Garner Asset Management Corp | 58 902 | −11,66 | 951 | −15,48 | ||||
| 2025-08-14 | 13F | Intrepid Family Office Llc | 250 000 | 8,04 | 4 035 | 3,44 | ||||
| 2025-08-07 | 13F | Rossmore Private Capital | 10 000 | 0,00 | 161 | −4,17 | ||||
| 2025-07-31 | 13F | Sumitomo Mitsui Trust Holdings, Inc. | 208 606 | 18,38 | 3 367 | 13,33 | ||||
| 2025-08-14 | 13F | UBS Group AG | 408 401 | 38,87 | 6 592 | 32,94 | ||||
| 2025-08-12 | 13F | Legal & General Group Plc | 359 255 | −1,16 | 5 807 | −5,24 | ||||
| 2025-08-08 | 13F | CFO4Life Group, LLC | 12 000 | 0,00 | 194 | −4,46 | ||||
| 2025-08-14 | 13F | Raymond James Financial Inc | 326 952 | 3,03 | 5 277 | −1,38 | ||||
| 2025-08-25 | 13F/A | Neuberger Berman Group LLC | 88 406 | 15,38 | 1 427 | 10,46 | ||||
| 2025-08-14 | 13F | Sunbelt Securities, Inc. | 105 566 | 3,88 | 1 706 | −0,47 | ||||
| 2025-05-05 | 13F | Eagle Bay Advisors LLC | 0 | −100,00 | 0 | −100,00 | ||||
| 2025-08-06 | 13F | Wedbush Securities Inc | 51 179 | 7,55 | 1 | |||||
| 2025-09-10 | NP | Putnam ETF Trust - Putnam BDC ETF - | 335 481 | 58,84 | 5 368 | 63,53 | ||||
| 2025-08-14 | 13F | Qube Research & Technologies Ltd | 25 794 | −14,09 | 416 | −17,79 | ||||
| 2025-07-11 | 13F | Farther Finance Advisors, LLC | 878 | 0,00 | 14 | 0,00 | ||||
| 2025-08-08 | 13F | Pnc Financial Services Group, Inc. | 441 | −34,86 | 7 | −36,36 | ||||
| 2025-08-13 | 13F | EverSource Wealth Advisors, LLC | 4 000 | 0,00 | 65 | −4,48 | ||||
| 2025-05-15 | 13F | Squarepoint Ops LLC | 0 | −100,00 | 0 | |||||
| 2025-07-24 | 13F | CWM Advisors, LLC | 24 070 | 18,16 | 388 | 13,12 | ||||
| 2025-08-14 | 13F | Wiley Bros.-aintree Capital, Llc | 11 817 | 2,98 | 191 | −3,06 | ||||
| 2025-08-14 | 13F | Group One Trading, L.p. | Call | 0 | −100,00 | 0 | ||||
| 2025-08-14 | 13F | Group One Trading, L.p. | 0 | −100,00 | 0 | |||||
| 2025-08-11 | 13F | Citigroup Inc | 14 830 | 132,41 | 239 | 123,36 | ||||
| 2025-08-14 | 13F | Tudor Investment Corp Et Al | 33 432 | −44,24 | 540 | −46,63 | ||||
| 2025-08-08 | 13F | Cetera Investment Advisers | 40 901 | 11,73 | 660 | 6,97 | ||||
| 2025-08-12 | 13F | Franklin Resources Inc | 354 701 | 1 413,16 | 5 725 | 1 349,11 | ||||
| 2025-07-30 | 13F | Denali Advisors Llc | 129 744 | −2,25 | 2 094 | −6,39 | ||||
| 2025-08-13 | 13F | Northwestern Mutual Wealth Management Co | 13 000 | 210 | ||||||
| 2025-08-14 | 13F | Quarry LP | 3 593 | 58 | ||||||
| 2025-08-14 | 13F | Fmr Llc | 8 | −33,33 | 0 | |||||
| 2025-08-13 | 13F | Mackenzie Financial Corp | 35 222 | −23,06 | 568 | −26,33 | ||||
| 2025-05-09 | 13F | Campbell Capital Management Inc | 0 | −100,00 | 0 | |||||
| 2025-05-12 | 13F | National Bank Of Canada /fi/ | 0 | −100,00 | 0 | |||||
| 2025-08-08 | 13F | Condor Capital Management | 341 820 | 2,75 | 5 517 | −1,64 | ||||
| 2025-08-12 | 13F | LPL Financial LLC | 66 132 | 36,34 | 1 067 | 30,60 | ||||
| 2025-08-12 | 13F | MAI Capital Management | 1 170 | 0,00 | 19 | −5,26 | ||||
| 2025-07-14 | 13F | GAMMA Investing LLC | 1 071 | 0,00 | 17 | −5,56 | ||||
| 2025-08-12 | 13F | Proequities, Inc. | Put | 0 | 0 | |||||
| 2025-08-12 | 13F | Proequities, Inc. | Call | 0 | 0 | |||||
| 2025-08-12 | 13F | Proequities, Inc. | 0 | 0 | ||||||
| 2025-08-13 | 13F | Transce3nd, LLC | 0 | −100,00 | 0 | |||||
| 2025-08-13 | 13F | Natixis Advisors, L.p. | 0 | −100,00 | 0 | |||||
| 2025-08-13 | 13F | Virtus Investment Advisers, Inc. | 42 919 | −22,16 | 693 | −25,51 | ||||
| 2025-08-14 | 13F | Susquehanna International Group, Llp | Put | 0 | −100,00 | 0 | ||||
| 2025-08-21 | NP | BIZD - VanEck Vectors BDC Income ETF | 964 048 | 9,90 | 15 560 | 5,21 | ||||
| 2025-07-29 | 13F | Chicago Partners Investment Group LLC | 29 927 | 2,16 | 495 | 9,51 | ||||
| 2025-08-14 | 13F | Aristotle Capital Boston, LLC | 980 411 | −7,23 | 15 824 | −11,19 | ||||
| 2025-08-11 | 13F | Wealthspire Advisors, LLC | 25 084 | 405 | ||||||
| 2025-07-16 | 13F | MKT Advisors LLC | 0 | −100,00 | 0 | |||||
| 2025-07-25 | 13F | Atria Wealth Solutions, Inc. | 0 | −100,00 | 0 | |||||
| 2025-07-31 | 13F | Oppenheimer & Co Inc | 53 726 | 42,12 | 867 | 36,11 | ||||
| 2025-08-14 | 13F | Royal Bank Of Canada | 232 091 | 0,46 | 3 746 | −3,83 | ||||
| 2025-05-12 | 13F | Empirical Asset Management, LLC | 0 | −100,00 | 0 | |||||
| 2025-08-07 | 13F | Samalin Investment Counsel, LLC | 33 508 | 6,44 | 541 | 1,89 | ||||
| 2025-08-14 | 13F | Aquatic Capital Management LLC | 981 | −93,74 | 16 | −94,32 | ||||
| 2025-05-15 | 13F | Talon Private Wealth, LLC | 0 | −100,00 | 0 | −100,00 | ||||
| 2025-08-13 | 13F | PharVision Advisers, LLC | 10 881 | 176 | ||||||
| 2025-08-07 | 13F | ProShare Advisors LLC | 0 | −100,00 | 0 | |||||
| 2025-08-07 | 13F | Acadian Asset Management Llc | 5 490 | −67,13 | 0 | |||||
| 2025-08-14 | 13F | Stifel Financial Corp | 25 309 | −5,11 | 408 | −9,13 | ||||
| 2025-05-07 | 13F | Spectrum Wealth Counsel, LLC | 1 442 | 2,34 | 24 | 9,09 | ||||
| 2025-08-15 | 13F | Morgan Stanley | 261 350 | 27,99 | 4 218 | 22,55 | ||||
| 2025-08-14 | 13F | Wells Fargo & Company/mn | 12 493 | −40,74 | 202 | −43,38 | ||||
| 2025-07-03 | 13F | Garde Capital, Inc. | 126 | 0,00 | 2 | 0,00 | ||||
| 2025-08-12 | 13F | Inscription Capital, LLC | 0 | −100,00 | 0 | |||||
| 2025-07-25 | 13F | Apollon Wealth Management, LLC | 0 | −100,00 | 0 | |||||
| 2025-08-01 | 13F | Envestnet Asset Management Inc | 19 078 | 5,55 | 308 | 0,99 | ||||
| 2025-07-25 | NP | First Trust Specialty Finance & Financial Opportunities Fund This fund is a listed as child fund of First Trust Advisors Lp and if that institution has disclosed ownership in this security, then these positions will not be double counted when calculating total shares and total value | 61 000 | −62,11 | 1 022 | −63,99 | ||||
| 2025-07-31 | 13F | Cambridge Investment Research Advisors, Inc. | 24 994 | 15,00 | 0 | |||||
| 2025-08-12 | 13F | Advisors Asset Management, Inc. | 175 121 | 60,99 | 2 826 | 54,09 | ||||
| 2025-08-11 | 13F | Private Advisor Group, LLC | 12 499 | 13,72 | 202 | 8,65 | ||||
| 2025-04-21 | 13F | Nelson, Van Denburg & Campbell Wealth Management Group, LLC | 0 | −100,00 | 0 | −100,00 | ||||
| 2025-08-12 | 13F | J.w. Cole Advisors, Inc. | 14 904 | 4,44 | 241 | 0,00 | ||||
| 2025-08-14 | 13F | Verition Fund Management LLC | 16 696 | 269 | ||||||
| 2025-08-14 | 13F | Ubs Asset Management Americas Inc | 12 878 | 208 | ||||||
| 2025-08-14 | 13F | Cubist Systematic Strategies, LLC | 30 299 | 489 | ||||||
| 2025-08-14 | 13F | Brevan Howard Capital Management LP | 11 979 | 193 | ||||||
| 2025-08-28 | NP | AIHHX - Aristotle Small/Mid Cap Equity Fund Class I-2 | 16 202 | −19,01 | 262 | −22,55 | ||||
| 2025-08-07 | 13F | Connor, Clark & Lunn Investment Management Ltd. | 59 519 | 58,09 | 961 | 51,42 | ||||
| 2025-08-14 | 13F | Two Sigma Advisers, Lp | 517 076 | −2,60 | 8 346 | −6,76 | ||||
| 2025-07-17 | 13F | Janney Montgomery Scott LLC | 52 537 | −0,83 | 1 | |||||
| 2025-07-31 | 13F | Pullen Investment Management, LLC | 53 973 | −13,06 | 871 | −16,73 | ||||
| 2025-08-13 | 13F | ExodusPoint Capital Management, LP | 22 600 | −41,75 | 0 | |||||
| 2025-08-13 | 13F | Thornburg Investment Management Inc | 4 372 550 | 0,00 | 70 573 | −90,43 | ||||
| 2025-08-12 | 13F | CIBC Private Wealth Group, LLC | 2 000 | −0,05 | 32 | 14,29 | ||||
| 2025-08-12 | 13F | Country Trust Bank | 600 | 10 | ||||||
| 2025-08-12 | 13F | BlackRock, Inc. | 310 580 | 30,73 | 5 013 | 25,14 | ||||
| 2025-08-13 | 13F | Quantbot Technologies LP | 11 766 | 190 | ||||||
| 2025-08-14 | 13F | Citadel Advisors Llc | Put | 0 | −100,00 | 0 | ||||
| 2025-08-14 | 13F | Bnp Paribas Arbitrage, Sa | 118 | 2 | ||||||
| 2025-08-12 | 13F | Steward Partners Investment Advisory, Llc | 9 779 | 0,00 | 158 | −4,27 | ||||
| 2025-08-05 | 13F | Next Capital Management LLC | 27 520 | 0,00 | 444 | −4,10 | ||||
| 2025-08-07 | 13F | Hennion & Walsh Asset Management, Inc. | 277 397 | 24,76 | 4 477 | 19,45 | ||||
| 2025-08-07 | 13F | Montag A & Associates Inc | 37 987 | 0,00 | 613 | −4,22 | ||||
| 2025-07-09 | 13F | Triumph Capital Management | 38 242 | 3,62 | 617 | −0,80 | ||||
| 2025-08-15 | 13F | Captrust Financial Advisors | 34 112 | 0,88 | 551 | −3,51 | ||||
| 2025-05-15 | 13F | Millennium Management Llc | 0 | −100,00 | 0 | −100,00 | ||||
| 2025-07-25 | 13F | Cwm, Llc | 750 | 504,84 | 0 | |||||
| 2025-08-13 | 13F | Jump Financial, LLC | 48 431 | 782 | ||||||
| 2025-04-22 | 13F | Synergy Financial Management, LLC | 0 | −100,00 | 0 | |||||
| 2025-05-16 | 13F | Jones Financial Companies Lllp | 0 | −100,00 | 0 | |||||
| 2025-07-14 | 13F | Westend Capital Management LLC | 8 298 | 2,46 | 134 | −2,21 | ||||
| 2025-08-14 | 13F | Ares Management Llc | 944 131 | −33,99 | 15 238 | −36,81 | ||||
| 2025-08-14 | 13F | State Street Corp | 52 209 | 257,74 | 843 | 242,28 | ||||
| 2025-08-18 | 13F | N.E.W. Advisory Services LLC | 2 015 | 11,02 | 33 | 6,67 | ||||
| 2025-08-12 | 13F | Trexquant Investment LP | 178 801 | −14,18 | 2 886 | −17,85 | ||||
| 2025-08-14 | 13F | Susquehanna International Group, Llp | Call | 70 000 | 241,46 | 1 130 | 227,25 | |||
| 2025-08-14 | 13F | Susquehanna International Group, Llp | 14 952 | −65,90 | 241 | −67,39 | ||||
| 2025-08-12 | 13F | Running Point Capital Advisors, LLC | 20 000 | 56,25 | 323 | 49,77 | ||||
| 2025-08-14 | 13F | Sei Investments Co | 306 107 | 12,36 | 4 941 | 7,55 | ||||
| 2025-08-12 | 13F | SRS Capital Advisors, Inc. | 3 062 | 49 | ||||||
| 2025-08-14 | 13F | Ameriprise Financial Inc | 102 604 | 1,68 | 1 652 | −2,94 | ||||
| 2025-07-22 | 13F | Valley National Advisers Inc | 673 | 0,00 | 0 | |||||
| 2025-08-21 | NP | MOFTX - Mercer Opportunistic Fixed Income Fund Class I | 11 852 | 191 | ||||||
| 2025-08-15 | 13F | Tower Research Capital LLC (TRC) | 693 | −28,19 | 11 | −31,25 | ||||
| 2025-08-14 | 13F | Van Eck Associates Corp | 1 120 153 | 14,85 | 18 | 12,50 | ||||
| 2025-07-09 | 13F | Epiq Partners, Llc | 351 960 | 7,45 | 5 681 | 2,86 | ||||
| 2025-08-15 | 13F | Great West Life Assurance Co /can/ | 52 869 | 0,00 | 1 | |||||
| 2025-06-25 | NP | VPC - Virtus Private Credit Strategy ETF | 50 368 | −10,76 | 783 | −18,03 | ||||
| 2025-07-31 | 13F | Caitong International Asset Management Co., Ltd | 80 | 1 | ||||||
| 2025-08-06 | 13F | Commonwealth Equity Services, Llc | 181 832 | −20,07 | 3 | −33,33 | ||||
| 2025-08-14 | 13F | Hrt Financial Lp | 21 703 | 0 | ||||||
| 2025-05-14 | 13F | Virtus ETF Advisers LLC | 0 | −100,00 | 0 |
Other Listings
| US:SLRC | 16,11 US$ |