Grundläggande statistik
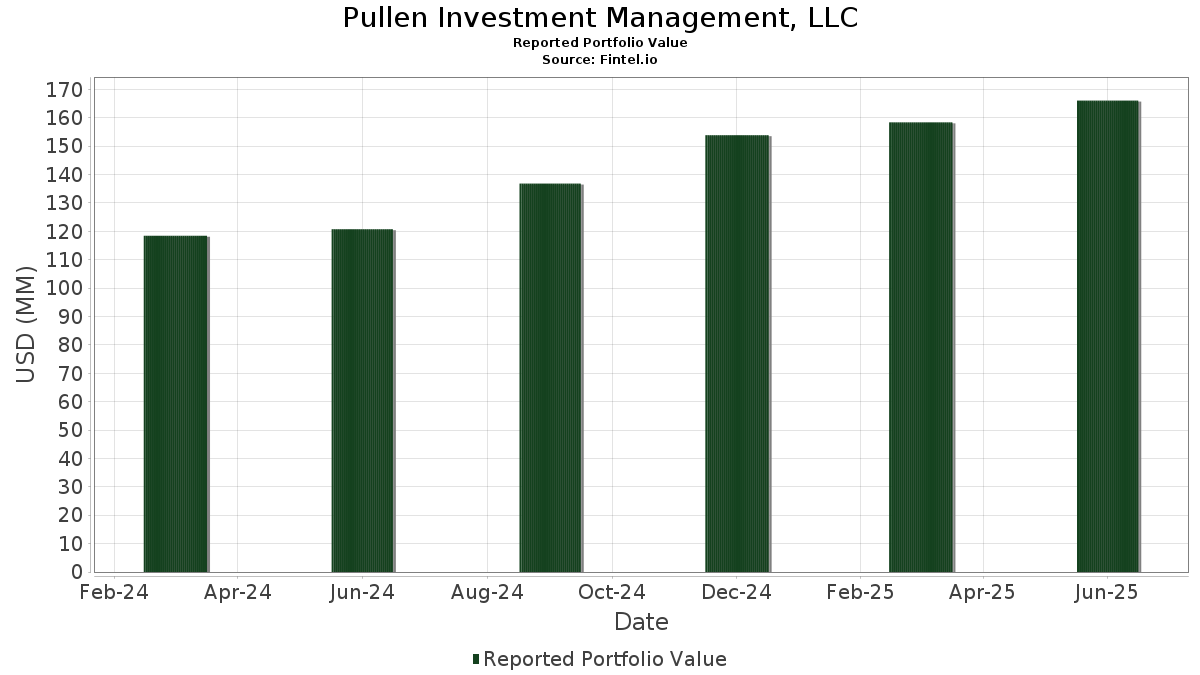
| Portföljvärde | $ 166 017 332 |
| Aktuella positioner | 100 |
Senaste innehav, resultat, förvaltat kapital (från 13F, 13D)
Pullen Investment Management, LLC har redovisat 100 totala innehav i sina senaste SEC-arkiveringar. Det senaste portföljvärdet beräknas vara $ 166 017 332 USD. Faktiskt förvaltade tillgångar (AUM) är detta värde plus likvida medel (som inte redovisas). Pullen Investment Management, LLCs största innehav är Vanguard Index Funds - Vanguard S&P 500 ETF (US:VOO) , Vanguard Index Funds - Vanguard Total Stock Market ETF (US:VTI) , Schwab Strategic Trust - Schwab U.S. Broad Market ETF (US:SCHB) , Microsoft Corporation (US:MSFT) , and Berkshire Hathaway Inc. (US:BRK.B) . Pullen Investment Management, LLCs nya positioner inkluderar Barrick Mining Corporation (US:B) , Titan Machinery Inc. (US:TITN) , .
Största ökningarna detta kvartal
Vi använder förändringen i portföljallokeringen eftersom det är det mest meningsfulla måttet. Förändringar kan bero på transaktioner eller förändringar i aktiekurser.
| Värdepapper | Aktier (MM) |
Värde (MM$) |
Portfölj % av | ΔPortfölj % av |
|---|---|---|---|---|
| 0,09 | 1,77 | 1,0672 | 1,0672 | |
| 0,15 | 2,03 | 1,2230 | 0,6655 | |
| 0,03 | 1,70 | 1,0229 | 0,6360 | |
| 0,04 | 1,89 | 1,1408 | 0,5823 | |
| 0,03 | 8,19 | 4,9340 | 0,5682 | |
| 0,01 | 4,49 | 2,7043 | 0,5680 | |
| 0,02 | 2,03 | 1,2237 | 0,5554 | |
| 0,05 | 1,80 | 1,0851 | 0,4055 | |
| 0,03 | 0,67 | 0,4024 | 0,4024 | |
| 0,09 | 1,93 | 1,1612 | 0,3997 |
Största minskningarna detta kvartal
Vi använder förändringen i portföljallokeringen eftersom det är det mest meningsfulla måttet. Förändringar kan bero på transaktioner eller förändringar i aktiepriser.
| Värdepapper | Aktier (MM) |
Värde (MM$) |
Portfölj % av | ΔPortfölj % av |
|---|---|---|---|---|
| 0,01 | 0,29 | 0,1750 | −0,9064 | |
| 0,02 | 0,65 | 0,3897 | −0,6682 | |
| 0,16 | 2,10 | 1,2633 | −0,4401 | |
| 0,01 | 4,05 | 2,4391 | −0,4045 | |
| 0,01 | 2,12 | 1,2781 | −0,3981 | |
| 0,02 | 1,92 | 1,1545 | −0,2939 | |
| 0,20 | 4,80 | 2,8926 | −0,2338 | |
| 0,02 | 1,07 | 0,6446 | −0,2242 | |
| 0,09 | 1,79 | 1,0768 | −0,2239 | |
| 0,01 | 1,82 | 1,0979 | −0,2145 |
13F- och fond arkiveringar
Denna blankett lämnades in den 2025-07-31 för rapporteringsperioden 2025-06-30. Klicka på länksymbolen för att se hela transaktionshistoriken.
Uppgradera för att låsa upp premiumdata och exportera till Excel![]() .
.
| Värdepapper | Typ | Genomsnittligt aktiepris | Aktier (MM) |
ΔAktier (%) |
ΔAktier (%) |
Värde ($MM) |
Portfölj (%) |
ΔPortfölj (%) |
|
|---|---|---|---|---|---|---|---|---|---|
| VOO / Vanguard Index Funds - Vanguard S&P 500 ETF | 0,02 | −1,43 | 10,60 | 8,95 | 6,3855 | 0,2411 | |||
| VTI / Vanguard Index Funds - Vanguard Total Stock Market ETF | 0,03 | 7,14 | 8,19 | 18,49 | 4,9340 | 0,5682 | |||
| SCHB / Schwab Strategic Trust - Schwab U.S. Broad Market ETF | 0,20 | −12,36 | 4,80 | −2,99 | 2,8926 | −0,2338 | |||
| MSFT / Microsoft Corporation | 0,01 | 0,16 | 4,49 | 32,73 | 2,7043 | 0,5680 | |||
| BRK.B / Berkshire Hathaway Inc. | 0,01 | −1,41 | 4,05 | −10,06 | 2,4391 | −0,4045 | |||
| HII / Huntington Ingalls Industries, Inc. | 0,02 | 0,29 | 3,83 | 18,71 | 2,3090 | 0,2693 | |||
| SPY / SPDR S&P 500 ETF | 0,01 | 0,00 | 3,81 | 10,47 | 2,2944 | 0,1165 | |||
| LINC / Lincoln Educational Services Corporation | 0,16 | −25,47 | 3,65 | 8,27 | 2,2011 | 0,0692 | |||
| KEX / Kirby Corporation | 0,03 | 0,59 | 3,58 | 12,94 | 2,1562 | 0,1547 | |||
| GPK / Graphic Packaging Holding Company | 0,16 | 46,29 | 3,37 | 18,74 | 2,0307 | 0,2376 | |||
| AGM / Federal Agricultural Mortgage Corporation | 0,02 | −0,34 | 3,10 | 3,26 | 1,8674 | −0,0287 | |||
| SENEA / Seneca Foods Corporation | 0,03 | 0,86 | 2,92 | 14,91 | 1,7599 | 0,1541 | |||
| SO / The Southern Company | 0,03 | −1,38 | 2,68 | −1,51 | 1,6163 | −0,1042 | |||
| FCFS / FirstCash Holdings, Inc. | 0,02 | 0,86 | 2,34 | 13,28 | 1,4079 | 0,1050 | |||
| CRDA / Crawford & Co. - Class A | 0,22 | 27,35 | 2,28 | 18,00 | 1,3707 | 0,1527 | |||
| MSGS / Madison Square Garden Sports Corp. | 0,01 | 0,87 | 2,26 | 8,22 | 1,3639 | 0,0428 | |||
| ALL / The Allstate Corporation | 0,01 | −0,56 | 2,17 | −3,34 | 1,3081 | −0,1105 | |||
| CVX / Chevron Corporation | 0,01 | −6,61 | 2,12 | −20,08 | 1,2781 | −0,3981 | |||
| SSTI / SoundThinking, Inc. | 0,16 | 0,95 | 2,10 | −22,25 | 1,2633 | −0,4401 | |||
| THG / The Hanover Insurance Group, Inc. | 0,01 | 0,84 | 2,09 | −1,55 | 1,2606 | −0,0814 | |||
| GLD / SPDR Gold Trust | 0,01 | 2,26 | 2,08 | 8,17 | 1,2519 | 0,0387 | |||
| OLLI / Ollie's Bargain Outlet Holdings, Inc. | 0,02 | 69,52 | 2,03 | 91,97 | 1,2237 | 0,5554 | |||
| MRC / MRC Global Inc. | 0,15 | 92,60 | 2,03 | 130,16 | 1,2230 | 0,6655 | |||
| TTI / TETRA Technologies, Inc. | 0,60 | 15,21 | 2,01 | 15,22 | 1,2087 | 0,1088 | |||
| SIGI / Selective Insurance Group, Inc. | 0,02 | 0,89 | 1,97 | −4,51 | 1,1873 | −0,1162 | |||
| INGM / Ingram Micro Holding Corporation | 0,09 | 36,09 | 1,93 | 59,92 | 1,1612 | 0,3997 | |||
| COKE / Coca-Cola Consolidated, Inc. | 0,02 | 910,42 | 1,92 | −16,44 | 1,1545 | −0,2939 | |||
| NEM / Newmont Corporation | 0,03 | −0,28 | 1,91 | 20,39 | 1,1524 | 0,1484 | |||
| SPB / Spectrum Brands Holdings, Inc. | 0,04 | 189,09 | 1,89 | 114,14 | 1,1408 | 0,5823 | |||
| AZZ / AZZ Inc. | 0,02 | 1,30 | 1,86 | 14,47 | 1,1201 | 0,0942 | |||
| CME / CME Group Inc. | 0,01 | −0,45 | 1,83 | 3,40 | 1,1009 | −0,0151 | |||
| HES / Hess Corporation | 0,01 | 1,12 | 1,82 | −12,32 | 1,0979 | −0,2145 | |||
| PNC / The PNC Financial Services Group, Inc. | 0,01 | −0,63 | 1,80 | 5,38 | 1,0864 | 0,0057 | |||
| ALNT / Allient Inc. | 0,05 | 1,34 | 1,80 | 67,38 | 1,0851 | 0,4055 | |||
| THS / TreeHouse Foods, Inc. | 0,09 | 82,25 | 1,79 | 30,69 | 1,0803 | 0,2134 | |||
| KVUE / Kenvue Inc. | 0,09 | −0,56 | 1,79 | −13,21 | 1,0768 | −0,2239 | |||
| B / Barrick Mining Corporation | 0,09 | 1,77 | 1,0672 | 1,0672 | |||||
| HON / Honeywell International Inc. | 0,01 | −0,67 | 1,76 | 9,23 | 1,0629 | 0,0428 | |||
| PLPC / Preformed Line Products Company | 0,01 | 0,93 | 1,75 | 15,18 | 1,0513 | 0,0941 | |||
| UL / Unilever PLC - Depositary Receipt (Common Stock) | 0,03 | −0,41 | 1,73 | 2,31 | 1,0400 | −0,0258 | |||
| COST / Costco Wholesale Corporation | 0,00 | −0,75 | 1,70 | 3,85 | 1,0245 | −0,0096 | |||
| CSCO / Cisco Systems, Inc. | 0,02 | −0,55 | 1,70 | 11,86 | 1,0230 | 0,0638 | |||
| FTDR / Frontdoor, Inc. | 0,03 | 80,66 | 1,70 | 177,45 | 1,0229 | 0,6360 | |||
| LH / Labcorp Holdings Inc. | 0,01 | −0,36 | 1,69 | 12,37 | 1,0185 | 0,0684 | |||
| MPC / Marathon Petroleum Corporation | 0,01 | −1,76 | 1,67 | 12,03 | 1,0046 | 0,0643 | |||
| WRB / W. R. Berkley Corporation | 0,02 | −0,53 | 1,62 | 2,74 | 0,9728 | −0,0203 | |||
| CCI / Crown Castle Inc. | 0,02 | −0,38 | 1,60 | −1,78 | 0,9632 | −0,0653 | |||
| SCL / Stepan Company | 0,03 | 22,73 | 1,54 | 21,66 | 0,9276 | 0,1285 | |||
| JAAA / Janus Detroit Street Trust - Janus Henderson AAA CLO ETF | 0,03 | 9,62 | 1,54 | 9,71 | 0,9261 | 0,0411 | |||
| DUK / Duke Energy Corporation | 0,01 | −0,58 | 1,45 | −3,78 | 0,8741 | −0,0787 | |||
| UNF / UniFirst Corporation | 0,01 | 0,94 | 1,40 | 9,14 | 0,8419 | 0,0335 | |||
| LMT / Lockheed Martin Corporation | 0,00 | −0,14 | 1,34 | 3,56 | 0,8062 | −0,0102 | |||
| XOM / Exxon Mobil Corporation | 0,01 | 0,82 | 1,29 | −8,58 | 0,7771 | −0,1144 | |||
| WMG / Warner Music Group Corp. | 0,05 | −0,48 | 1,28 | −13,51 | 0,7713 | −0,1639 | |||
| PSN / Parsons Corporation | 0,02 | 1,35 | 1,27 | 22,85 | 0,7644 | 0,1121 | |||
| AVD / American Vanguard Corporation | 0,32 | 31,81 | 1,26 | 17,49 | 0,7567 | 0,0811 | |||
| RTO / Rentokil Initial plc - Depositary Receipt (Common Stock) | 0,05 | −0,48 | 1,16 | 4,31 | 0,6997 | −0,0036 | |||
| CCK / Crown Holdings, Inc. | 0,01 | −0,61 | 1,15 | 14,67 | 0,6924 | 0,0594 | |||
| FOX / Fox Corporation | 0,02 | −0,47 | 1,15 | −2,55 | 0,6901 | −0,0520 | |||
| CNX / CNX Resources Corporation | 0,03 | 1,33 | 1,11 | 8,37 | 0,6709 | 0,0221 | |||
| IBKR / Interactive Brokers Group, Inc. | 0,02 | 299,10 | 1,08 | 33,54 | 0,6524 | 0,1402 | |||
| SYY / Sysco Corporation | 0,01 | −0,48 | 1,08 | 0,47 | 0,6497 | −0,0284 | |||
| WMB / The Williams Companies, Inc. | 0,02 | −25,99 | 1,07 | −22,18 | 0,6446 | −0,2242 | |||
| CDW / CDW Corporation | 0,01 | −0,39 | 1,05 | 10,97 | 0,6343 | 0,0352 | |||
| JNJ / Johnson & Johnson | 0,01 | 0,19 | 1,04 | −7,79 | 0,6282 | −0,0855 | |||
| NSC / Norfolk Southern Corporation | 0,00 | −0,48 | 1,02 | 7,61 | 0,6135 | 0,0155 | |||
| MZTI / The Marzetti Company | 0,01 | 0,33 | 0,99 | −1,01 | 0,5939 | −0,0347 | |||
| WMT / Walmart Inc. | 0,01 | −0,56 | 0,98 | 10,80 | 0,5873 | 0,0314 | |||
| LKQ / LKQ Corporation | 0,03 | −0,88 | 0,96 | −13,76 | 0,5777 | −0,1247 | |||
| JPM / JPMorgan Chase & Co. | 0,00 | −0,60 | 0,91 | 17,55 | 0,5490 | 0,0591 | |||
| VZ / Verizon Communications Inc. | 0,02 | −5,61 | 0,91 | −10,00 | 0,5479 | −0,0901 | |||
| MNRO / Monro, Inc. | 0,06 | 6,23 | 0,90 | 9,58 | 0,5446 | 0,0230 | |||
| MRK / Merck & Co., Inc. | 0,01 | −5,88 | 0,87 | −17,02 | 0,5260 | −0,1384 | |||
| SLRC / SLR Investment Corp. | 0,05 | −13,06 | 0,87 | −16,73 | 0,5247 | −0,1363 | |||
| AVGO / Broadcom Inc. | 0,00 | −2,23 | 0,81 | 61,23 | 0,4886 | 0,1704 | |||
| LAND / Gladstone Land Corporation | 0,08 | 2,96 | 0,76 | −0,52 | 0,4595 | −0,0245 | |||
| BRK.A / Berkshire Hathaway Inc. | 0,00 | 0,00 | 0,73 | −8,77 | 0,4390 | −0,0652 | |||
| GENC / Gencor Industries, Inc. | 0,05 | 14,77 | 0,68 | 32,10 | 0,4095 | 0,0846 | |||
| TITN / Titan Machinery Inc. | 0,03 | 0,67 | 0,4024 | 0,4024 | |||||
| UTI / Universal Technical Institute, Inc. | 0,02 | −70,74 | 0,65 | −61,43 | 0,3897 | −0,6682 | |||
| V / Visa Inc. | 0,00 | −3,36 | 0,63 | −2,01 | 0,3813 | −0,0270 | |||
| SHEL / Shell plc - Depositary Receipt (Common Stock) | 0,01 | −6,81 | 0,56 | −10,48 | 0,3347 | −0,0572 | |||
| MA / Mastercard Incorporated | 0,00 | −9,22 | 0,53 | −6,84 | 0,3199 | −0,0405 | |||
| CMDY / iShares U.S. ETF Trust - iShares Bloomberg Roll Select Commodity Strategy ETF | 0,01 | 7,71 | 0,50 | 4,59 | 0,3023 | −0,0004 | |||
| WTRG / Essential Utilities, Inc. | 0,01 | −1,20 | 0,45 | −7,22 | 0,2716 | −0,0352 | |||
| BINC / BlackRock ETF Trust II - iShares Flexible Income Active ETF | 0,01 | −8,03 | 0,43 | −7,26 | 0,2617 | −0,0340 | |||
| IAU / iShares Gold Trust | 0,01 | 9,26 | 0,40 | 15,36 | 0,2403 | 0,0223 | |||
| JBBB / Janus Detroit Street Trust - Janus Henderson B-BBB CLO ETF | 0,01 | −3,24 | 0,40 | −4,12 | 0,2386 | −0,0224 | |||
| IVW / iShares Trust - iShares S&P 500 Growth ETF | 0,00 | 0,00 | 0,38 | 18,55 | 0,2273 | 0,0264 | |||
| HUM / Humana Inc. | 0,00 | −0,13 | 0,37 | −7,71 | 0,2238 | −0,0305 | |||
| VUG / Vanguard Index Funds - Vanguard Growth ETF | 0,00 | 0,00 | 0,37 | 18,27 | 0,2223 | 0,0252 | |||
| VSTS / Vestis Corporation | 0,06 | 1,33 | 0,35 | −41,39 | 0,2137 | −0,1683 | |||
| FMC / FMC Corporation | 0,01 | −0,87 | 0,31 | −1,91 | 0,1856 | −0,0128 | |||
| RVTY / Revvity, Inc. | 0,00 | −11,64 | 0,30 | −19,36 | 0,1835 | −0,0547 | |||
| VIRT / Virtu Financial, Inc. | 0,01 | −85,56 | 0,29 | −83,06 | 0,1750 | −0,9064 | |||
| VTV / Vanguard Index Funds - Vanguard Value ETF | 0,00 | 0,00 | 0,28 | 2,20 | 0,1685 | −0,0042 | |||
| EQT / EQT Corporation | 0,00 | −0,05 | 0,24 | 9,17 | 0,1434 | 0,0056 | |||
| DG / Dollar General Corporation | 0,00 | 0,24 | 0,1420 | 0,1420 | |||||
| DLN / WisdomTree Trust - WisdomTree U.S. LargeCap Dividend Fund | 0,00 | 0,00 | 0,22 | 3,24 | 0,1347 | −0,0018 | |||
| KO / The Coca-Cola Company | 0,00 | −18,19 | 0,21 | −19,29 | 0,1238 | −0,0368 | |||
| PG / The Procter & Gamble Company | 0,00 | −100,00 | 0,00 | 0,0000 | |||||
| GOLD / Barrick Mining Corporation | 0,00 | −100,00 | 0,00 | 0,0000 | |||||
| HNRG / Hallador Energy Company | 0,00 | −100,00 | 0,00 | 0,0000 | |||||
| MP / MP Materials Corp. | 0,00 | −100,00 | 0,00 | 0,0000 | |||||
| NWE / NorthWestern Energy Group, Inc. | 0,00 | −100,00 | 0,00 | 0,0000 | |||||
| FIGS / FIGS, Inc. | 0,00 | −100,00 | 0,00 | 0,0000 | |||||
| HCWB / HCW Biologics Inc. | 0,00 | −100,00 | 0,00 | 0,0000 |