Grundläggande statistik
| Institutionella ägare | 157 total, 157 long only, 0 short only, 0 long/short - change of 11,35% MRQ |
| Genomsnittlig portföljallokering | 0.1090 % - change of 0,60% MRQ |
| Institutionella aktier (lång) | 5 004 450 (ex 13D/G) - change of 0,46MM shares 10,15% MRQ |
| Institutionellt värde (lång) | $ 197 580 USD ($1000) |
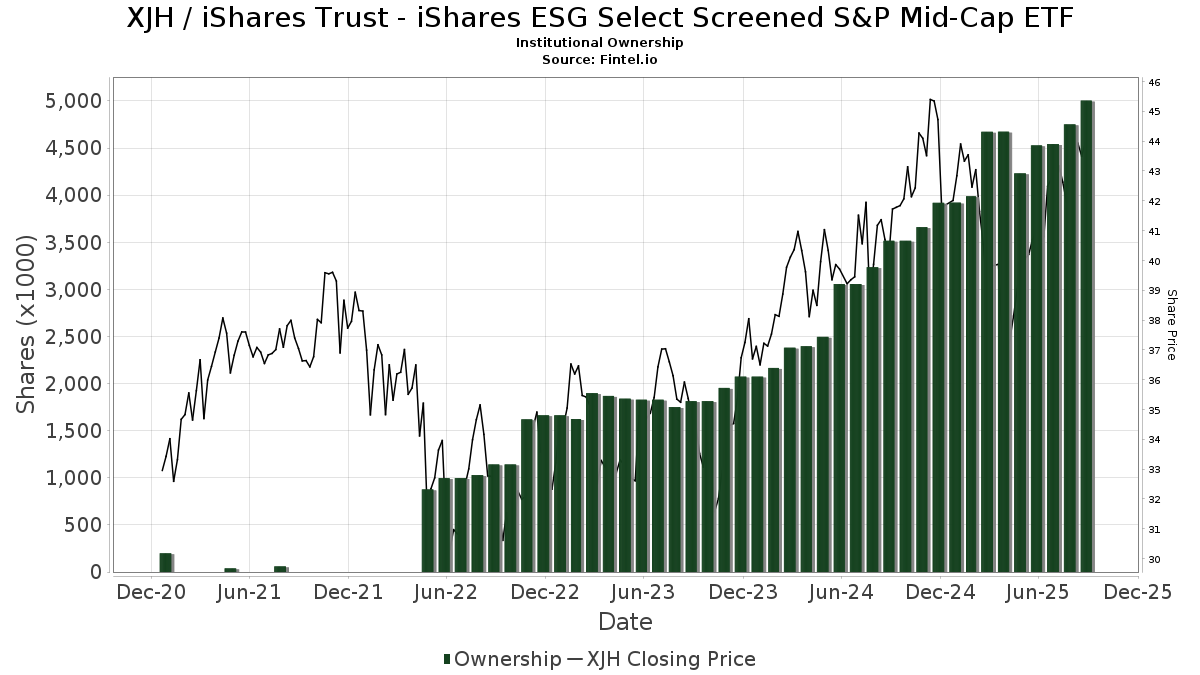
Institutionellt ägande och aktieägare
iShares Trust - iShares ESG Select Screened S&P Mid-Cap ETF (US:XJH) har 157 Institutionella ägare och aktieägare som har lämnat in 13D/G- eller 13F-formulär till Securities Exchange Commission (SEC). Dessa institut innehar totalt 5,004,450 aktier. Största aktieägare inkluderar Bank Of America Corp /de/, Raymond James Financial Inc, Eastern Bank, Mariner, LLC, LPL Financial LLC, Bailard, Inc., Shira Ridge Wealth Management, Litman Gregory Asset Management LLC, Miracle Mile Advisors, LLC, and Koss-Olinger Consulting, LLC .
iShares Trust - iShares ESG Select Screened S&P Mid-Cap ETF (BATS:XJH) Institutionell ägarstruktur visar institutioners och fonders nuvarande positioner i företaget, samt de senaste förändringarna i positionernas storlek. Större aktieägare kan vara enskilda investerare, fonder, hedgefonder eller institutioner. Bilaga 13D visar att investeraren äger (eller ägde) mer än 5% av företaget och avser (eller avsåg) att aktivt eftersträva en förändring av affärsstrategin. Schedule 13G indikerar en passiv investering på över 5%.
The share price as of September 12, 2025 is 44,23 / share. Previously, on September 13, 2024, the share price was 41,15 / share. This represents an increase of 7,49% over that period.
Fondsentimentets poäng
Fondsentimentet poängen(fka Ägarackumulation-poäng) visar vilka aktier som är mest köpta av fonder. Det är resultatet av en sofistikerad kvantitativ flerfaktormodell som identifierar företag med de högsta nivåerna av institutionell ackumulering. Poängsättningsmodellen använder en kombination av den totala ökningen av redovisade ägare, förändringarna i portföljallokeringarna för dessa ägare och andra mått. Siffran sträcker sig från 0 till 100, där högre siffror indikerar en högre nivå av ackumulering i förhållande till sina konkurrenter, och 50 är genomsnittet.
Uppdateringsfrekvens: Dagligen
Se Ownership Explorer, som innehåller en lista över de högst rankade företagen.
Institutionell sälj/köp-kvot
Förutom att rapportera vanliga eget kapital- och skuldemissioner måste institutioner med mer än 100MM tillgångar under förvaltning också avslöja sina innehav av sälj- och köpoptioner. Eftersom säljoptioner i allmänhet indikerar ett negativt sentiment och köpoptioner indikerar ett positivt sentiment, kan vi få en uppfattning om det övergripande institutionella sentimentet genom att plotta förhållandet mellan säljoptioner och köpoptioner. Diagrammet till höger visar det historiska förhållandet mellan sälj- och köpoptioner för detta instrument.
Genom att använda sälj/köp-kvoten som en indikator på aktieägarnas sentiment undviker man en av de största bristerna med att använda det totala institutionella ägandet, nämligen att en betydande del av de förvaltade tillgångarna investeras passivt för att följa index. Passivt förvaltade fonder köper vanligtvis inte optioner, så indikatorn för sälj/köp-kvoten ger en bättre bild av stämningen i aktivt förvaltade fonder.
13F- och NPORT-arkiveringar
Detaljer om 13F-arkiveringar är gratis. Detaljer om NP-arkiveringar kräver ett premiummedlemskap. Gröna rader indikerar nya positioner. Röda rader indikerar stängda positioner. Klicka på länk symbolen för att se hela transaktionshistoriken.
Uppgradera
för att låsa upp premiumdata och exportera till Excel ![]() .
.
| Fil Datum | Källa | Investerare | Typ | Genomsnittligt pris (beräknat) |
Aktier | Δ Aktier (%) |
Rapporterat värde (1000 USD) |
Δ Värde (%) |
Portföljallokering (%) |
|
|---|---|---|---|---|---|---|---|---|---|---|
| 2025-08-12 | 13F | Deutsche Bank Ag\ | 1 175 | 571,43 | 49 | 700,00 | ||||
| 2025-07-21 | 13F | Cape Ann Savings Bank | 6 039 | 1,68 | 251 | 7,76 | ||||
| 2025-08-01 | 13F | Biltmore Family Office, LLC | 31 248 | 0,00 | 1 297 | 6,23 | ||||
| 2025-04-21 | 13F | Nelson, Van Denburg & Campbell Wealth Management Group, LLC | 0 | −100,00 | 0 | |||||
| 2025-08-05 | 13F | GHP Investment Advisors, Inc. | 678 | 0,30 | 28 | 7,69 | ||||
| 2025-07-09 | 13F | Massmutual Trust Co Fsb/adv | 20 485 | −6,50 | 850 | −0,70 | ||||
| 2025-08-12 | 13F | Nemes Rush Group LLC | 1 305 | 0,31 | 54 | 8,00 | ||||
| 2025-08-13 | 13F | Parkworth Wealth Management, Inc. | 2 594 | 0,31 | 108 | 5,94 | ||||
| 2025-07-18 | 13F | Truist Financial Corp | 9 922 | 3,74 | 412 | 10,19 | ||||
| 2025-07-23 | 13F | Optas, LLC | 14 320 | 4,10 | 594 | 10,61 | ||||
| 2025-07-25 | 13F | Cwm, Llc | 1 762 | 0,00 | 0 | |||||
| 2025-07-29 | 13F | Harbor Asset Planning, Inc. | 823 | 34 | ||||||
| 2025-07-28 | 13F | Harbour Investments, Inc. | 26 886 | 38,62 | 1 116 | 47,29 | ||||
| 2025-08-14 | 13F | Jane Street Group, Llc | 12 245 | 508 | ||||||
| 2025-08-08 | 13F | Good Life Advisors, LLC | 10 046 | 2,85 | 417 | 9,19 | ||||
| 2025-08-19 | 13F | Advisory Services Network, LLC | 78 934 | −9,05 | 3 329 | −1,80 | ||||
| 2025-07-29 | 13F | Signature Estate & Investment Advisors Llc | 5 147 | 214 | ||||||
| 2025-08-07 | 13F | Allworth Financial LP | 123 | 0,82 | 5 | 25,00 | ||||
| 2025-07-29 | 13F | Novare Capital Management Llc | 8 712 | 362 | ||||||
| 2025-07-31 | 13F/A | Avion Wealth | 36 | 0,00 | 0 | |||||
| 2025-08-14 | 13F | Goldman Sachs Group Inc | 30 818 | 0,00 | 1 279 | 6,15 | ||||
| 2025-08-11 | 13F | Aptus Capital Advisors, LLC | 18 579 | 133,11 | 771 | 147,91 | ||||
| 2025-08-14 | 13F | Susquehanna International Group, Llp | 13 867 | 126,22 | 575 | 140,59 | ||||
| 2025-08-11 | 13F | Principal Securities, Inc. | 64 | 20,75 | 3 | 0,00 | ||||
| 2025-08-12 | 13F | Eley Financial Management, Inc | 19 501 | −1,25 | 809 | 4,39 | ||||
| 2025-07-24 | 13F | JNBA Financial Advisors | 81 126 | −6,09 | 3 367 | −0,27 | ||||
| 2025-05-02 | 13F | Napatree Capital Llc | 8 991 | 1,79 | 351 | −4,88 | ||||
| 2025-07-29 | 13F | Stratos Wealth Partners, LTD. | 14 515 | −4,94 | 602 | 1,01 | ||||
| 2025-07-24 | 13F | McKinley Carter Wealth Services, Inc. | 22 844 | −3,58 | 948 | 2,49 | ||||
| 2025-08-06 | 13F | Commonwealth Equity Services, Llc | 63 237 | −7,88 | 3 | 0,00 | ||||
| 2025-04-14 | 13F | Regatta Capital Group, Llc | 0 | −100,00 | 0 | |||||
| 2025-07-21 | 13F | Ameritas Advisory Services, LLC | 80 | 3 | ||||||
| 2025-08-08 | 13F | Creative Planning | 12 589 | 11,77 | 522 | 18,64 | ||||
| 2025-08-11 | 13F | Bradley Foster & Sargent Inc/ct | 8 991 | 373 | ||||||
| 2025-08-01 | 13F | Fort Vancouver Investment Management, LLC | 773 | 6,77 | 32 | 14,29 | ||||
| 2025-07-11 | 13F | Hilltop Wealth Advisors, Llc | 44 254 | 2,80 | 1 837 | 9,22 | ||||
| 2025-08-08 | 13F | Larson Financial Group LLC | 2 540 | 0,99 | 105 | 7,14 | ||||
| 2025-07-29 | 13F | Chicago Partners Investment Group LLC | 8 420 | −2,14 | 364 | 8,36 | ||||
| 2025-07-29 | 13F | Crux Wealth Advisors | 4 865 | −82,25 | 202 | −81,21 | ||||
| 2025-08-08 | 13F | Francis Financial, Inc. | 56 138 | −40,83 | 2 330 | −37,16 | ||||
| 2025-08-13 | 13F | SageView Advisory Group, LLC | 23 095 | 14,34 | 994 | 25,86 | ||||
| 2025-08-11 | 13F | Atlantic Private Wealth, LLC | 15 450 | 0,05 | 641 | 6,30 | ||||
| 2025-07-16 | 13F | Magnus Financial Group LLC | 12 392 | 0,30 | 514 | 6,64 | ||||
| 2025-08-12 | 13F | Proequities, Inc. | 0 | 0 | ||||||
| 2025-07-30 | 13F | Caliber Wealth Management, LLC / KS | 20 394 | 846 | ||||||
| 2025-08-15 | 13F | WFA of San Diego, LLC | 791 | 0,00 | 33 | −3,03 | ||||
| 2025-08-01 | 13F | Envestnet Asset Management Inc | 28 772 | −7,87 | 1 194 | −2,13 | ||||
| 2025-08-13 | 13F | Milestone Investment Advisors LLC | 120 | 0,00 | 5 | 0,00 | ||||
| 2025-08-12 | 13F | Marshall & Sterling Wealth Advisors Inc. | 5 733 | −11,92 | 237 | −6,69 | ||||
| 2025-07-18 | 13F | First United Bank Trust/ | 5 925 | −39,11 | 246 | −35,53 | ||||
| 2025-07-29 | 13F | Stordahl Capital Management, Inc. | 11 724 | 37,59 | 487 | 46,39 | ||||
| 2025-07-11 | 13F | Capital Advantage, Inc. | 0 | −100,00 | 0 | |||||
| 2025-08-14 | 13F | Mercer Global Advisors Inc /adv | 0 | −100,00 | 0 | |||||
| 2025-07-15 | 13F | RTD Financial Advisors, Inc. | 30 794 | 4,07 | 1 278 | 10,47 | ||||
| 2025-08-08 | 13F | Bailard, Inc. | 213 721 | −0,97 | 8 869 | 5,20 | ||||
| 2025-08-07 | 13F | Weil Company, Inc. | 9 234 | 48,39 | 383 | 57,61 | ||||
| 2025-07-23 | 13F | Litman Gregory Asset Management LLC | 136 908 | 10,46 | 5 682 | 17,33 | ||||
| 2025-08-18 | 13F/A | National Bank Of Canada /fi/ | 160 | 0,00 | 7 | 0,00 | ||||
| 2025-07-25 | 13F | Wells Financial Advisors INC | 800 | 0,00 | 33 | 6,45 | ||||
| 2025-07-22 | 13F | Mascoma Wealth Management LLC | 1 994 | −6,87 | 83 | −1,20 | ||||
| 2025-08-04 | 13F | Pensionmark Financial Group, Llc | 68 178 | −10,49 | 2 829 | −4,91 | ||||
| 2025-07-15 | 13F | Carr Financial Group Corp | 0 | −100,00 | 0 | |||||
| 2025-07-18 | 13F | Rogco, Lp | 4 921 | 0,20 | 204 | 6,81 | ||||
| 2025-07-22 | 13F | Sage Financial Group Inc | 30 014 | 8,53 | 1 246 | 15,28 | ||||
| 2025-07-25 | 13F | Pathway Financial Advisors LLC | 10 559 | 0,00 | 438 | 6,31 | ||||
| 2025-07-23 | 13F | 1 North Wealth Services Llc | 245 | 0,00 | 10 | 11,11 | ||||
| 2025-07-10 | 13F | Mogy Joel R Investment Counsel Inc | 3 000 | 0,00 | 124 | 5,98 | ||||
| 2025-07-11 | 13F | Caldwell Securities, Inc | 991 | 0,00 | 41 | 7,89 | ||||
| 2025-07-31 | 13F | Opes Wealth Management LLC | 39 062 | 14,79 | 1 621 | 21,97 | ||||
| 2025-08-14 | 13F | Mml Investors Services, Llc | 6 037 | −30,82 | 0 | |||||
| 2025-08-04 | 13F | BLB&B Advisors, LLC | 11 866 | 6,51 | 492 | 13,10 | ||||
| 2025-08-14 | 13F | Citadel Advisors Llc | 46 848 | 1 944 | ||||||
| 2025-07-23 | 13F | Dohj, Llc | 86 289 | 43,13 | 3 222 | 36,82 | ||||
| 2025-08-11 | 13F | Pin Oak Investment Advisors Inc | 94 | 0,00 | 0 | |||||
| 2025-08-13 | 13F | Fortress Financial Solutions, LLC | 6 223 | 258 | ||||||
| 2025-09-04 | 13F/A | Advisor Group Holdings, Inc. | 37 055 | 6,00 | 1 538 | 12,59 | ||||
| 2025-08-14 | 13F | Balanced Rock Investment Advisor | 30 961 | −17,27 | 1 285 | −12,18 | ||||
| 2025-08-13 | 13F | Cary Street Partners Financial Llc | 75 097 | 1,22 | 3 117 | 7,52 | ||||
| 2025-07-15 | 13F | RVW Wealth, LLC | 13 694 | −23,93 | 568 | −19,20 | ||||
| 2025-08-04 | 13F | Assetmark, Inc | 37 | 0,00 | 2 | 0,00 | ||||
| 2025-08-11 | 13F | HighTower Advisors, LLC | 29 120 | 3,01 | 1 208 | 9,42 | ||||
| 2025-08-11 | 13F | Beta Wealth Group, Inc. | 14 491 | 601 | ||||||
| 2025-07-24 | 13F | IFP Advisors, Inc | 272 | 17,75 | 11 | 22,22 | ||||
| 2025-08-14 | 13F | Royal Bank Of Canada | 21 096 | −41,65 | 876 | −38,00 | ||||
| 2025-07-18 | 13F | Bartlett & Co. Wealth Management Llc | 965 | 0,00 | 40 | 8,11 | ||||
| 2025-08-13 | 13F | Capital Analysts, Inc. | 10 723 | −0,76 | 0 | |||||
| 2025-08-01 | 13F | Redwood Park Advisors LLC | 210 | 0,48 | 9 | 0,00 | ||||
| 2025-08-11 | 13F | MainStreet Investment Advisors LLC | 20 710 | −6,44 | 859 | −0,58 | ||||
| 2025-08-19 | 13F | Asset Dedication, LLC | 3 690 | 158,95 | 153 | 178,18 | ||||
| 2025-08-07 | 13F | Addison Advisors LLC | 700 | 0,00 | 29 | 7,41 | ||||
| 2025-08-11 | 13F | Birchbrook, Inc. | 19 585 | 40,84 | 813 | 49,54 | ||||
| 2025-08-08 | 13F | Smithfield Trust Co | 857 | 0,00 | 0 | |||||
| 2025-07-08 | 13F | First National Corp /ma/ /adv | 6 475 | 5,23 | 269 | 11,67 | ||||
| 2025-07-21 | 13F | Impact Investors, Inc | 6 821 | 0,98 | 283 | 7,60 | ||||
| 2025-07-23 | 13F | Sax Wealth Advisors, Llc | 6 334 | 0,00 | 263 | 6,07 | ||||
| 2025-08-14 | 13F | Bank Of America Corp /de/ | 588 393 | 9,85 | 24 418 | 16,69 | ||||
| 2025-08-11 | 13F | CBIZ Investment Advisory Services, LLC | 24 | 4,35 | 1 | |||||
| 2025-08-11 | 13F | Ritter Daniher Financial Advisory LLC / DE | 1 600 | 0,00 | 66 | 6,45 | ||||
| 2025-07-10 | 13F | Wealth Enhancement Advisory Services, Llc | 15 771 | −15,09 | 673 | −7,17 | ||||
| 2025-08-14 | 13F | McIlrath & Eck, LLC | 1 083 | 0,00 | 45 | 4,76 | ||||
| 2025-08-11 | 13F | Amara Financial, Llc. | 8 177 | −15,92 | 339 | −10,55 | ||||
| 2025-07-14 | 13F | Sound Stewardship, LLC | 5 301 | 220 | ||||||
| 2025-08-11 | 13F | Estate Counselors, LLC | 7 390 | 307 | ||||||
| 2025-08-11 | 13F | Private Advisor Group, LLC | 29 450 | −20,18 | 1 222 | −15,20 | ||||
| 2025-05-14 | 13F | Oarsman Capital, Inc. | 0 | −100,00 | 0 | |||||
| 2025-08-12 | 13F | Steward Partners Investment Advisory, Llc | 30 771 | 2,26 | 1 277 | 8,60 | ||||
| 2025-08-26 | 13F/A | Thrivent Financial For Lutherans | 97 066 | 4 | ||||||
| 2025-07-14 | 13F | Armstrong Advisory Group, Inc | 1 159 | 15,21 | 48 | 14,29 | ||||
| 2025-07-18 | 13F | Cantor Fitzgerald Investment Adviser L.p. | 6 872 | −1,09 | 285 | 5,17 | ||||
| 2025-08-12 | 13F | SRS Capital Advisors, Inc. | 2 640 | −47,29 | 110 | −44,10 | ||||
| 2025-07-23 | 13F | Arcadia Investment Advisors Llc | 2 816 | 1,15 | 117 | 7,41 | ||||
| 2025-08-12 | 13F | MAI Capital Management | 7 243 | 3,58 | 301 | 9,89 | ||||
| 2025-08-08 | 13F | Better Money Decisions, LLC | 21 743 | 4,07 | 902 | 10,54 | ||||
| 2025-07-25 | 13F | Stephens Consulting, LLC | 3 099 | −2,36 | 129 | 3,23 | ||||
| 2025-05-07 | 13F | JSF Financial, LLC | 0 | −100,00 | 0 | |||||
| 2025-08-12 | 13F | Coldstream Capital Management Inc | 24 806 | −24,66 | 1 029 | −19,98 | ||||
| 2025-07-30 | 13F | Whittier Trust Co Of Nevada Inc | 710 | 0,00 | 29 | 7,41 | ||||
| 2025-08-05 | 13F | Key FInancial Inc | 330 | 0,00 | 14 | 8,33 | ||||
| 2025-07-10 | 13F | Shira Ridge Wealth Management | 141 548 | 4,13 | 5 874 | 10,62 | ||||
| 2025-07-21 | 13F | Financial Council Asset Management Inc | 5 313 | 0,08 | 220 | 6,28 | ||||
| 2025-08-13 | 13F | Baird Financial Group, Inc. | 13 843 | 0,00 | 574 | 6,30 | ||||
| 2025-07-25 | 13F | Wealth Advisory Team LLC | 17 010 | 706 | ||||||
| 2025-08-01 | 13F | Bessemer Group Inc | 21 985 | 1 | ||||||
| 2025-08-14 | 13F | Mariner, LLC | 286 555 | 13,45 | 11 892 | 20,51 | ||||
| 2025-08-14 | 13F | Colony Group, LLC | 17 940 | 47,50 | 745 | 56,63 | ||||
| 2025-07-23 | 13F | Armbruster Capital Management, Inc. | 8 175 | 6,51 | 339 | 13,38 | ||||
| 2025-08-14 | 13F | Raymond James Financial Inc | 534 644 | 1,07 | 22 188 | 7,36 | ||||
| 2025-07-25 | NP | MIDE - Xtrackers S&P MidCap 400 ESG ETF | 850 | −22,73 | 34 | −24,44 | ||||
| 2025-07-10 | 13F | Affiance Financial, LLC | 31 214 | 6,73 | 1 295 | 13,40 | ||||
| 2025-08-12 | 13F | Tarbox Family Office, Inc. | 8 318 | −4,61 | 345 | 1,47 | ||||
| 2025-08-12 | 13F | Jpmorgan Chase & Co | 594 | 266,67 | 25 | 300,00 | ||||
| 2025-07-22 | 13F | Valley National Advisers Inc | 971 | 0 | ||||||
| 2025-07-22 | 13F | Berkshire Money Management, Inc. | 1 000 | 42 | ||||||
| 2025-07-18 | 13F | PFG Investments, LLC | 7 633 | 7,31 | 317 | 14,08 | ||||
| 2025-07-30 | 13F | Whittier Trust Co | 20 309 | 0,00 | 843 | 6,18 | ||||
| 2025-07-30 | 13F | D.a. Davidson & Co. | 20 957 | −3,74 | 870 | 2,24 | ||||
| 2025-08-12 | 13F | Global Retirement Partners, LLC | 4 517 | 44,59 | 187 | 43,85 | ||||
| 2025-08-13 | 13F | Congress Wealth Management LLC / DE / | 15 091 | 16,85 | 626 | 24,21 | ||||
| 2025-08-15 | 13F | Morgan Stanley | 1 961 | 29,10 | 81 | 37,29 | ||||
| 2025-07-17 | 13F | Hanson & Doremus Investment Management | 1 118 | 0,00 | 0 | |||||
| 2025-07-31 | 13F | Cambridge Investment Research Advisors, Inc. | 29 446 | −30,15 | 1 | 0,00 | ||||
| 2025-08-15 | 13F | CI Private Wealth, LLC | 23 020 | 6,88 | 955 | 13,56 | ||||
| 2025-08-01 | 13F | Koss-Olinger Consulting, LLC | 135 265 | −9,33 | 5 613 | −3,71 | ||||
| 2025-08-12 | 13F | Wood Tarver Financial Group, LLC | 2 442 | 0,49 | 0 | −100,00 | ||||
| 2025-08-13 | 13F | Portland Global Advisors LLC | 14 335 | 7,14 | 595 | 13,79 | ||||
| 2025-07-18 | 13F | Trilogy Capital Inc. | 27 676 | 1,62 | 1 149 | 7,89 | ||||
| 2025-07-25 | 13F | NorthRock Partners, LLC | 16 030 | 3,38 | 665 | 9,92 | ||||
| 2025-08-13 | 13F | Northwestern Mutual Wealth Management Co | 21 143 | 17,64 | 877 | 24,93 | ||||
| 2025-07-09 | 13F | Alesco Advisors Llc | 7 742 | 1,22 | 321 | 7,72 | ||||
| 2025-08-08 | 13F | Cetera Investment Advisers | 43 066 | 22,74 | 1 787 | 30,44 | ||||
| 2025-08-15 | 13F | Urban Financial Advisory Corp | 0 | −100,00 | 0 | |||||
| 2025-07-23 | 13F | Values Added Financial LLC | 14 217 | 590 | ||||||
| 2025-08-14 | 13F | Fmr Llc | 862 | 0,00 | 36 | 6,06 | ||||
| 2025-05-15 | 13F | Captrust Financial Advisors | 0 | −100,00 | 0 | |||||
| 2025-07-25 | 13F | Joel Adams & Associates, Inc. | 8 456 | 351 | ||||||
| 2025-07-24 | 13F | Us Bancorp \de\ | 867 | −26,90 | 36 | −23,91 | ||||
| 2025-07-24 | 13F | Robertson Stephens Wealth Management, LLC | 20 792 | 9,93 | 863 | 16,80 | ||||
| 2025-08-12 | 13F | Armor Investment Advisors, LLC | 2 226 | 0,00 | 92 | 6,98 | ||||
| 2025-08-04 | 13F | Spire Wealth Management | 84 | 0,00 | 3 | 0,00 | ||||
| 2025-08-12 | 13F | LPL Financial LLC | 214 676 | 13,71 | 8 909 | 20,80 | ||||
| 2025-08-14 | 13F | Integrated Wealth Concepts LLC | 11 339 | 26,47 | 471 | 34,29 | ||||
| 2025-08-07 | 13F | Topel & Distasi Wealth Management, LLC | 19 118 | 6,39 | 793 | 12,96 | ||||
| 2025-05-08 | 13F | Wrapmanager Inc | 0 | −100,00 | 0 | |||||
| 2025-08-05 | 13F | Gould Asset Management Llc /ca/ | 32 270 | −0,72 | 1 339 | 5,52 | ||||
| 2025-07-24 | 13F | Eastern Bank | 321 842 | −1,49 | 13 356 | 4,64 | ||||
| 2025-08-12 | 13F | Franklin Resources Inc | 95 824 | −3,38 | 3 977 | 2,63 | ||||
| 2025-07-22 | 13F | DAVENPORT & Co LLC | 11 104 | 5,52 | 461 | 11,92 | ||||
| 2025-07-22 | 13F | Miracle Mile Advisors, LLC | 136 719 | 5 674 |