Grundläggande statistik
| Institutionella ägare | 90 total, 90 long only, 0 short only, 0 long/short - change of 3,45% MRQ |
| Genomsnittlig portföljallokering | 0.3492 % - change of 7,13% MRQ |
| Institutionella aktier (lång) | 9 039 516 (ex 13D/G) - change of 0,81MM shares 9,81% MRQ |
| Institutionellt värde (lång) | $ 426 457 USD ($1000) |
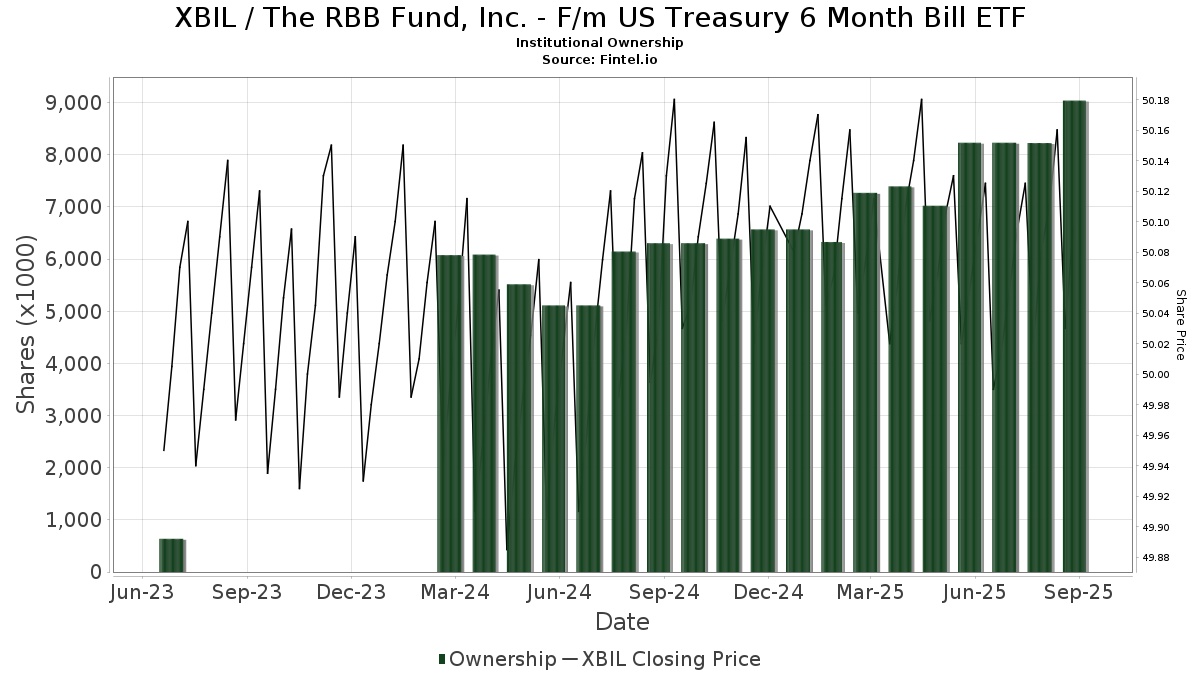
Institutionellt ägande och aktieägare
The RBB Fund, Inc. - F/m US Treasury 6 Month Bill ETF (US:XBIL) har 90 Institutionella ägare och aktieägare som har lämnat in 13D/G- eller 13F-formulär till Securities Exchange Commission (SEC). Dessa institut innehar totalt 9,039,516 aktier. Största aktieägare inkluderar LPL Financial LLC, Acorn Financial Advisory Services Inc /adv, UBS Group AG, Stifel Financial Corp, Raymond James Financial Inc, Good Life Advisors, LLC, Mml Investors Services, Llc, IHT Wealth Management, LLC, 49 Wealth Management, Llc, and Private Advisor Group, LLC .
The RBB Fund, Inc. - F/m US Treasury 6 Month Bill ETF (NasdaqGM:XBIL) Institutionell ägarstruktur visar institutioners och fonders nuvarande positioner i företaget, samt de senaste förändringarna i positionernas storlek. Större aktieägare kan vara enskilda investerare, fonder, hedgefonder eller institutioner. Bilaga 13D visar att investeraren äger (eller ägde) mer än 5% av företaget och avser (eller avsåg) att aktivt eftersträva en förändring av affärsstrategin. Schedule 13G indikerar en passiv investering på över 5%.
The share price as of September 12, 2025 is 50,11 / share. Previously, on September 16, 2024, the share price was 50,11 / share. This represents an increase of 0,00% over that period.
Fondsentimentets poäng
Fondsentimentet poängen(fka Ägarackumulation-poäng) visar vilka aktier som är mest köpta av fonder. Det är resultatet av en sofistikerad kvantitativ flerfaktormodell som identifierar företag med de högsta nivåerna av institutionell ackumulering. Poängsättningsmodellen använder en kombination av den totala ökningen av redovisade ägare, förändringarna i portföljallokeringarna för dessa ägare och andra mått. Siffran sträcker sig från 0 till 100, där högre siffror indikerar en högre nivå av ackumulering i förhållande till sina konkurrenter, och 50 är genomsnittet.
Uppdateringsfrekvens: Dagligen
Se Ownership Explorer, som innehåller en lista över de högst rankade företagen.
Institutionell sälj/köp-kvot
Förutom att rapportera vanliga eget kapital- och skuldemissioner måste institutioner med mer än 100MM tillgångar under förvaltning också avslöja sina innehav av sälj- och köpoptioner. Eftersom säljoptioner i allmänhet indikerar ett negativt sentiment och köpoptioner indikerar ett positivt sentiment, kan vi få en uppfattning om det övergripande institutionella sentimentet genom att plotta förhållandet mellan säljoptioner och köpoptioner. Diagrammet till höger visar det historiska förhållandet mellan sälj- och köpoptioner för detta instrument.
Genom att använda sälj/köp-kvoten som en indikator på aktieägarnas sentiment undviker man en av de största bristerna med att använda det totala institutionella ägandet, nämligen att en betydande del av de förvaltade tillgångarna investeras passivt för att följa index. Passivt förvaltade fonder köper vanligtvis inte optioner, så indikatorn för sälj/köp-kvoten ger en bättre bild av stämningen i aktivt förvaltade fonder.
13F- och NPORT-arkiveringar
Detaljer om 13F-arkiveringar är gratis. Detaljer om NP-arkiveringar kräver ett premiummedlemskap. Gröna rader indikerar nya positioner. Röda rader indikerar stängda positioner. Klicka på länk symbolen för att se hela transaktionshistoriken.
Uppgradera
för att låsa upp premiumdata och exportera till Excel ![]() .
.
| Fil Datum | Källa | Investerare | Typ | Genomsnittligt pris (beräknat) |
Aktier | Δ Aktier (%) |
Rapporterat värde (1000 USD) |
Δ Värde (%) |
Portföljallokering (%) |
|
|---|---|---|---|---|---|---|---|---|---|---|
| 2025-08-08 | 13F | Kingsview Wealth Management, LLC | 5 292 | 265 | ||||||
| 2025-07-29 | 13F | Manchester Financial Inc | 20 236 | 4,68 | 1 015 | 4,64 | ||||
| 2025-07-29 | 13F | Stephens Inc /ar/ | 5 522 | 277 | ||||||
| 2025-08-12 | 13F | LPL Financial LLC | 2 207 827 | 17,77 | 110 723 | 17,72 | ||||
| 2025-04-21 | 13F | ORG Partners LLC | 0 | −100,00 | 0 | |||||
| 2025-07-21 | 13F | Verus Financial Partners, Inc. | 4 100 | 0,00 | 205 | 0,00 | ||||
| 2025-07-28 | 13F | Acorn Financial Advisory Services Inc /adv | 1 171 132 | −4,87 | 58 732 | −4,90 | ||||
| 2025-07-17 | 13F | Alpine Bank Wealth Management | 18 905 | −78,02 | 948 | −78,03 | ||||
| 2025-07-22 | 13F | Belpointe Asset Management LLC | 19 806 | 30,70 | 993 | 30,66 | ||||
| 2025-08-12 | 13F | Financial Advocates Investment Management | 7 736 | 55,65 | 388 | 55,42 | ||||
| 2025-04-24 | 13F | Kraft, Davis & Associates, LLC | 0 | −100,00 | 0 | |||||
| 2025-08-13 | 13F | Denver Wealth Management, Inc. | 70 827 | −13,20 | 3 552 | −13,24 | ||||
| 2025-04-30 | 13F | BCJ Capital Management, LLC | 0 | −100,00 | 0 | |||||
| 2025-05-12 | 13F | Independent Advisor Alliance | 0 | −100,00 | 0 | |||||
| 2025-08-15 | 13F | Morgan Stanley | 55 668 | 52 917,14 | 2 792 | 55 720,00 | ||||
| 2025-08-13 | 13F | Gateway Wealth Partners, LLC | 35 815 | 2,36 | 1 796 | 2,34 | ||||
| 2025-08-04 | 13F | Spire Wealth Management | 17 726 | −26,17 | 889 | −26,25 | ||||
| 2025-08-11 | 13F | Private Advisor Group, LLC | 243 088 | −5,88 | 12 191 | −5,92 | ||||
| 2025-08-12 | 13F | Founders Financial Alliance, LLC | 42 675 | −3,18 | 2 140 | −3,21 | ||||
| 2025-08-14 | 13F | Wells Fargo & Company/mn | 0 | −100,00 | 0 | |||||
| 2025-08-14 | 13F | Jane Street Group, Llc | 47 757 | 57,65 | 2 395 | 57,67 | ||||
| 2025-07-10 | 13F | Wealth Enhancement Advisory Services, Llc | 82 669 | 71,54 | 4 133 | 71,00 | ||||
| 2025-07-22 | 13F | Wealthcare Advisory Partners LLC | 29 089 | 1,49 | 1 459 | 1,46 | ||||
| 2025-07-31 | 13F | Cambridge Investment Research Advisors, Inc. | 6 955 | −7,22 | 0 | |||||
| 2025-08-04 | 13F | Bay Colony Advisory Group, Inc d/b/a Bay Colony Advisors | 4 766 | 239 | ||||||
| 2025-07-16 | 13F | Spinnaker Investment Group, LLC | 62 672 | −10,84 | 3 143 | −10,86 | ||||
| 2025-08-14 | 13F | Goldman Sachs Group Inc | 80 592 | 4 042 | ||||||
| 2025-07-10 | 13F | Atticus Wealth Management, Llc | 13 407 | 2,49 | 672 | 2,44 | ||||
| 2025-07-29 | 13F | International Assets Investment Management, Llc | 19 515 | −9,04 | 979 | −9,11 | ||||
| 2025-08-13 | 13F | Ted Buchan & Co | 6 440 | −6,53 | 323 | −6,67 | ||||
| 2025-08-19 | 13F | Newbridge Financial Services Group, Inc. | 200 | 0,00 | 10 | 0,00 | ||||
| 2025-07-29 | 13F | Stratos Wealth Partners, LTD. | 37 153 | 19,24 | 1 863 | 19,19 | ||||
| 2025-08-14 | 13F | UBS Group AG | 838 226 | 22,31 | 42 037 | 22,26 | ||||
| 2025-08-15 | 13F | Global View Capital Management LLC | 17 513 | 3,02 | 878 | 3,05 | ||||
| 2025-08-04 | 13F | Pensionmark Financial Group, Llc | 16 409 | 162,71 | 823 | 162,62 | ||||
| 2025-07-23 | 13F | Sax Wealth Advisors, Llc | 19 337 | 9,44 | 970 | 9,37 | ||||
| 2025-08-11 | 13F | Advisor Resource Council | 0 | −100,00 | 0 | |||||
| 2025-08-14 | 13F | Ausdal Financial Partners, Inc. | 7 094 | 5,57 | 356 | 5,34 | ||||
| 2025-08-14 | 13F | Stifel Financial Corp | 565 743 | 31,89 | 28 372 | 31,84 | ||||
| 2025-08-08 | 13F | Financial Gravity Companies, Inc. | 220 | −64,29 | 11 | −63,33 | ||||
| 2025-04-30 | 13F | Sofos Investments, Inc. | 616 | −50,92 | 31 | −51,61 | ||||
| 2025-04-29 | 13F | Bank of New York Mellon Corp | 0 | −100,00 | 0 | |||||
| 2025-08-18 | 13F | Geneos Wealth Management Inc. | 4 585 | 0,00 | 230 | −0,43 | ||||
| 2025-07-28 | 13F | Copia Wealth Management | 90 232 | −3,27 | 4 525 | −3,31 | ||||
| 2025-08-14 | 13F | Mariner, LLC | 6 548 | 0,00 | 328 | 0,00 | ||||
| 2025-07-29 | 13F | Portland Financial Advisors Inc | 4 400 | 221 | ||||||
| 2025-04-14 | 13F | Farther Finance Advisors, LLC | 0 | −100,00 | 0 | |||||
| 2025-08-12 | 13F | Global Retirement Partners, LLC | 5 469 | 274 | ||||||
| 2025-08-13 | 13F | Wealthquest Corp | 0 | −100,00 | 0 | |||||
| 2025-08-11 | 13F | Retirement Capital Strategies | 83 272 | 316,78 | 4 176 | 316,77 | ||||
| 2025-04-21 | 13F | Five Pine Wealth Management | 0 | −100,00 | 0 | |||||
| 2025-08-06 | 13F | Moors & Cabot, Inc. | 158 418 | 61,66 | 7 945 | 61,59 | ||||
| 2025-07-30 | 13F | D.a. Davidson & Co. | 0 | −100,00 | 0 | |||||
| 2025-08-07 | 13F | Fonville Wealth Management LLC | 67 075 | 12,14 | 3 364 | 12,10 | ||||
| 2025-07-17 | 13F | David Kennon Inc | 12 743 | −3,28 | 639 | −3,18 | ||||
| 2025-07-23 | 13F | Gentry Private Wealth, Llc | 16 700 | 13,61 | 838 | 13,57 | ||||
| 2025-08-14 | 13F | Mml Investors Services, Llc | 267 484 | −14,33 | 13 | −13,33 | ||||
| 2025-08-08 | 13F | Cetera Investment Advisers | 27 953 | −86,60 | 1 402 | −86,62 | ||||
| 2025-07-31 | 13F | B & T Capital Management DBA Alpha Capital Management | 11 290 | 3,39 | 566 | 3,47 | ||||
| 2025-07-24 | 13F | IFP Advisors, Inc | 29 882 | 37,91 | 1 499 | 37,81 | ||||
| 2025-08-08 | 13F | Good Life Advisors, LLC | 365 523 | 9,97 | 18 331 | 9,92 | ||||
| 2025-08-13 | 13F | Jones Financial Companies Lllp | 0 | −100,00 | 0 | |||||
| 2025-08-15 | 13F | Equitable Holdings, Inc. | 57 354 | 6,47 | 2 876 | 6,44 | ||||
| 2025-07-16 | 13F | ORG Wealth Partners, LLC | 0 | −100,00 | 0 | |||||
| 2025-08-12 | 13F | Steward Partners Investment Advisory, Llc | 5 859 | 1,03 | 294 | 1,03 | ||||
| 2025-05-14 | 13F | CIBC Private Wealth Group, LLC | 0 | −100,00 | 0 | |||||
| 2025-08-13 | 13F | F/M Investments LLC | 83 599 | 4 192 | ||||||
| 2025-07-29 | 13F | Private Trust Co Na | 10 997 | −4,35 | 552 | −4,34 | ||||
| 2025-08-15 | 13F | Kestra Advisory Services, LLC | 5 094 | 255 | ||||||
| 2025-04-21 | 13F | Trivant Custom Portfolio Group, LLC | 0 | −100,00 | 0 | |||||
| 2025-04-29 | 13F | Resources Investment Advisors, LLC. | 0 | −100,00 | 0 | −100,00 | ||||
| 2025-08-12 | 13F | Proequities, Inc. | 0 | 0 | ||||||
| 2025-07-28 | 13F | Revolve Wealth Partners, LLC | 12 704 | −19,71 | 637 | −19,67 | ||||
| 2025-08-01 | 13F | GoalVest Advisory LLC | 5 700 | 0,00 | 286 | 0,00 | ||||
| 2025-08-14 | 13F | Fmr Llc | 133 | 7 | ||||||
| 2025-08-14 | 13F | Raymond James Financial Inc | 401 025 | −0,52 | 20 111 | −0,55 | ||||
| 2025-05-07 | 13F | First Heartland Consultants, Inc. | 0 | −100,00 | 0 | −100,00 | ||||
| 2025-07-22 | 13F | Coastal Investment Advisors, Inc. | 755 | 38 | ||||||
| 2025-08-05 | 13F | Integrity Financial Corp /WA | 500 | 0,00 | 25 | 0,00 | ||||
| 2025-07-18 | 13F | Truist Financial Corp | 15 157 | 1,05 | 760 | 1,06 | ||||
| 2025-08-05 | 13F | Milestone Asset Management, Llc | 200 214 | 1 161,75 | 10 041 | 1 161,31 | ||||
| 2025-08-14 | 13F | Mpwm Advisory Solutions, Llc | 1 218 | 1,00 | 61 | 1,67 | ||||
| 2025-08-06 | 13F | Commonwealth Equity Services, Llc | 215 827 | −7,98 | 11 | −9,09 | ||||
| 2025-07-29 | NP | IAFMX - F/M INVESTMENTS LARGE CAP FOCUSED FUND Investor Shares | 41 697 | 2 091 | ||||||
| 2025-08-14 | 13F | Benjamin Edwards Inc | 61 606 | 6,01 | 3 090 | 5,97 | ||||
| 2025-08-14 | 13F | IHT Wealth Management, LLC | 266 426 | 20,28 | 13 361 | 20,23 | ||||
| 2025-08-11 | 13F | Inspire Advisors, LLC | 0 | −100,00 | 0 | |||||
| 2025-08-14 | 13F | Great Valley Advisor Group, Inc. | 10 989 | 0,02 | 551 | 0,00 | ||||
| 2025-08-14 | 13F | Hrt Financial Lp | 0 | −100,00 | 0 | |||||
| 2025-08-11 | 13F | Principal Securities, Inc. | 3 273 | 164 | ||||||
| 2025-08-07 | 13F | 49 Wealth Management, Llc | 245 931 | −11,97 | 12 333 | −12,01 | ||||
| 2025-08-12 | 13F | Marshall & Sterling Wealth Advisors Inc. | 13 572 | 7,66 | 681 | 7,59 | ||||
| 2025-08-14 | 13F | Susquehanna International Group, Llp | 21 226 | −80,14 | 1 064 | −80,15 | ||||
| 2025-07-17 | 13F | Janney Montgomery Scott LLC | 44 504 | −21,99 | 2 | 0,00 | ||||
| 2025-08-05 | 13F | Flynn Zito Capital Management, Llc | 4 996 | 0,42 | 251 | 0,40 | ||||
| 2025-08-06 | 13F | Prospera Financial Services Inc | 54 692 | 18,39 | 2 743 | 18,34 | ||||
| 2025-08-15 | 13F | Semmax Financial Advisors Inc. | 28 874 | −13,46 | 1 445 | −13,47 | ||||
| 2025-07-22 | 13F | Unique Wealth, Llc | 10 587 | 2,00 | 531 | 1,92 | ||||
| 2025-07-23 | 13F | Heck Capital Advisors, LLC | 10 030 | 29,40 | 503 | 29,64 | ||||
| 2025-07-08 | 13F | Nbc Securities, Inc. | 500 | −50,00 | 0 | |||||
| 2025-08-19 | 13F/A | Pitcairn Co | 12 456 | 0,00 | 625 | 0,00 | ||||
| 2025-08-01 | 13F | Envestnet Asset Management Inc | 67 332 | 92,93 | 3 377 | 92,91 | ||||
| 2025-08-07 | 13F | Ibex Wealth Advisors | 10 386 | −2,10 | 521 | −2,26 | ||||
| 2025-09-04 | 13F/A | Advisor Group Holdings, Inc. | 350 | 250,00 | 18 | 240,00 | ||||
| 2025-08-14 | 13F | Citadel Advisors Llc | 24 838 | −43,96 | 1 246 | −43,99 | ||||
| 2025-08-14 | 13F | Integrated Wealth Concepts LLC | 114 742 | 8,96 | 5 754 | 8,92 | ||||
| 2025-08-14 | 13F | Money Concepts Capital Corp | 15 640 | 0,00 | 784 | 0,00 | ||||
| 2025-07-14 | 13F | Sterling Group Wealth Management, LLC | 4 661 | 234 | ||||||
| 2025-08-11 | 13F | Wbi Investments, Inc. | 4 024 | 0,00 | 202 | 0,00 | ||||
| 2025-07-21 | 13F | Curran Financial Partners, LLC | 15 746 | 38,82 | 790 | 38,66 | ||||
| 2025-07-29 | NP | XFIX - F/m Opportunistic Income ETF | 0 | −100,00 | 0 | −100,00 |