Grundläggande statistik
| Institutionella ägare | 224 total, 224 long only, 0 short only, 0 long/short - change of 1,81% MRQ |
| Genomsnittlig portföljallokering | 0.8168 % - change of −12,01% MRQ |
| Institutionella aktier (lång) | 45 294 410 (ex 13D/G) - change of 0,93MM shares 2,09% MRQ |
| Institutionellt värde (lång) | $ 2 114 758 USD ($1000) |
Institutionellt ägande och aktieägare
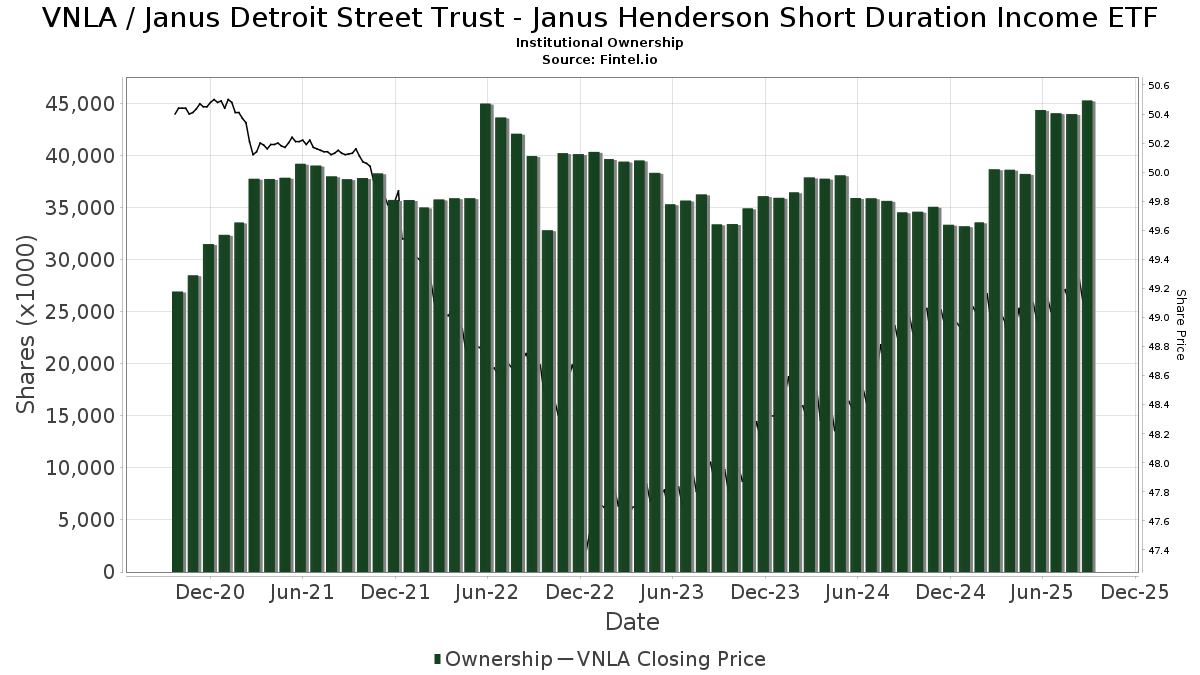
Janus Detroit Street Trust - Janus Henderson Short Duration Income ETF (US:VNLA) har 224 Institutionella ägare och aktieägare som har lämnat in 13D/G- eller 13F-formulär till Securities Exchange Commission (SEC). Dessa institut innehar totalt 45,294,410 aktier. Största aktieägare inkluderar AE Wealth Management LLC, Morgan Stanley, Bank Of America Corp /de/, LPL Financial LLC, Clayton Street Trust - Protective Life Dynamic Allocation Series - Moderate Portfolio, Wells Fargo & Company/mn, Private Advisor Group, LLC, Raymond James Financial Inc, Cetera Investment Advisers, and Leelyn Smith, LLC .
Janus Detroit Street Trust - Janus Henderson Short Duration Income ETF (ARCA:VNLA) Institutionell ägarstruktur visar institutioners och fonders nuvarande positioner i företaget, samt de senaste förändringarna i positionernas storlek. Större aktieägare kan vara enskilda investerare, fonder, hedgefonder eller institutioner. Bilaga 13D visar att investeraren äger (eller ägde) mer än 5% av företaget och avser (eller avsåg) att aktivt eftersträva en förändring av affärsstrategin. Schedule 13G indikerar en passiv investering på över 5%.
The share price as of September 19, 2025 is 49,27 / share. Previously, on September 23, 2024, the share price was 49,00 / share. This represents an increase of 0,55% over that period.
Fondsentimentets poäng
Fondsentimentet poängen(fka Ägarackumulation-poäng) visar vilka aktier som är mest köpta av fonder. Det är resultatet av en sofistikerad kvantitativ flerfaktormodell som identifierar företag med de högsta nivåerna av institutionell ackumulering. Poängsättningsmodellen använder en kombination av den totala ökningen av redovisade ägare, förändringarna i portföljallokeringarna för dessa ägare och andra mått. Siffran sträcker sig från 0 till 100, där högre siffror indikerar en högre nivå av ackumulering i förhållande till sina konkurrenter, och 50 är genomsnittet.
Uppdateringsfrekvens: Dagligen
Se Ownership Explorer, som innehåller en lista över de högst rankade företagen.
AI+ Ask Fintel’s AI assistant about Janus Detroit Street Trust - Janus Henderson Short Duration Income ETF.
Thinking of good questions…
Institutionell sälj/köp-kvot
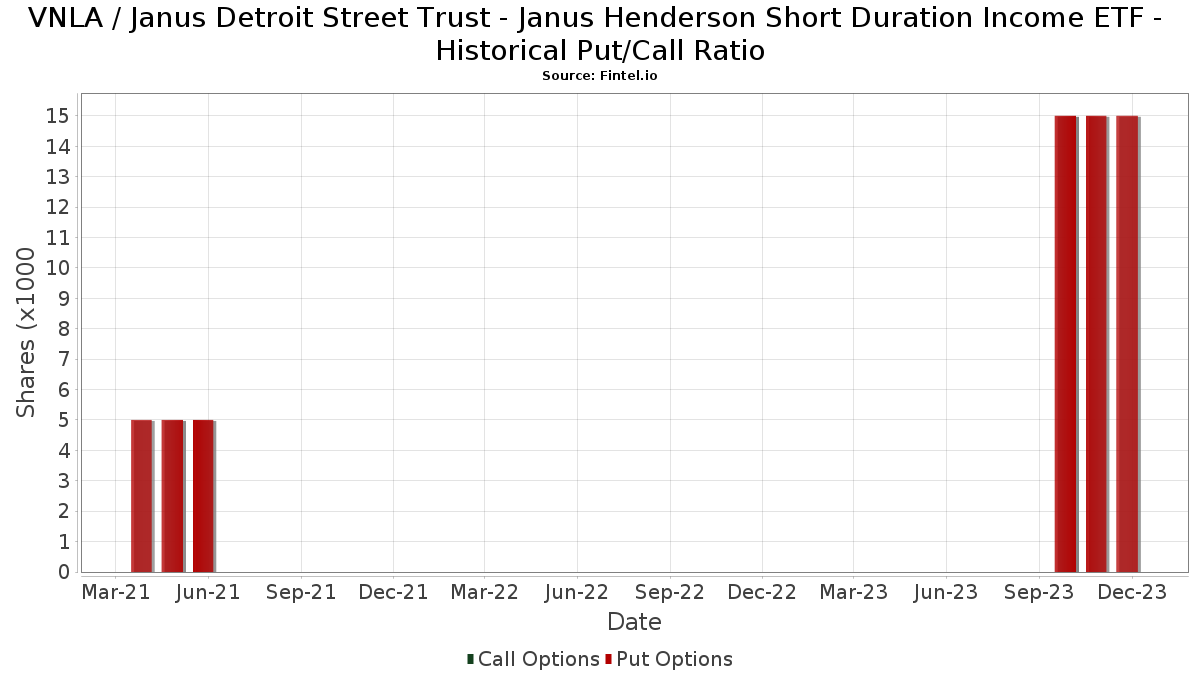
Förutom att rapportera vanliga eget kapital- och skuldemissioner måste institutioner med mer än 100MM tillgångar under förvaltning också avslöja sina innehav av sälj- och köpoptioner. Eftersom säljoptioner i allmänhet indikerar ett negativt sentiment och köpoptioner indikerar ett positivt sentiment, kan vi få en uppfattning om det övergripande institutionella sentimentet genom att plotta förhållandet mellan säljoptioner och köpoptioner. Diagrammet till höger visar det historiska förhållandet mellan sälj- och köpoptioner för detta instrument.
Genom att använda sälj/köp-kvoten som en indikator på aktieägarnas sentiment undviker man en av de största bristerna med att använda det totala institutionella ägandet, nämligen att en betydande del av de förvaltade tillgångarna investeras passivt för att följa index. Passivt förvaltade fonder köper vanligtvis inte optioner, så indikatorn för sälj/köp-kvoten ger en bättre bild av stämningen i aktivt förvaltade fonder.
13F- och NPORT-arkiveringar
Detaljer om 13F-arkiveringar är gratis. Detaljer om NP-arkiveringar kräver ett premiummedlemskap. Gröna rader indikerar nya positioner. Röda rader indikerar stängda positioner. Klicka på länk symbolen för att se hela transaktionshistoriken.
Uppgradera
för att låsa upp premiumdata och exportera till Excel ![]() .
.
| Fil Datum | Källa | Investerare | Typ | Genomsnittligt pris (beräknat) |
Aktier | Δ Aktier (%) |
Rapporterat värde (1000 USD) |
Δ Värde (%) |
Portföljallokering (%) |
|
|---|---|---|---|---|---|---|---|---|---|---|
| 2025-07-18 | 13F | Vicus Capital | 32 133 | 4,58 | 1 581 | 4,64 | ||||
| 2025-08-04 | 13F | Merkkuri Wealth Advisors LLC | 16 867 | 0,85 | 830 | 0,85 | ||||
| 2025-08-05 | 13F | Scarborough Advisors, LLC | 1 | 0 | ||||||
| 2025-07-15 | 13F | Elevated Capital Advisors, LLC | 113 802 | 0,00 | 5 593 | 0,00 | ||||
| 2025-07-23 | 13F | Armstrong, Fleming & Moore, Inc | 0 | −100,00 | 0 | |||||
| 2025-05-07 | 13F | Foundations Investment Advisors, LLC | 0 | −100,00 | 0 | |||||
| 2025-05-01 | 13F | Quest 10 Wealth Builders, Inc. | 1 585 | 342,74 | 78 | 352,94 | ||||
| 2025-08-14 | 13F | Clg Llc | 25 424 | 22,76 | 1 251 | 22,91 | ||||
| 2025-08-12 | 13F | Wayfinding Financial, LLC | 0 | −100,00 | 0 | |||||
| 2025-07-31 | 13F | Oppenheimer & Co Inc | 7 797 | 32,65 | 384 | 32,99 | ||||
| 2025-08-14 | 13F | Bank Of America Corp /de/ | 3 927 893 | 8,41 | 193 252 | 8,52 | ||||
| 2025-08-14 | 13F | Integrated Wealth Concepts LLC | 14 537 | −0,85 | 715 | −0,69 | ||||
| 2025-07-24 | 13F | Endeavor Private Wealth, Inc. | 26 721 | 258,24 | 1 315 | 259,02 | ||||
| 2025-07-29 | 13F | Burford Brothers, Inc. | 267 007 | 21,76 | 13 137 | 21,88 | ||||
| 2025-08-14 | 13F | Garden State Investment Advisory Services LLC | 4 740 | 1,24 | 233 | 1,30 | ||||
| 2025-05-09 | 13F | Commonwealth Financial Services, LLC | 0 | −100,00 | 0 | |||||
| 2025-04-02 | 13F | Clark Asset Management, LLC | 0 | 0 | ||||||
| 2025-08-04 | 13F | Arkadios Wealth Advisors | 27 715 | −2,84 | 1 364 | −2,78 | ||||
| 2025-07-18 | 13F | Truist Financial Corp | 7 535 | 74,74 | 371 | 75,36 | ||||
| 2025-07-31 | 13F | Schneider Downs Wealth Management Advisors, LP | 513 425 | −0,28 | 25 260 | −0,18 | ||||
| 2025-08-12 | 13F | Global Retirement Partners, LLC | 67 371 | 1 098,35 | 3 315 | 1 109,49 | ||||
| 2025-07-22 | 13F | DAVENPORT & Co LLC | 4 532 | 3,94 | 223 | 3,74 | ||||
| 2025-08-14 | 13F | Elevatus Welath Management | 209 815 | 10 323 | ||||||
| 2025-07-30 | 13F | Brookstone Capital Management | 26 569 | 1 307 | ||||||
| 2025-07-15 | 13F | Hidden Cove Wealth Management, LLC | 285 803 | −14,63 | 14 061 | −14,54 | ||||
| 2025-08-07 | 13F | Blackston Financial Advisory Group, LLC | 134 251 | 103,61 | 6 605 | 103,86 | ||||
| 2025-07-25 | 13F | Cwm, Llc | 604 943 | −1,00 | 30 | −3,33 | ||||
| 2025-08-08 | 13F | Capital Investment Advisory Services, LLC | 0 | −100,00 | 0 | −100,00 | ||||
| 2025-08-08 | 13F | Comprehensive Financial Planning, Inc./PA | 9 609 | 1,24 | 473 | 1,29 | ||||
| 2025-08-13 | 13F | Jones Financial Companies Lllp | 1 675 | 259,44 | 82 | 272,73 | ||||
| 2025-08-14 | 13F | Coastal Bridge Advisors, LLC | 193 450 | 0,97 | 9 518 | 1,07 | ||||
| 2025-07-24 | 13F | Capital Advisors, Ltd. LLC | 17 547 | −2,73 | 1 | |||||
| 2025-07-30 | 13F | Capstone Triton Financial Group, LLC | 25 380 | −70,14 | 1 249 | −69,97 | ||||
| 2025-08-14 | 13F | Citadel Advisors Llc | 35 409 | 1 742 | ||||||
| 2025-05-15 | 13F/A | Orion Portfolio Solutions, LLC | 36 873 | −7,36 | 1 812 | −6,89 | ||||
| 2025-07-18 | 13F | Dogwood Wealth Management LLC | 0 | −100,00 | 0 | |||||
| 2025-08-15 | 13F | Asset Allocation Strategies LLC | 12 991 | −4,88 | 639 | −4,77 | ||||
| 2025-08-14 | 13F | Hurley Capital, LLC | 433 | 0,00 | 21 | 0,00 | ||||
| 2025-08-13 | 13F | Renaissance Technologies Llc | 549 915 | −32,97 | 27 056 | −32,91 | ||||
| 2025-07-30 | 13F | Loring Wolcott & Coolidge Fiduciary Advisors Llp/ma | 1 004 | 0,00 | 49 | 0,00 | ||||
| 2025-07-22 | 13F | Partners Wealth Management, Llc | 33 054 | 0,00 | 1 618 | −0,37 | ||||
| 2025-08-04 | 13F | Assetmark, Inc | 1 809 | −13,44 | 89 | −12,75 | ||||
| 2025-05-05 | 13F | Eagle Bay Advisors LLC | 0 | −100,00 | 0 | −100,00 | ||||
| 2025-07-24 | 13F | Financial Security Advisor, Inc. | 7 562 | −1,54 | 372 | −1,33 | ||||
| 2025-07-28 | 13F | Courier Capital Llc | 421 918 | −0,89 | 20 758 | −0,79 | ||||
| 2025-07-07 | 13F | Trust Co | 47 639 | 6,70 | 2 344 | 6,79 | ||||
| 2025-05-02 | 13F | Capital A Wealth Management, LLC | 26 | 1 | ||||||
| 2025-08-13 | 13F | Greenwich Wealth Management LLC | 157 965 | 302,89 | 8 | 600,00 | ||||
| 2025-08-05 | 13F | GPS Wealth Strategies Group, LLC | 14 592 | −7,15 | 718 | −7,12 | ||||
| 2025-04-24 | 13F | Money Concepts Capital Corp | 0 | −100,00 | 0 | |||||
| 2025-08-12 | 13F | Jpmorgan Chase & Co | 99 677 | 50,88 | 4 904 | 51,03 | ||||
| 2025-04-28 | 13F | Pinnacle Financial Partners Inc | 17 281 | 0,00 | 849 | 0,47 | ||||
| 2025-08-11 | 13F | Principal Securities, Inc. | 935 | −13,18 | 46 | −11,54 | ||||
| 2025-08-11 | 13F | Private Advisor Group, LLC | 1 690 937 | 9,13 | 83 194 | 9,24 | ||||
| 2025-05-09 | 13F | GeoWealth Management, LLC | 0 | −100,00 | 0 | −100,00 | ||||
| 2025-08-12 | 13F | Gladstone Institutional Advisory LLC | 11 774 | −37,26 | 579 | −37,20 | ||||
| 2025-08-05 | 13F | Bank of New York Mellon Corp | 6 249 | 307 | ||||||
| 2025-08-14 | 13F | Comerica Bank | 40 974 | 3,36 | 2 016 | 3,44 | ||||
| 2025-08-14 | 13F | Royal Bank Of Canada | 627 087 | −1,97 | 30 853 | −1,88 | ||||
| 2025-07-25 | 13F | Sequoia Financial Advisors, LLC | 4 795 | 0,48 | 236 | 0,43 | ||||
| 2025-08-14 | 13F/A | Rockefeller Capital Management L.P. | 41 515 | 9,26 | 2 043 | 9,37 | ||||
| 2025-07-14 | 13F | U.S. Capital Wealth Advisors, LLC | 14 645 | −54,15 | 721 | −54,11 | ||||
| 2025-07-25 | 13F | Muirfield Wealth Advisors Llc | 6 023 | 296 | ||||||
| 2025-08-07 | 13F | Winthrop Capital Management, LLC | 6 377 | −6,77 | 0 | |||||
| 2025-08-19 | 13F | Advisory Services Network, LLC | 27 917 | 42,54 | 1 373 | 42,72 | ||||
| 2025-04-30 | 13F | AlphaStar Capital Management, LLC | 0 | −100,00 | 0 | |||||
| 2025-08-07 | 13F | Resources Investment Advisors, LLC. | 290 292 | −9,51 | 14 282 | −9,41 | ||||
| 2025-08-08 | 13F | Financial Gravity Companies, Inc. | 199 | 0,00 | 10 | 0,00 | ||||
| 2025-07-07 | 13F | Accelerate Investment Advisors LLC | 4 591 | 0,09 | 226 | 0,00 | ||||
| 2025-08-06 | 13F | Golden State Wealth Management, LLC | 111 516 | −0,57 | 5 487 | −0,47 | ||||
| 2025-08-15 | 13F | Kestra Advisory Services, LLC | 177 015 | 8,57 | 8 709 | 8,69 | ||||
| 2025-07-25 | 13F | LRI Investments, LLC | 25 | 0,00 | 1 | 0,00 | ||||
| 2025-07-23 | 13F | Prime Capital Investment Advisors, LLC | 64 283 | −45,55 | 3 163 | −45,50 | ||||
| 2025-07-30 | 13F | Caliber Wealth Management, LLC / KS | 66 568 | −1,27 | 3 275 | −1,15 | ||||
| 2025-08-08 | 13F | Advyzon Investment Management, LLC | 0 | −100,00 | 0 | |||||
| 2025-07-17 | 13F | Beacon Capital Management, LLC | 4 105 | 93,81 | 202 | 93,27 | ||||
| 2025-04-22 | 13F | Castleview Partners, Llc | 0 | −100,00 | 0 | |||||
| 2025-07-30 | 13F | LifeWealth Investments, LLC | 125 650 | 18,87 | 6 182 | 18,98 | ||||
| 2025-07-10 | 13F | Redhawk Wealth Advisors, Inc. | 197 302 | 9 707 | ||||||
| 2025-08-04 | 13F | Bridgewealth Advisory Group, LLC | 34 014 | 56,36 | 1 673 | 56,50 | ||||
| 2025-08-13 | 13F | Capital Analysts, Inc. | 12 | 0 | ||||||
| 2025-08-06 | 13F | Tradewinds, LLC. | 16 867 | 830 | ||||||
| 2025-08-13 | 13F | Trustmark National Bank Trust Department | 4 591 | 0,00 | 226 | 0,00 | ||||
| 2025-08-14 | 13F | CoreCap Advisors, LLC | 1 578 | −45,55 | 78 | −45,77 | ||||
| 2025-05-20 | 13F | Blue Rock Wealth Management LLC | 133 001 | 3,53 | 6 537 | 4,03 | ||||
| 2025-08-15 | 13F | Captrust Financial Advisors | 4 876 | −8,33 | 240 | −8,43 | ||||
| 2025-07-29 | 13F | Stratos Wealth Partners, LTD. | 11 442 | 53,65 | 563 | 53,55 | ||||
| 2025-08-14 | 13F | Susquehanna International Group, Llp | 7 449 | 366 | ||||||
| 2025-07-24 | 13F | Live Oak Investment Partners | 0 | −100,00 | 0 | −100,00 | ||||
| 2025-08-14 | 13F | Main Street Financial Solutions, LLC | 10 023 | 50,04 | 493 | 50,30 | ||||
| 2025-08-15 | 13F | Howland Capital Management Llc | 98 446 | −7,97 | 4 844 | −7,88 | ||||
| 2025-07-08 | 13F | Ballew Advisors, Inc | 39 566 | −0,49 | 1 940 | 0,00 | ||||
| 2025-07-09 | 13F | Dynamic Advisor Solutions LLC | 399 865 | 3,49 | 19 673 | 3,60 | ||||
| 2025-08-07 | 13F | Allworth Financial LP | 636 | 0,00 | 31 | 0,00 | ||||
| 2025-08-05 | 13F | Huntington National Bank | 0 | |||||||
| 2025-05-02 | 13F | Cullen/frost Bankers, Inc. | 0 | −100,00 | 0 | |||||
| 2025-08-06 | 13F | Commonwealth Equity Services, Llc | 104 879 | 11,60 | 5 | 25,00 | ||||
| 2025-07-14 | 13F | Golden State Equity Partners | 12 395 | 610 | ||||||
| 2025-08-04 | 13F | Spire Wealth Management | 3 934 | 21,83 | 194 | 22,15 | ||||
| 2025-08-06 | 13F | Bensler, LLC | 102 043 | −4,95 | 5 020 | −4,85 | ||||
| 2025-08-06 | 13F | Prospera Financial Services Inc | 6 773 | 0,00 | 333 | 0,30 | ||||
| 2025-08-11 | 13F | Hexagon Capital Partners LLC | 0 | −100,00 | 0 | |||||
| 2025-08-11 | 13F | Kingdom Financial Group LLC. | 29 700 | 1 461 | ||||||
| 2025-07-10 | 13F | Kmg Fiduciary Partners, Llc | 202 758 | 2,46 | 9 976 | 2,56 | ||||
| 2025-07-22 | 13F | Macroview Investment Management Llc | 42 439 | 3,51 | 2 088 | 3,57 | ||||
| 2025-07-14 | 13F | Sowell Financial Services LLC | 39 509 | 2,86 | 1 944 | 2,97 | ||||
| 2025-04-16 | 13F | New Century Financial Group, LLC | 0 | −100,00 | 0 | |||||
| 2025-07-16 | 13F | Dakota Wealth Management | 17 180 | −30,35 | 845 | −30,28 | ||||
| 2025-07-18 | 13F/A | MJT & Associates Financial Advisory Group, Inc. | 82 | 0,00 | 4 | 0,00 | ||||
| 2025-08-04 | 13F | Mesirow Financial Investment Management, Inc. | 5 652 | 0,00 | 278 | 0,36 | ||||
| 2025-07-21 | 13F | Fortis Capital Advisors, LLC | 8 507 | −22,78 | 419 | −22,74 | ||||
| 2025-07-08 | 13F | Atwood & Palmer Inc | 1 080 | −88,31 | 53 | −88,30 | ||||
| 2025-07-17 | 13F | Farmers & Merchants Trust Co of Long Beach | 11 351 | −0,09 | 558 | 0,00 | ||||
| 2025-08-14 | 13F | GWM Advisors LLC | 361 | 1,40 | 18 | 0,00 | ||||
| 2025-05-09 | 13F | Foster Dykema Cabot & Partners, Llc | 0 | −100,00 | 0 | |||||
| 2025-08-12 | 13F | Proequities, Inc. | 0 | 0 | ||||||
| 2025-08-15 | 13F | Prevail Innovative Wealth Advisors, Llc | 9 033 | 444 | ||||||
| 2025-07-29 | 13F | Fundamentun, Llc | 11 577 | 14,00 | 570 | 14,03 | ||||
| 2025-08-07 | 13F | PFG Advisors | 69 355 | 3,12 | 3 412 | 3,24 | ||||
| 2025-07-17 | 13F | Nelson, Van Denburg & Campbell Wealth Management Group, LLC | 13 663 | −1,19 | 672 | −1,03 | ||||
| 2025-08-12 | 13F | Steward Partners Investment Advisory, Llc | 149 011 | 1,07 | 7 331 | 1,17 | ||||
| 2025-08-18 | 13F | Geneos Wealth Management Inc. | 563 584 | 3,59 | 27 728 | 3,70 | ||||
| 2025-07-21 | 13F | Mattern Capital Management, Llc | 26 989 | 34,18 | 1 328 | 34,31 | ||||
| 2025-05-01 | 13F | Bleakley Financial Group, LLC | 0 | −100,00 | 0 | |||||
| 2025-08-12 | 13F | Bedel Financial Consulting, Inc. | 52 280 | −1,80 | 2 572 | −1,19 | ||||
| 2025-07-22 | 13F | Fortitude Advisory Group L.L.C. | 5 000 | 0,00 | 246 | 0,82 | ||||
| 2025-08-08 | 13F | Cornerstone Advisors Asset Management, Inc | 4 099 | 202 | ||||||
| 2025-08-01 | 13F | Rossby Financial, LCC | 1 796 | 0,84 | 88 | 1,15 | ||||
| 2025-08-05 | 13F | EPG Wealth Management LLC | 21 006 | −0,21 | 1 033 | −0,10 | ||||
| 2025-08-14 | 13F | Wells Fargo & Company/mn | 1 694 989 | 11,02 | 83 393 | 11,13 | ||||
| 2025-07-29 | 13F | Koshinski Asset Management, Inc. | 16 518 | −1,60 | 813 | −1,58 | ||||
| 2025-08-12 | 13F | J.w. Cole Advisors, Inc. | 38 840 | 0,06 | 1 911 | 0,16 | ||||
| 2025-08-12 | 13F | Calton & Associates, Inc. | 26 059 | 9,63 | 1 282 | 9,76 | ||||
| 2025-08-14 | 13F | Janus Henderson Group Plc | 101 602 | −96,31 | 4 999 | −96,31 | ||||
| 2025-08-12 | 13F | Fortem Financial Group, Llc | 144 943 | 153,03 | 7 131 | 153,32 | ||||
| 2025-08-12 | 13F | MAI Capital Management | 1 600 | 0,00 | 79 | 0,00 | ||||
| 2025-05-12 | 13F | Fmr Llc | 0 | −100,00 | 0 | |||||
| 2025-08-13 | 13F | IAG Wealth Partners, LLC | 33 360 | 207,41 | 1 641 | 207,88 | ||||
| 2025-07-15 | 13F | Unified Investment Management | 45 398 | 0,04 | 2 234 | 0,13 | ||||
| 2025-08-04 | 13F | Creative Financial Designs Inc /adv | 1 214 | 0,00 | 60 | 0,00 | ||||
| 2025-08-04 | 13F | Bay Colony Advisory Group, Inc d/b/a Bay Colony Advisors | 5 007 | −8,18 | 246 | −8,21 | ||||
| 2025-05-13 | 13F | Elevation Capital Advisory, LLC | 0 | −100,00 | 0 | |||||
| 2025-07-22 | 13F | Ffg Retirement Advisors Llc | 0 | −100,00 | 0 | |||||
| 2025-07-25 | 13F | Concurrent Investment Advisors, LLC | 36 844 | 1,45 | 1 813 | 1,57 | ||||
| 2025-08-14 | 13F | Warren Averett Asset Management, LLC | 167 347 | 1,30 | 8 233 | 1,40 | ||||
| 2025-08-15 | 13F | Tower Research Capital LLC (TRC) | 0 | −100,00 | 0 | |||||
| 2025-07-24 | 13F | Us Bancorp \de\ | 263 | −81,54 | 13 | −82,86 | ||||
| 2025-07-30 | 13F | Bogart Wealth, LLC | 6 190 | 0,00 | 305 | 0,00 | ||||
| 2025-08-14 | 13F | Ancora Advisors, LLC | 30 | 0,00 | 1 | 0,00 | ||||
| 2025-07-10 | 13F | Sovran Advisors, LLC | 100 478 | −15,09 | 4 925 | −14,91 | ||||
| 2025-07-22 | 13F | Wealthcare Advisory Partners LLC | 56 973 | −2,08 | 2 803 | −1,96 | ||||
| 2025-07-07 | 13F | TruWealth Advisors, LLC | 18 301 | 88,07 | 900 | 88,28 | ||||
| 2025-08-12 | NP | KAGCX - Kensington Dynamic Growth Fund Class C Shares | 348 807 | 193,26 | 17 161 | 193,60 | ||||
| 2025-07-23 | 13F | First Financial Group Corp | 108 528 | 1,73 | 5 340 | 1,83 | ||||
| 2025-07-17 | 13F | Janney Montgomery Scott LLC | 95 387 | 14,79 | 5 | 0,00 | ||||
| 2025-08-14 | 13F | Transamerica Financial Advisors, Inc. | 6 | 0,00 | 0 | |||||
| 2025-07-31 | 13F | Cambridge Investment Research Advisors, Inc. | 452 267 | 0,27 | 22 | 0,00 | ||||
| 2025-07-25 | 13F | Atria Wealth Solutions, Inc. | 42 157 | −9,15 | 2 067 | −9,39 | ||||
| 2025-08-26 | 13F | Nautilus Advisors LLC | 25 452 | −25,38 | 1 252 | −25,30 | ||||
| 2025-08-08 | 13F | Hartland & Co., LLC | 18 790 | −28,21 | 924 | −28,15 | ||||
| 2025-08-14 | 13F | Mml Investors Services, Llc | 95 250 | 51,87 | 5 | 33,33 | ||||
| 2025-07-23 | 13F | Friedenthal Financial | 86 631 | −2,98 | 4 262 | −2,87 | ||||
| 2025-08-11 | 13F | Sykon Capital Llc | 5 000 | −59,20 | 246 | −59,14 | ||||
| 2025-08-14 | 13F | Betterment LLC | 84 617 | 9,26 | 4 | 33,33 | ||||
| 2025-08-14 | 13F | Mariner, LLC | 33 039 | −0,04 | 1 626 | 0,06 | ||||
| 2025-07-22 | 13F | Accel Wealth Management | 236 649 | 6,71 | 11 643 | 6,82 | ||||
| 2025-07-31 | 13F | WFA Asset Management Corp | 0 | −100,00 | 0 | |||||
| 2025-08-14 | 13F | Stifel Financial Corp | 82 722 | −38,09 | 4 070 | −38,04 | ||||
| 2025-08-04 | 13F | Buck Wealth Strategies, LLC | 330 912 | 19,24 | 16 281 | 19,36 | ||||
| 2025-07-28 | 13F | BRYN MAWR TRUST Co | 3 100 | 0,00 | 153 | 0,00 | ||||
| 2025-08-08 | 13F | Crossmark Global Holdings, Inc. | 6 209 | 0,00 | 305 | 0,00 | ||||
| 2025-05-06 | 13F | Mendel Money Management | 0 | −100,00 | 0 | |||||
| 2025-08-14 | 13F | Sentinus, LLC | 27 771 | 57,75 | 1 366 | 57,92 | ||||
| 2025-07-28 | 13F | Harbour Investments, Inc. | 80 | −51,52 | 4 | −62,50 | ||||
| 2025-08-14 | 13F | L2 Asset Management, LLC | 4 143 | 204 | ||||||
| 2025-07-28 | 13F | RFG Advisory, LLC | 6 703 | −0,15 | 330 | 0,00 | ||||
| 2025-08-14 | 13F | Hilltop Holdings Inc. | 20 283 | 2,32 | 998 | 2,36 | ||||
| 2025-07-09 | 13F | Tounjian Advisory Partners, Llc | 268 870 | −23,48 | 13 215 | −23,48 | ||||
| 2025-07-21 | 13F | Ameritas Advisory Services, LLC | 3 416 | 168 | ||||||
| 2025-08-14 | 13F | Wiley Bros.-aintree Capital, Llc | 64 003 | 56,44 | 3 153 | 56,74 | ||||
| 2025-05-30 | NP | N/A - Protective Life Dynamic Allocation Series - Conservative Portfolio | 73 430 | −40,08 | 3 609 | −39,26 | ||||
| 2025-08-13 | 13F | Stablepoint Partners, LLC | 222 628 | −1,44 | 10 953 | −1,34 | ||||
| 2025-07-25 | 13F | Apollon Wealth Management, LLC | 73 266 | 15,26 | 3 605 | 15,36 | ||||
| 2025-05-12 | 13F | Independent Advisor Alliance | 0 | −100,00 | 0 | |||||
| 2025-08-14 | 13F | Mercer Global Advisors Inc /adv | 39 952 | −25,50 | 1 966 | −25,43 | ||||
| 2025-07-23 | 13F | Clear Creek Financial Management, LLC | 48 377 | 44,12 | 2 380 | 44,33 | ||||
| 2025-08-14 | 13F | Jane Street Group, Llc | 11 412 | 561 | ||||||
| 2025-09-04 | 13F/A | Advisor Group Holdings, Inc. | 352 548 | 7,46 | 17 347 | 7,58 | ||||
| 2025-08-14 | 13F | Raymond James Financial Inc | 1 092 312 | 7,40 | 53 742 | 7,51 | ||||
| 2025-07-23 | 13F | Castle Rock Wealth Management, LLC | 10 396 | 1,51 | 511 | 2,00 | ||||
| 2025-08-04 | 13F | Pensionmark Financial Group, Llc | 13 881 | −8,82 | 683 | −8,82 | ||||
| 2025-07-16 | 13F | Lloyd Advisory Services, LLC. | 4 917 | 242 | ||||||
| 2025-05-30 | NP | Clayton Street Trust - Protective Life Dynamic Allocation Series - Growth Portfolio | 189 712 | 14,98 | 9 324 | 16,55 | ||||
| 2025-07-18 | 13F | Parsons Capital Management Inc/ri | 56 661 | 17,62 | 2 788 | 17,74 | ||||
| 2025-08-15 | 13F | Morgan Stanley | 5 926 698 | 17,42 | 291 594 | 17,53 | ||||
| 2025-07-31 | 13F | Leelyn Smith, LLC | 769 279 | 2,36 | 37 849 | 2,46 | ||||
| 2025-07-22 | 13F | Belpointe Asset Management LLC | 8 507 | −22,78 | 419 | −22,74 | ||||
| 2025-04-01 | 13F | Massmutual Trust Co Fsb/adv | 0 | −100,00 | 0 | |||||
| 2025-07-30 | 13F | BlueChip Wealth Advisors LLC | 15 494 | 4,73 | 762 | 4,81 | ||||
| 2025-08-14 | 13F | Great Valley Advisor Group, Inc. | 247 121 | 59,71 | 12 158 | 59,88 | ||||
| 2025-07-07 | 13F | Whitaker-Myers Wealth Managers, LTD. | 4 699 | 3,14 | 231 | 3,59 | ||||
| 2025-08-13 | 13F | Millstone Evans Group, LLC | 1 391 | 0,00 | 68 | 0,00 | ||||
| 2025-08-27 | 13F | Barnes Wealth Management Group, Inc | 40 793 | 4,82 | 2 007 | 4,97 | ||||
| 2025-08-12 | 13F | Financial Advocates Investment Management | 30 792 | −1,71 | 1 515 | −1,62 | ||||
| 2025-08-13 | 13F | Legacy Capital Wealth Partners, LLC | 5 950 | 0,00 | 293 | 0,00 | ||||
| 2025-04-30 | 13F | Sofos Investments, Inc. | 199 | −83,94 | 10 | −85,00 | ||||
| 2025-08-14 | 13F | Colony Group, LLC | 18 277 | −16,11 | 899 | −15,98 | ||||
| 2025-07-25 | 13F | Hazlett, Burt & Watson, Inc. | 95 | 0,00 | 0 | |||||
| 2025-07-14 | 13F | Financial Enhancement Group LLC | 241 750 | −3,53 | 11 860 | −3,27 | ||||
| 2025-08-05 | 13F | Trail Ridge Investment Advisors, LLC | 280 971 | 4,39 | 13 824 | 4,49 | ||||
| 2025-05-15 | 13F | Gwn Securities Inc. | 0 | −100,00 | 0 | |||||
| 2025-07-11 | 13F | Farther Finance Advisors, LLC | 27 001 | −81,09 | 1 328 | −81,00 | ||||
| 2025-08-12 | 13F | Richmond Investment Services, LLC | 460 617 | 150,29 | 22 663 | 150,55 | ||||
| 2025-08-11 | 13F | HighTower Advisors, LLC | 186 029 | 13,21 | 9 153 | 13,32 | ||||
| 2025-08-13 | 13F | Capital Advisors Wealth Management, LLC | 9 295 | −17,30 | 457 | −17,21 | ||||
| 2025-08-07 | 13F | 1620 Investment Advisors, Inc. | 255 | 0,00 | 13 | 0,00 | ||||
| 2025-08-07 | 13F | Kestra Private Wealth Services, Llc | 31 346 | 7,78 | 1 542 | 7,91 | ||||
| 2025-08-06 | 13F | Csenge Advisory Group | 12 955 | −0,28 | 637 | 0,16 | ||||
| 2025-08-14 | 13F | Modern Wealth Management, LLC | 35 583 | −3,89 | 1 751 | −3,79 | ||||
| 2025-08-12 | 13F | Marshall & Sterling Wealth Advisors Inc. | 4 478 | −1,86 | 220 | −1,79 | ||||
| 2025-08-15 | 13F | Equitable Holdings, Inc. | 21 256 | −2,07 | 1 046 | −1,97 | ||||
| 2025-05-30 | NP | Clayton Street Trust - Protective Life Dynamic Allocation Series - Moderate Portfolio | 2 391 483 | 50,98 | 117 541 | 53,04 | ||||
| 2025-07-16 | 13F | EdgeRock Capital LLC | 11 421 | 91,92 | 562 | 92,12 | ||||
| 2025-07-16 | 13F | Strategic Investment Solutions, Inc. /IL | 41 | 2 | ||||||
| 2025-05-14 | 13F | Flow Traders U.s. Llc | 0 | −100,00 | 0 | |||||
| 2025-08-13 | 13F | EverSource Wealth Advisors, LLC | 44 539 | −12,93 | 2 191 | −12,85 | ||||
| 2025-07-29 | 13F | Private Trust Co Na | 2 881 | −5,82 | 142 | −6,00 | ||||
| 2025-08-13 | 13F | Northwestern Mutual Wealth Management Co | 611 | 0,00 | 30 | 0,00 | ||||
| 2025-08-08 | 13F | Avantax Advisory Services, Inc. | 11 824 | −10,07 | 582 | −10,06 | ||||
| 2025-08-08 | 13F | Creative Planning | 101 117 | −20,10 | 4 975 | −20,03 | ||||
| 2025-07-08 | 13F | Rise Advisors, LLC | 203 800 | 0,53 | 10 027 | 0,63 | ||||
| 2025-08-13 | 13F | Texas Treasury Safekeeping Trust Co | 686 991 | −47,12 | 34 | −47,62 | ||||
| 2025-07-11 | 13F | Quad-Cities Investment Group, LLC | 5 997 | −21,06 | 295 | −20,91 | ||||
| 2025-08-14 | 13F | Bnp Paribas Arbitrage, Sa | 592 | −85,56 | 29 | −85,57 | ||||
| 2025-08-12 | 13F | LPL Financial LLC | 2 847 670 | 14,62 | 140 105 | 14,73 | ||||
| 2025-08-13 | 13F | Strategic Family Wealth Counselors, L.L.C. | 65 477 | −0,30 | 3 221 | −0,19 | ||||
| 2025-07-21 | 13F | Sovereign Investment Advisors, LLC | 681 397 | 0,35 | 33 525 | 1,80 | ||||
| 2025-08-01 | 13F | Envestnet Asset Management Inc | 131 771 | 86,40 | 6 483 | 86,61 | ||||
| 2025-03-28 | 13F/A | Berkeley, Inc | 0 | −100,00 | 0 | −100,00 | ||||
| 2025-08-06 | 13F | AE Wealth Management LLC | 6 810 378 | 15,46 | 335 071 | 15,57 | ||||
| 2025-08-14 | 13F | UBS Group AG | 0 | −100,00 | 0 | |||||
| 2025-08-14 | 13F | Redwood Financial Network Corp | 66 962 | −0,02 | 3 295 | 0,09 | ||||
| 2025-07-10 | 13F | Wealth Enhancement Advisory Services, Llc | 148 438 | 100,59 | 7 276 | 100,05 | ||||
| 2025-08-14 | 13F | Peak Asset Management, LLC | 70 931 | 5,92 | 3 490 | 6,02 | ||||
| 2025-08-14 | 13F | Family Office Research LLC | 10 132 | 1,25 | 499 | 1,43 | ||||
| 2025-04-23 | 13F | Mascagni Wealth Management, Inc. | 0 | −100,00 | 0 | −100,00 | ||||
| 2025-05-01 | 13F | Smith Thornton Advisors LLC | 0 | −100,00 | 0 | |||||
| 2025-07-29 | 13F | International Assets Investment Management, Llc | 5 728 | 16,23 | 282 | 16,12 | ||||
| 2025-08-08 | 13F | Pnc Financial Services Group, Inc. | 42 | 2 | ||||||
| 2025-04-25 | 13F | Altus Wealth Group LLC | 0 | −100,00 | 0 | |||||
| 2025-08-14 | 13F | Safeguard Investment Advisory Group, LLC | 19 991 | 331,68 | 984 | 333,04 | ||||
| 2025-08-11 | 13F | Citigroup Inc | 2 769 | −17,34 | 136 | −17,07 | ||||
| 2025-08-08 | 13F | Cetera Investment Advisers | 1 021 010 | 34,95 | 50 234 | 35,08 | ||||
| 2025-07-10 | 13F | Focus Financial Network, Inc. | 35 114 | 79,70 | 1 728 | 79,90 | ||||
| 2025-08-19 | 13F | Cape Investment Advisory, Inc. | 61 712 | 2,55 | 3 036 | 2,67 | ||||
| 2025-07-25 | 13F | Northwest Capital Management Inc | 722 | −27,36 | 36 | −27,08 | ||||
| 2025-08-12 | 13F | Kensington Asset Management, LLC | 348 807 | 193,26 | 17 161 | 193,60 | ||||
| 2025-08-14 | 13F | Sunbelt Securities, Inc. | 26 | 62,50 | 1 | |||||
| 2025-08-11 | 13F | Ritter Daniher Financial Advisory LLC / DE | 164 594 | 207,79 | 8 098 | 208,14 | ||||
| 2025-08-27 | 13F/A | Brinker Capital Investments, LLC | 16 920 | −54,11 | 832 | −54,08 |