Grundläggande statistik
| Institutionella ägare | 127 total, 127 long only, 0 short only, 0 long/short - change of 4,10% MRQ |
| Genomsnittlig portföljallokering | 1.5027 % - change of −5,03% MRQ |
| Institutionella aktier (lång) | 59 206 862 (ex 13D/G) - change of −6,08MM shares −9,31% MRQ |
| Institutionellt värde (lång) | $ 2 764 320 USD ($1000) |
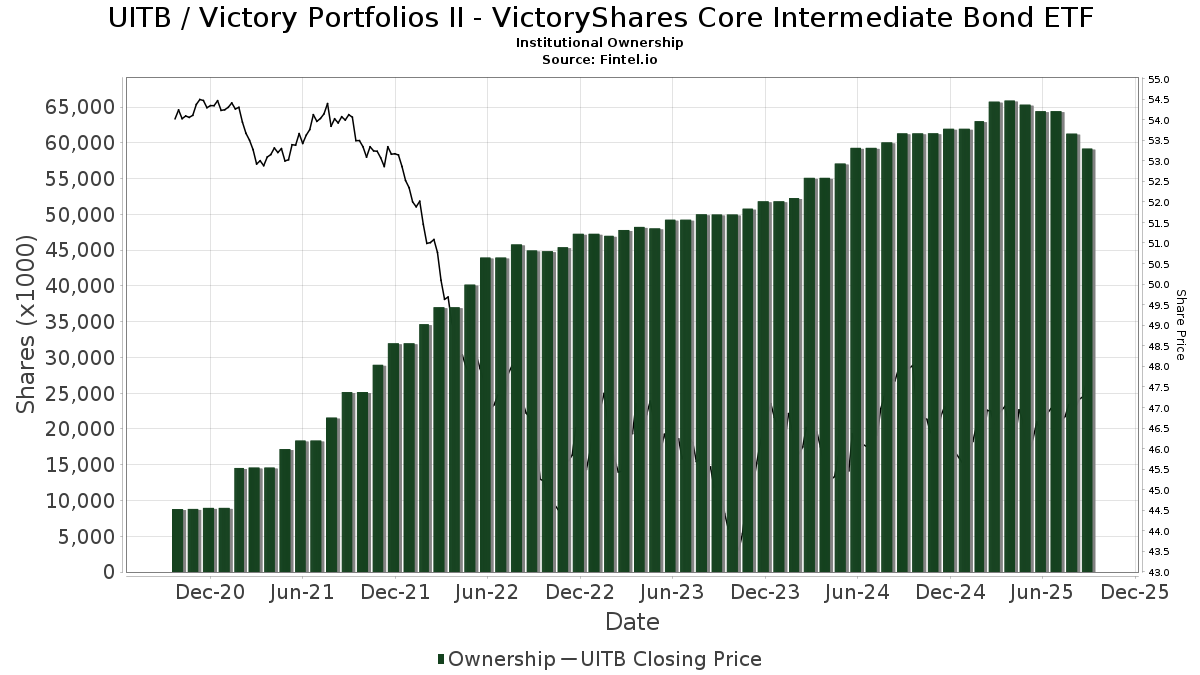
Institutionellt ägande och aktieägare
Victory Portfolios II - VictoryShares Core Intermediate Bond ETF (US:UITB) har 127 Institutionella ägare och aktieägare som har lämnat in 13D/G- eller 13F-formulär till Securities Exchange Commission (SEC). Dessa institut innehar totalt 59,206,862 aktier. Största aktieägare inkluderar Victory Capital Management Inc, USCRX - Cornerstone Moderately Aggressive Fund, Charles Schwab Investment Management Inc, USBSX - Cornerstone Moderate Fund, Morgan Stanley, United Services Automobile Association, LPL Financial LLC, Bogart Wealth, LLC, Bank Of America Corp /de/, and Raymond James Financial Inc .
Victory Portfolios II - VictoryShares Core Intermediate Bond ETF (NasdaqGM:UITB) Institutionell ägarstruktur visar institutioners och fonders nuvarande positioner i företaget, samt de senaste förändringarna i positionernas storlek. Större aktieägare kan vara enskilda investerare, fonder, hedgefonder eller institutioner. Bilaga 13D visar att investeraren äger (eller ägde) mer än 5% av företaget och avser (eller avsåg) att aktivt eftersträva en förändring av affärsstrategin. Schedule 13G indikerar en passiv investering på över 5%.
The share price as of September 15, 2025 is 47,72 / share. Previously, on September 16, 2024, the share price was 48,29 / share. This represents a decline of 1,17% over that period.
Fondsentimentets poäng
Fondsentimentet poängen(fka Ägarackumulation-poäng) visar vilka aktier som är mest köpta av fonder. Det är resultatet av en sofistikerad kvantitativ flerfaktormodell som identifierar företag med de högsta nivåerna av institutionell ackumulering. Poängsättningsmodellen använder en kombination av den totala ökningen av redovisade ägare, förändringarna i portföljallokeringarna för dessa ägare och andra mått. Siffran sträcker sig från 0 till 100, där högre siffror indikerar en högre nivå av ackumulering i förhållande till sina konkurrenter, och 50 är genomsnittet.
Uppdateringsfrekvens: Dagligen
Se Ownership Explorer, som innehåller en lista över de högst rankade företagen.
Institutionell sälj/köp-kvot
Förutom att rapportera vanliga eget kapital- och skuldemissioner måste institutioner med mer än 100MM tillgångar under förvaltning också avslöja sina innehav av sälj- och köpoptioner. Eftersom säljoptioner i allmänhet indikerar ett negativt sentiment och köpoptioner indikerar ett positivt sentiment, kan vi få en uppfattning om det övergripande institutionella sentimentet genom att plotta förhållandet mellan säljoptioner och köpoptioner. Diagrammet till höger visar det historiska förhållandet mellan sälj- och köpoptioner för detta instrument.
Genom att använda sälj/köp-kvoten som en indikator på aktieägarnas sentiment undviker man en av de största bristerna med att använda det totala institutionella ägandet, nämligen att en betydande del av de förvaltade tillgångarna investeras passivt för att följa index. Passivt förvaltade fonder köper vanligtvis inte optioner, så indikatorn för sälj/köp-kvoten ger en bättre bild av stämningen i aktivt förvaltade fonder.
13F- och NPORT-arkiveringar
Detaljer om 13F-arkiveringar är gratis. Detaljer om NP-arkiveringar kräver ett premiummedlemskap. Gröna rader indikerar nya positioner. Röda rader indikerar stängda positioner. Klicka på länk symbolen för att se hela transaktionshistoriken.
Uppgradera
för att låsa upp premiumdata och exportera till Excel ![]() .
.
| Fil Datum | Källa | Investerare | Typ | Genomsnittligt pris (beräknat) |
Aktier | Δ Aktier (%) |
Rapporterat värde (1000 USD) |
Δ Värde (%) |
Portföljallokering (%) |
|
|---|---|---|---|---|---|---|---|---|---|---|
| 2025-07-25 | NP | USCRX - Cornerstone Moderately Aggressive Fund | 8 400 445 | −20,38 | 390 539 | −21,36 | ||||
| 2025-07-31 | 13F | Insight Wealth Partners, LLC | 103 599 | 7,84 | 4 876 | 8,14 | ||||
| 2025-08-12 | 13F | Proequities, Inc. | 0 | 0 | ||||||
| 2025-08-12 | 13F | LPL Financial LLC | 1 893 921 | 20,75 | 89 147 | 21,09 | ||||
| 2025-04-15 | 13F | Redhawk Wealth Advisors, Inc. | 0 | −100,00 | 0 | |||||
| 2025-08-08 | 13F | Pnc Financial Services Group, Inc. | 0 | −100,00 | 0 | |||||
| 2025-05-01 | 13F | Riversedge Advisors, Llc | 0 | −100,00 | 0 | |||||
| 2025-08-15 | 13F | Equitable Holdings, Inc. | 10 210 | 481 | ||||||
| 2025-08-26 | 13F/A | Thrivent Financial For Lutherans | 18 330 | −50,57 | 1 | −100,00 | ||||
| 2025-07-15 | 13F | Axis Wealth Partners, LLC | 60 704 | 19,42 | 2 857 | 19,74 | ||||
| 2025-08-14 | 13F | Susquehanna International Group, Llp | 0 | −100,00 | 0 | |||||
| 2025-07-31 | 13F | Pinnacle Wealth Management Group, Inc. | 175 963 | 4,21 | 8 283 | 4,49 | ||||
| 2025-09-04 | 13F/A | Advisor Group Holdings, Inc. | 143 528 | 40,00 | 6 757 | 40,37 | ||||
| 2025-08-14 | 13F | Wiley Bros.-aintree Capital, Llc | 38 998 | 697,83 | 1 836 | 704,82 | ||||
| 2025-07-22 | 13F | MBL Wealth, LLC | 596 398 | 1,60 | 28 072 | 1,89 | ||||
| 2025-08-04 | 13F | Assetmark, Inc | 13 | 1 | ||||||
| 2025-07-17 | 13F | Alliance Wealth Advisors, LLC | 510 335 | 1,83 | 24 021 | 2,12 | ||||
| 2025-08-12 | 13F | Personal Cfo Solutions, Llc | 10 419 | −13,94 | 490 | −13,73 | ||||
| 2025-08-06 | 13F | HORAN Wealth, LLC | 348 017 | 16 381 | ||||||
| 2025-08-19 | 13F | Advisory Services Network, LLC | 16 257 | −8,41 | 761 | −8,76 | ||||
| 2025-08-14 | 13F | Royal Bank Of Canada | 171 837 | 7,05 | 8 089 | 7,35 | ||||
| 2025-08-01 | 13F | Envestnet Asset Management Inc | 57 491 | 23,78 | 2 706 | 24,13 | ||||
| 2025-07-25 | NP | UCMCX - Cornerstone Moderately Conservative Fund | 805 047 | −22,97 | 37 427 | −23,92 | ||||
| 2025-07-30 | 13F | Smith Thornton Advisors LLC | 122 753 | 1,19 | 5 778 | 1,46 | ||||
| 2025-07-18 | 13F | Newman Dignan & Sheerar, Inc. | 443 544 | 10,00 | 20 878 | 10,30 | ||||
| 2025-08-05 | 13F | Sigma Planning Corp | 17 045 | 4,61 | 802 | 4,97 | ||||
| 2025-07-31 | 13F | Cambridge Investment Research Advisors, Inc. | 131 949 | −32,40 | 6 | −33,33 | ||||
| 2025-08-06 | 13F | Horan Securities, Inc. | 19 672 | 2,60 | 926 | 2,78 | ||||
| 2025-07-14 | 13F | AdvisorNet Financial, Inc | 38 185 | −73,57 | 1 797 | −73,50 | ||||
| 2025-07-14 | 13F | Toth Financial Advisory Corp | 151 484 | 0,97 | 7 130 | 1,25 | ||||
| 2025-07-21 | 13F | Patriot Financial Group Insurance Agency, LLC | 26 620 | 11,01 | 1 253 | 11,38 | ||||
| 2025-08-11 | 13F | Private Advisor Group, LLC | 89 984 | 1,50 | 4 236 | 1,78 | ||||
| 2025-07-25 | NP | USCCX - Cornerstone Conservative Fund | 438 782 | 0,00 | 20 399 | −1,23 | ||||
| 2025-07-29 | 13F | Signature Estate & Investment Advisors Llc | 10 324 | 486 | ||||||
| 2025-08-15 | 13F | United Services Automobile Association | 2 421 191 | 0,00 | 113 965 | 0,28 | ||||
| 2025-08-08 | 13F | Larson Financial Group LLC | 258 | 30,96 | 12 | 33,33 | ||||
| 2025-08-11 | 13F | Principal Securities, Inc. | 0 | −100,00 | 0 | |||||
| 2025-08-08 | 13F | IMA Wealth, Inc. | 192 100 | 5,00 | 9 042 | 5,30 | ||||
| 2025-08-27 | 13F/A | Brinker Capital Investments, LLC | 153 563 | 1 024,59 | 7 228 | 1 029,38 | ||||
| 2025-07-01 | 13F | Harbor Investment Advisory, Llc | 528 | 0,00 | 25 | 0,00 | ||||
| 2025-08-07 | 13F | Kestra Private Wealth Services, Llc | 37 563 | −0,52 | 1 768 | −0,23 | ||||
| 2025-08-12 | 13F | J.w. Cole Advisors, Inc. | 5 034 | 237 | ||||||
| 2025-08-14 | 13F | Integrated Wealth Concepts LLC | 43 937 | 29,50 | 2 068 | 29,90 | ||||
| 2025-05-14 | 13F | Jane Street Group, Llc | 0 | −100,00 | 0 | |||||
| 2025-07-29 | 13F | Private Trust Co Na | 2 914 | 137 | ||||||
| 2025-08-12 | 13F | Gladstone Institutional Advisory LLC | 113 511 | 0,36 | 5 343 | 0,62 | ||||
| 2025-08-01 | 13F | Planning Directions Inc | 227 341 | −0,65 | 10 701 | −0,37 | ||||
| 2025-05-15 | 13F/A | Orion Portfolio Solutions, LLC | 13 655 | −99,12 | 641 | −99,10 | ||||
| 2025-08-14 | 13F | Comerica Bank | 11 391 | −0,80 | 536 | −0,56 | ||||
| 2025-08-14 | 13F | UBS Group AG | 108 368 | 7,49 | 5 101 | 7,78 | ||||
| 2025-08-04 | 13F | Pensionmark Financial Group, Llc | 14 699 | −5,40 | 692 | −5,21 | ||||
| 2025-07-15 | 13F | Fifth Third Bancorp | 4 085 | 73,09 | 192 | 74,55 | ||||
| 2025-08-13 | 13F | Flow Traders U.s. Llc | 0 | −100,00 | 0 | |||||
| 2025-07-28 | 13F | Harbour Investments, Inc. | 87 608 | −2,23 | 4 124 | −1,97 | ||||
| 2025-07-17 | 13F | Cyr Financial Inc. | 187 335 | 10,08 | 8 818 | 10,38 | ||||
| 2025-08-13 | 13F | Northwestern Mutual Wealth Management Co | 46 947 | 6,05 | 2 210 | 6,36 | ||||
| 2025-08-06 | 13F | ZEGA Investments, LLC | 9 442 | 444 | ||||||
| 2025-08-14 | 13F | Certified Advisory Corp | 4 905 | 231 | ||||||
| 2025-07-30 | 13F | Whittier Trust Co Of Nevada Inc | 350 | 0,00 | 16 | 0,00 | ||||
| 2025-07-22 | 13F | Marks Group Wealth Management, Inc | 9 379 | −12,15 | 441 | −11,98 | ||||
| 2025-05-15 | 13F | Mercer Global Advisors Inc /adv | 0 | −100,00 | 0 | |||||
| 2025-08-13 | 13F | Keystone Financial Group | 9 634 | 1,62 | 453 | 2,03 | ||||
| 2025-08-14 | 13F | Ieq Capital, Llc | 7 100 | 0,00 | 334 | 0,30 | ||||
| 2025-07-15 | 13F | Aspire Capital Advisors LLC | 9 470 | 446 | ||||||
| 2025-07-16 | 13F | Novem Group | 12 852 | 12,03 | 605 | 12,27 | ||||
| 2025-09-04 | 13F | ZynergyRetirementPlanningLLC | 0 | −100,00 | 0 | |||||
| 2025-07-16 | 13F | Perigon Wealth Management, LLC | 7 922 | 28,75 | 373 | 29,17 | ||||
| 2025-08-07 | 13F | Meeder Advisory Services, Inc. | 563 374 | 26 518 | ||||||
| 2025-05-07 | 13F | Foundations Investment Advisors, LLC | 0 | −100,00 | 0 | |||||
| 2025-08-14 | 13F | Mpwm Advisory Solutions, Llc | 3 952 | 0,00 | 186 | 0,54 | ||||
| 2025-07-30 | 13F | Princeton Global Asset Management LLC | 9 118 | −8,14 | 429 | −7,74 | ||||
| 2025-08-14 | 13F | Wells Fargo & Company/mn | 795 501 | 32,89 | 37 444 | 33,26 | ||||
| 2025-04-17 | 13F | Sound Income Strategies, LLC | 0 | −100,00 | 0 | |||||
| 2025-08-01 | 13F | Ferguson Shapiro LLC | 22 426 | −0,60 | 1 056 | −0,38 | ||||
| 2025-07-25 | NP | USBSX - Cornerstone Moderate Fund | 4 534 400 | −18,44 | 210 806 | −19,44 | ||||
| 2025-08-14 | 13F | Gotham Asset Management, LLC | 30 732 | 0,00 | 1 447 | 0,28 | ||||
| 2025-08-07 | 13F | Allworth Financial LP | 545 834 | 1,05 | 25 692 | 2,13 | ||||
| 2025-08-12 | 13F | Allen Capital Group, LLC | 862 897 | 11,20 | 40 617 | 11,51 | ||||
| 2025-07-25 | 13F | Pathway Financial Advisors LLC | 360 500 | 127,44 | 16 969 | 128,06 | ||||
| 2025-08-04 | 13F | Daymark Wealth Partners, Llc | 36 702 | −14,68 | 1 728 | −14,46 | ||||
| 2025-08-12 | 13F | Steward Partners Investment Advisory, Llc | 200 | 0,00 | 9 | 0,00 | ||||
| 2025-07-15 | 13F | Avaii Wealth Management, Llc | 10 081 | 11,59 | 475 | 11,79 | ||||
| 2025-05-15 | 13F | Tower Research Capital LLC (TRC) | 0 | −100,00 | 0 | |||||
| 2025-08-12 | 13F | CIBC Private Wealth Group, LLC | 0 | −100,00 | 0 | |||||
| 2025-07-30 | 13F | Atlantic Edge Private Wealth Management, LLC | 263 954 | 3,69 | 12 424 | 3,98 | ||||
| 2025-08-14 | 13F | Bank Of America Corp /de/ | 1 108 736 | 26,19 | 52 188 | 26,54 | ||||
| 2025-05-15 | 13F | Creative Planning | 0 | −100,00 | 0 | |||||
| 2025-05-09 | 13F | Thoroughbred Financial Services, Llc | 0 | −100,00 | 0 | |||||
| 2025-08-15 | 13F | Captrust Financial Advisors | 4 684 | 220 | ||||||
| 2025-07-30 | 13F | Brookstone Capital Management | 27 011 | −1,42 | 1 271 | −1,17 | ||||
| 2025-08-08 | 13F | Cetera Investment Advisers | 898 532 | 40,23 | 42 294 | 40,62 | ||||
| 2025-07-14 | 13F | Strategic Planning Group, Llc | 36 683 | 7,13 | 1 727 | 7,41 | ||||
| 2025-07-21 | 13F | Ameritas Advisory Services, LLC | 6 797 | 42,08 | 320 | 42,41 | ||||
| 2025-07-11 | 13F | Pinnacle Bancorp, Inc. | 3 084 | 0,00 | 145 | 0,69 | ||||
| 2025-08-12 | 13F | WealthTrak Capital Management LLC | 2 661 | 0,00 | 125 | 0,81 | ||||
| 2025-07-25 | 13F | Sovereign Financial Group, Inc. | 11 919 | 0,57 | 561 | 0,90 | ||||
| 2025-07-16 | 13F | Fortune Financial Advisors, LLC | 4 604 | −10,76 | 217 | −10,74 | ||||
| 2025-07-23 | 13F | Valmark Advisers, Inc. | 24 939 | −23,37 | 1 174 | −23,18 | ||||
| 2025-08-14 | 13F | Mml Investors Services, Llc | 51 808 | 26,91 | 2 | 100,00 | ||||
| 2025-08-04 | 13F | Creative Financial Designs Inc /adv | 315 653 | 71,51 | 14 858 | 72,00 | ||||
| 2025-08-13 | 13F | Victory Capital Management Inc | 14 727 145 | −18,51 | 693 207 | −18,28 | ||||
| 2025-08-14 | 13F | Citadel Advisors Llc | 111 472 | 5 247 | ||||||
| 2025-07-15 | 13F | James J. Burns & Company, LLC | 69 951 | −0,81 | 3 293 | −0,54 | ||||
| 2025-08-12 | 13F | Northeast Planning Associates, Inc. / Nh / | 166 626 | 5,38 | 7 843 | 5,69 | ||||
| 2025-08-12 | 13F | Charles Schwab Investment Management Inc | 5 075 676 | −9,45 | 238 912 | −9,20 | ||||
| 2025-08-11 | 13F | Aptus Capital Advisors, LLC | 128 662 | −19,86 | 6 056 | −19,63 | ||||
| 2025-07-10 | 13F | Envision Financial LLC | 149 516 | 3,98 | 7 038 | 4,27 | ||||
| 2025-08-13 | 13F | Congress Wealth Management LLC / DE / | 35 638 | 3,01 | 1 677 | 3,33 | ||||
| 2025-08-14 | 13F | Sargent Investment Group, LLC | 343 153 | 2,00 | 16 150 | 2,27 | ||||
| 2025-07-09 | 13F | Fjell Capital, LLC | 140 596 | 1,38 | 6 618 | 1,64 | ||||
| 2025-07-11 | 13F | Farther Finance Advisors, LLC | 3 586 | 169 | ||||||
| 2025-07-25 | 13F | Wealth Advisory Team LLC | 128 176 | 6 033 | ||||||
| 2025-08-06 | 13F | Commonwealth Equity Services, Llc | 53 862 | −10,16 | 3 | 0,00 | ||||
| 2025-07-10 | 13F | Focus Financial Network, Inc. | 25 742 | 1,86 | 1 212 | 2,11 | ||||
| 2025-08-06 | 13F | SOUTH STATE Corp | 688 649 | −10,77 | 32 415 | −10,52 | ||||
| 2025-08-14 | 13F | Aqr Capital Management Llc | 7 100 | 0,00 | 334 | 0,30 | ||||
| 2025-08-05 | 13F | GPS Wealth Strategies Group, LLC | 150 | −9,09 | 7 | 0,00 | ||||
| 2025-07-21 | 13F | Greenwood Capital Associates Llc | 56 956 | 124,32 | 2 681 | 125,02 | ||||
| 2025-04-16 | 13F | IAG Wealth Partners, LLC | 0 | −100,00 | 0 | |||||
| 2025-08-12 | 13F | Cornerstone Wealth Management, LLC | 16 037 | −6,65 | 755 | −6,45 | ||||
| 2025-08-13 | 13F | Nicolet Advisory Services, Llc | 346 573 | 0,43 | 16 353 | 2,85 | ||||
| 2025-07-25 | NP | UCAGX - Cornerstone Aggressive Fund | 548 471 | −20,33 | 25 499 | −21,32 | ||||
| 2025-08-04 | 13F | Bay Colony Advisory Group, Inc d/b/a Bay Colony Advisors | 4 400 | 1,15 | 207 | 1,97 | ||||
| 2025-07-14 | 13F | Chris Bulman Inc | 22 534 | 6,23 | 1 061 | 6,53 | ||||
| 2025-08-12 | 13F | Jpmorgan Chase & Co | 136 331 | 1,98 | 6 417 | 2,26 | ||||
| 2025-07-21 | 13F | Financial Services Advisory Inc | 129 130 | −8,60 | 6 078 | −8,34 | ||||
| 2025-08-15 | 13F | Morgan Stanley | 3 237 329 | 8,96 | 152 381 | 9,26 | ||||
| 2025-07-17 | 13F | Janney Montgomery Scott LLC | 33 694 | −2,39 | 2 | 0,00 | ||||
| 2025-07-30 | 13F | Klingenstein Fields & Co Lp | 38 727 | 1,05 | 1 823 | 1,28 | ||||
| 2025-08-04 | 13F | Flagship Harbor Advisors, Llc | 0 | −100,00 | 0 | |||||
| 2025-04-17 | 13F | Mission Wealth Management, Lp | 0 | −100,00 | 0 | |||||
| 2025-08-12 | 13F | BlackRock, Inc. | 28 840 | −0,09 | 1 357 | 0,15 | ||||
| 2025-08-14 | 13F | GWM Advisors LLC | 245 | 0,00 | 12 | 0,00 | ||||
| 2025-08-11 | 13F | Citigroup Inc | 19 | 1 | ||||||
| 2025-08-13 | 13F | Capital Analysts, Inc. | 1 081 | 1,03 | 0 | |||||
| 2025-08-12 | 13F | Global Retirement Partners, LLC | 4 964 | 571,72 | 234 | 606,06 | ||||
| 2025-08-14 | 13F | Betterment LLC | 5 565 | −4,33 | 0 | |||||
| 2025-07-10 | 13F | Wealth Enhancement Advisory Services, Llc | 11 956 | 12,28 | 560 | 12,22 | ||||
| 2025-08-14 | 13F | Stifel Financial Corp | 34 340 | −2,03 | 1 616 | −1,76 | ||||
| 2025-07-18 | 13F | Truist Financial Corp | 206 109 | −3,16 | 9 702 | −2,89 | ||||
| 2025-07-29 | 13F | Goldstein Advisors, LLC | 8 026 | −15,98 | 378 | −15,85 | ||||
| 2025-05-07 | 13F | Horan Capital Advisors, LLC. | 339 420 | 1,25 | 15 932 | 3,41 | ||||
| 2025-07-30 | 13F | Sloy Dahl & Holst, LLC | 99 250 | 7,72 | 4 672 | 8,02 | ||||
| 2025-07-30 | 13F | Bogart Wealth, LLC | 1 874 284 | 4,03 | 88 223 | 4,32 | ||||
| 2025-08-11 | 13F | NewEdge Wealth, LLC | 41 588 | −11,99 | 1 957 | −11,77 | ||||
| 2025-08-14 | 13F | Raymond James Financial Inc | 993 575 | 6,23 | 46 768 | 6,52 | ||||
| 2025-05-01 | 13F | Cwm, Llc | 0 | −100,00 | 0 |