Grundläggande statistik
| Institutionella ägare | 160 total, 160 long only, 0 short only, 0 long/short - change of −4,19% MRQ |
| Genomsnittlig portföljallokering | 0.5915 % - change of 9,31% MRQ |
| Institutionella aktier (lång) | 41 606 188 (ex 13D/G) - change of −6,08MM shares −12,75% MRQ |
| Institutionellt värde (lång) | $ 1 144 277 USD ($1000) |
Institutionellt ägande och aktieägare
SPDR Series Trust - SPDR Portfolio Corporate Bond ETF (US:SPBO) har 160 Institutionella ägare och aktieägare som har lämnat in 13D/G- eller 13F-formulär till Securities Exchange Commission (SEC). Dessa institut innehar totalt 41,606,188 aktier. Största aktieägare inkluderar Ameriprise Financial Inc, LPL Financial LLC, Bank Of America Corp /de/, Nepc Llc, St Germain D J Co Inc, CX Institutional, AE Wealth Management LLC, Exchange Traded Concepts, Llc, Adviser Investments LLC, and Procyon Private Wealth Partners, LLC .
SPDR Series Trust - SPDR Portfolio Corporate Bond ETF (ARCA:SPBO) Institutionell ägarstruktur visar institutioners och fonders nuvarande positioner i företaget, samt de senaste förändringarna i positionernas storlek. Större aktieägare kan vara enskilda investerare, fonder, hedgefonder eller institutioner. Bilaga 13D visar att investeraren äger (eller ägde) mer än 5% av företaget och avser (eller avsåg) att aktivt eftersträva en förändring av affärsstrategin. Schedule 13G indikerar en passiv investering på över 5%.
The share price as of September 16, 2025 is 29,78 / share. Previously, on September 17, 2024, the share price was 30,18 / share. This represents a decline of 1,33% over that period.

Fondsentimentets poäng
Fondsentimentet poängen(fka Ägarackumulation-poäng) visar vilka aktier som är mest köpta av fonder. Det är resultatet av en sofistikerad kvantitativ flerfaktormodell som identifierar företag med de högsta nivåerna av institutionell ackumulering. Poängsättningsmodellen använder en kombination av den totala ökningen av redovisade ägare, förändringarna i portföljallokeringarna för dessa ägare och andra mått. Siffran sträcker sig från 0 till 100, där högre siffror indikerar en högre nivå av ackumulering i förhållande till sina konkurrenter, och 50 är genomsnittet.
Uppdateringsfrekvens: Dagligen
Se Ownership Explorer, som innehåller en lista över de högst rankade företagen.
Institutionell sälj/köp-kvot
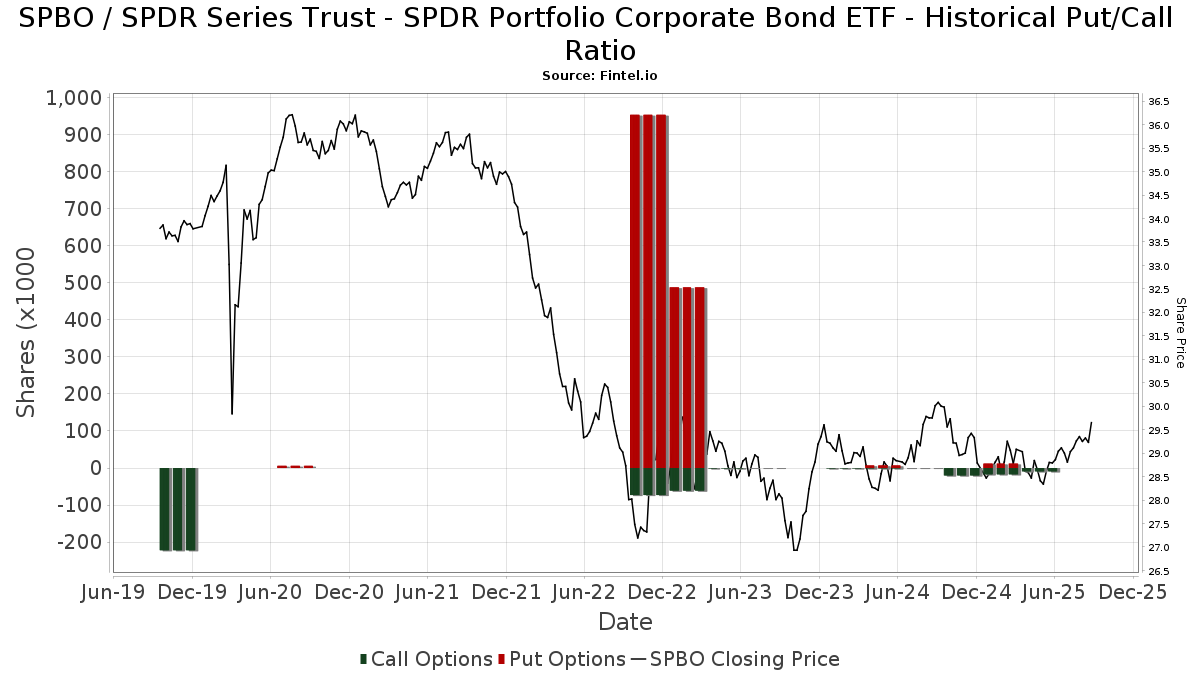
Förutom att rapportera vanliga eget kapital- och skuldemissioner måste institutioner med mer än 100MM tillgångar under förvaltning också avslöja sina innehav av sälj- och köpoptioner. Eftersom säljoptioner i allmänhet indikerar ett negativt sentiment och köpoptioner indikerar ett positivt sentiment, kan vi få en uppfattning om det övergripande institutionella sentimentet genom att plotta förhållandet mellan säljoptioner och köpoptioner. Diagrammet till höger visar det historiska förhållandet mellan sälj- och köpoptioner för detta instrument.
Genom att använda sälj/köp-kvoten som en indikator på aktieägarnas sentiment undviker man en av de största bristerna med att använda det totala institutionella ägandet, nämligen att en betydande del av de förvaltade tillgångarna investeras passivt för att följa index. Passivt förvaltade fonder köper vanligtvis inte optioner, så indikatorn för sälj/köp-kvoten ger en bättre bild av stämningen i aktivt förvaltade fonder.
13F- och NPORT-arkiveringar
Detaljer om 13F-arkiveringar är gratis. Detaljer om NP-arkiveringar kräver ett premiummedlemskap. Gröna rader indikerar nya positioner. Röda rader indikerar stängda positioner. Klicka på länk symbolen för att se hela transaktionshistoriken.
Uppgradera
för att låsa upp premiumdata och exportera till Excel ![]() .
.
| Fil Datum | Källa | Investerare | Typ | Genomsnittligt pris (beräknat) |
Aktier | Δ Aktier (%) |
Rapporterat värde (1000 USD) |
Δ Värde (%) |
Portföljallokering (%) |
|
|---|---|---|---|---|---|---|---|---|---|---|
| 2025-07-28 | 13F | RFG Advisory, LLC | 7 796 | −60,28 | 228 | −60,11 | ||||
| 2025-07-10 | 13F | Wedmont Private Capital | 7 883 | 1,31 | 229 | 4,11 | ||||
| 2025-08-11 | 13F | Synergy Investment Management, LLC | 0 | −100,00 | 0 | |||||
| 2025-08-14 | 13F | Susquehanna International Group, Llp | 0 | −100,00 | 0 | |||||
| 2025-07-09 | 13F | Procyon Private Wealth Partners, LLC | 1 349 276 | −1,90 | 39 426 | −1,26 | ||||
| 2025-08-05 | 13F | Cherry Tree Wealth Management, LLC | 788 | 0,00 | 23 | 4,55 | ||||
| 2025-04-30 | 13F | Sofos Investments, Inc. | 350 334 | 3,05 | 10 170 | 4,99 | ||||
| 2025-04-15 | 13F | Collier Financial | 2 177 | −4,39 | 63 | −3,08 | ||||
| 2025-07-22 | 13F | Iron Horse Wealth Management, LLC | 34 | 0,00 | 1 | |||||
| 2025-05-13 | 13F | Steward Partners Investment Advisory, Llc | 0 | −100,00 | 0 | |||||
| 2025-07-09 | 13F | Sterling Manor Financial, LLC | 538 925 | 5,32 | 15 747 | 6,01 | ||||
| 2025-07-16 | 13F | St Germain D J Co Inc | 2 300 466 | −0,91 | 67 220 | −0,26 | ||||
| 2025-08-01 | 13F | Cobblestone Capital Advisors Llc /ny/ | 61 250 | 9,59 | 1 790 | 10,30 | ||||
| 2025-07-18 | 13F | Truist Financial Corp | 6 895 | 201 | ||||||
| 2025-08-14 | 13F | Stifel Financial Corp | 14 668 | −1,25 | 429 | −0,70 | ||||
| 2025-07-24 | 13F | Rice Partnership, LLC | 13 356 | 0,00 | 390 | 0,78 | ||||
| 2025-08-18 | 13F | Front Row Advisors LLC | 2 335 | 0,00 | 68 | 1,49 | ||||
| 2025-07-09 | 13F | Breakwater Investment Management | 12 153 | −6,85 | 355 | −6,08 | ||||
| 2025-08-13 | 13F | Virtus Fixed Income Advisers, LLC | 212 | 6 | ||||||
| 2025-08-01 | 13F | Biltmore Family Office, LLC | 662 | 0,00 | 19 | 0,00 | ||||
| 2025-08-12 | 13F | Jpmorgan Chase & Co | 112 647 | −1,17 | 3 292 | −0,51 | ||||
| 2025-08-14 | 13F | Prestige Wealth Management Group LLC | 7 308 | −57,53 | 214 | −57,31 | ||||
| 2025-08-29 | NP | AIIFX - Timber Point Alternative Income Fund Institutional Class Shares | 60 000 | 0,00 | 1 753 | 0,69 | ||||
| 2025-07-21 | 13F | Ameritas Advisory Services, LLC | 53 652 | 5,46 | 1 568 | 6,17 | ||||
| 2025-07-08 | 13F | Melone Private Wealth, LLC | 179 257 | 0,96 | 5 215 | 1,16 | ||||
| 2025-08-14 | 13F | Transamerica Financial Advisors, Inc. | 55 478 | −1,76 | 1 621 | 162 000,00 | ||||
| 2025-08-01 | 13F | Rossby Financial, LCC | 594 | 0,00 | 17 | 0,00 | ||||
| 2025-08-07 | 13F | Allworth Financial LP | 3 510 | 103 | ||||||
| 2025-07-23 | 13F | Detalus Advisors, LLC | 13 159 | −7,86 | 385 | −7,25 | ||||
| 2025-08-14 | 13F | Tennessee Valley Asset Management Partners | 0 | −100,00 | 0 | |||||
| 2025-07-23 | 13F | Optas, LLC | 57 002 | −5,29 | 1 666 | −4,69 | ||||
| 2025-08-14 | 13F | Fairview Capital Investment Management, Llc | 7 850 | −11,05 | 229 | −10,55 | ||||
| 2025-07-28 | 13F | Harbour Investments, Inc. | 2 700 | 0,00 | 79 | 0,00 | ||||
| 2025-08-11 | 13F | Rothschild Investment Llc | 530 | 15 | ||||||
| 2025-08-12 | 13F | Financial Advocates Investment Management | 98 885 | 0,30 | 2 889 | 0,94 | ||||
| 2025-08-08 | 13F | Avantax Advisory Services, Inc. | 68 615 | −2,09 | 2 005 | −1,47 | ||||
| 2025-08-08 | 13F | Foundations Investment Advisors, LLC | 109 347 | 83,81 | 3 195 | 85,11 | ||||
| 2025-08-26 | 13F/A | Thrivent Financial For Lutherans | 0 | −100,00 | 0 | −100,00 | ||||
| 2025-08-04 | 13F | Flagship Harbor Advisors, Llc | 339 046 | 29,26 | 9 907 | 30,10 | ||||
| 2025-08-14 | 13F | Old Mission Capital Llc | 112 499 | 58,46 | 3 287 | 59,49 | ||||
| 2025-07-15 | 13F | Sheets Smith Wealth Management | 0 | −100,00 | 0 | |||||
| 2025-07-15 | 13F | Elevated Capital Advisors, LLC | 54 287 | 0,00 | 1 576 | 0,00 | ||||
| 2025-05-12 | 13F | Americana Partners, LLC | 0 | −100,00 | 0 | |||||
| 2025-08-14 | 13F | Financial Engines Advisors L.L.C. | 483 093 | 1,22 | 14 116 | 1,88 | ||||
| 2025-07-29 | 13F | Birmingham Capital Management Co Inc/al | 147 500 | −21,54 | 4 310 | −21,04 | ||||
| 2025-07-23 | 13F | Woodside Wealth Management LLC | 5 483 | 0,00 | 160 | 0,63 | ||||
| 2025-07-23 | 13F | Next Level Wealth Planning, LLC | 9 119 | 1,00 | 266 | 1,53 | ||||
| 2025-08-14 | 13F | Mariner, LLC | 248 083 | 3,41 | 7 249 | 4,09 | ||||
| 2025-07-17 | 13F | David Kennon Inc | 58 467 | −1,56 | 1 708 | −0,93 | ||||
| 2025-09-04 | 13F/A | Advisor Group Holdings, Inc. | 183 416 | 160,25 | 5 345 | 161,32 | ||||
| 2025-08-12 | 13F | Wayfinding Financial, LLC | 0 | −100,00 | 0 | |||||
| 2025-08-14 | 13F | Aqr Capital Management Llc | 30 398 | 888 | ||||||
| 2025-08-14 | 13F | Ameriprise Financial Inc | 6 350 351 | −3,08 | 185 561 | −2,45 | ||||
| 2025-07-09 | 13F | Breakwater Capital Group | 125 290 | −12,51 | 3 661 | −11,96 | ||||
| 2025-07-15 | 13F | Fifth Third Bancorp | 152 | −86,27 | 4 | −87,50 | ||||
| 2025-08-14 | 13F | Marshall Investment Management, Llc | 0 | −100,00 | 0 | |||||
| 2025-08-11 | 13F | Aptus Capital Advisors, LLC | 1 839 | 7,48 | 54 | 8,16 | ||||
| 2025-05-12 | 13F | Independent Advisor Alliance | 0 | −100,00 | 0 | |||||
| 2025-08-12 | 13F | CIBC Private Wealth Group, LLC | 0 | −100,00 | 0 | |||||
| 2025-05-15 | 13F | Hrt Financial Lp | 0 | −100,00 | 0 | |||||
| 2025-08-06 | 13F | Legacy Investment Solutions, LLC | 20 | 0,00 | 1 | |||||
| 2025-08-12 | 13F | XTX Topco Ltd | 0 | −100,00 | 0 | |||||
| 2025-08-14 | 13F | Great Valley Advisor Group, Inc. | 7 689 | −48,61 | 224 | −48,39 | ||||
| 2025-07-11 | 13F | Farther Finance Advisors, LLC | 5 581 | −68,38 | 163 | −68,10 | ||||
| 2025-08-13 | 13F | Level Four Advisory Services, Llc | 31 275 | 16,18 | 914 | 16,90 | ||||
| 2025-08-13 | 13F | Flow Traders U.s. Llc | 0 | −100,00 | 0 | |||||
| 2025-08-15 | 13F | First Heartland Consultants, Inc. | 7 159 | −15,07 | 209 | −14,34 | ||||
| 2025-07-28 | 13F | Arlington Financial Advisors, LLC | 8 264 | 0,00 | 241 | 0,84 | ||||
| 2025-07-22 | 13F | Miracle Mile Advisors, LLC | 0 | −100,00 | 0 | |||||
| 2025-08-06 | 13F | Decker Retirement Planning Inc. | 2 047 | 0,00 | 60 | 0,00 | ||||
| 2025-07-08 | 13F | Parallel Advisors, LLC | 9 506 | −3,84 | 278 | −3,15 | ||||
| 2025-07-15 | 13F | FLP Wealth Management, LLC | 0 | −100,00 | 0 | |||||
| 2025-08-12 | 13F | Advisors Asset Management, Inc. | 0 | −100,00 | 0 | |||||
| 2025-04-29 | 13F | Resources Investment Advisors, LLC. | 0 | −100,00 | 0 | |||||
| 2025-08-14 | 13F | Citadel Advisors Llc | Put | 0 | −100,00 | 0 | ||||
| 2025-08-14 | 13F | Citadel Advisors Llc | 0 | −100,00 | 0 | |||||
| 2025-08-27 | NP | HCXSX - The U.S. Corporate Fixed Income Securities Portfolio HC Strategic Shares | 312 290 | 9 125 | ||||||
| 2025-07-17 | 13F | Keystone Global Partners, LLC | 0 | −100,00 | 0 | |||||
| 2025-07-17 | 13F | KWB Wealth | 0 | −100,00 | 0 | |||||
| 2025-08-08 | 13F | Good Life Advisors, LLC | 664 234 | 11,57 | 19 409 | 12,30 | ||||
| 2025-08-11 | 13F | Private Advisor Group, LLC | 139 377 | −29,27 | 4 073 | −28,81 | ||||
| 2025-08-12 | 13F | Jefferies Financial Group Inc. | 159 815 | −20,13 | 4 670 | −19,61 | ||||
| 2025-08-12 | 13F | AlphaCore Capital LLC | 138 | 0,00 | 4 | 0,00 | ||||
| 2025-08-05 | 13F | Bank Of Montreal /can/ | 7 333 | 30,69 | 214 | 32,10 | ||||
| 2025-04-21 | 13F | Nelson, Van Denburg & Campbell Wealth Management Group, LLC | 0 | −100,00 | 0 | |||||
| 2025-08-04 | 13F | Pensionmark Financial Group, Llc | 40 005 | −9,60 | 1 169 | −9,03 | ||||
| 2025-08-14 | 13F | GWM Advisors LLC | 21 069 | −3,33 | 616 | −2,69 | ||||
| 2025-07-09 | 13F | Keystone Wealth Services, LLC | 34 085 | −11,74 | 996 | −11,24 | ||||
| 2025-08-18 | 13F | Geneos Wealth Management Inc. | 904 105 | 118,21 | 26 418 | 119,65 | ||||
| 2025-08-08 | 13F | Capital Investment Advisory Services, LLC | 327 | 2,51 | 10 | 0,00 | ||||
| 2025-08-11 | 13F | Invenio Wealth Partners Llc | 21 377 | 0,00 | 625 | 0,65 | ||||
| 2025-07-22 | 13F | Merit Financial Group, LLC | 23 166 | −6,34 | 677 | −5,85 | ||||
| 2025-07-23 | 13F | Center For Asset Management LLC | 19 378 | −46,41 | 556 | −47,09 | ||||
| 2025-08-12 | 13F | Zacks Investment Management | 88 024 | −47,52 | 2 572 | −47,18 | ||||
| 2025-05-14 | 13F | Summit Financial Wealth Advisors, LLC | 733 807 | 59,54 | 21 302 | 61,38 | ||||
| 2025-07-21 | 13F | Ascent Group, LLC | 12 219 | −28,84 | 357 | −28,31 | ||||
| 2025-07-17 | 13F | Halbert Hargrove Global Advisors, Llc | 3 | 0,00 | 0 | |||||
| 2025-05-05 | 13F | IFP Advisors, Inc | 0 | −100,00 | 0 | |||||
| 2025-07-24 | 13F | Us Bancorp \de\ | 842 | −37,58 | 25 | −38,46 | ||||
| 2025-04-23 | 13F | Continuum Advisory, LLC | 0 | −100,00 | 0 | |||||
| 2025-08-18 | 13F | N.E.W. Advisory Services LLC | 356 | 0,00 | 10 | 0,00 | ||||
| 2025-07-29 | 13F | ShoreHaven Wealth Partners, LLC | 45 694 | 2,04 | 1 335 | 2,69 | ||||
| 2025-08-11 | 13F | Citigroup Inc | 12 211 | −39,29 | 357 | −38,94 | ||||
| 2025-07-23 | 13F | Valmark Advisers, Inc. | 208 156 | 70,41 | 6 082 | 71,57 | ||||
| 2025-08-06 | 13F | Commonwealth Equity Services, Llc | 60 928 | 17,19 | 2 | 0,00 | ||||
| 2025-05-01 | 13F | Quest 10 Wealth Builders, Inc. | 170 | 254,17 | 5 | 300,00 | ||||
| 2025-05-15 | 13F | National Wealth Management Group, LLC | 25 907 | 26,17 | 752 | 27,89 | ||||
| 2025-08-14 | 13F | IHT Wealth Management, LLC | 106 160 | 8,74 | 3 102 | 9,46 | ||||
| 2025-08-05 | 13F | Prosperity Wealth Management, Inc. | 16 780 | 490 | ||||||
| 2025-08-13 | 13F | Northwestern Mutual Wealth Management Co | 483 | 28,80 | 14 | 40,00 | ||||
| 2025-07-25 | 13F | Richardson Financial Services Inc. | 974 | −16,03 | 28 | −15,15 | ||||
| 2025-08-14 | 13F | Enstar Group LTD | 276 400 | 0,00 | 8 076 | 0,66 | ||||
| 2025-07-29 | 13F | Tradewinds Capital Management, LLC | 77 755 | 17,82 | 2 272 | 18,64 | ||||
| 2025-08-14 | 13F | Nepc Llc | 2 554 840 | −18,75 | 74 652 | −18,22 | ||||
| 2025-08-12 | 13F | Eldridge Investment Advisors, Inc. | 0 | −100,00 | 0 | |||||
| 2025-08-11 | 13F | Kingdom Financial Group LLC. | 17 693 | 517 | ||||||
| 2025-06-26 | NP | SSFI - Day Hagan/Ned Davis Research Smart Sector Fixed Income ETF | 218 406 | −9,05 | 6 299 | −8,90 | ||||
| 2025-08-14 | 13F | Citadel Advisors Llc | Call | 9 100 | −47,09 | 266 | −46,89 | |||
| 2025-08-01 | 13F | Envestnet Asset Management Inc | 67 542 | 8,34 | 1 974 | 9,07 | ||||
| 2025-07-23 | 13F | Laraway Financial Inc | 19 858 | −0,94 | 580 | −0,17 | ||||
| 2025-08-12 | 13F | O'shaughnessy Asset Management, Llc | 113 438 | 63,30 | 3 315 | 64,38 | ||||
| 2025-07-31 | 13F | Glass Jacobson Investment Advisors llc | 0 | −100,00 | 0 | |||||
| 2025-08-13 | 13F | Sanibel Captiva Trust Company, Inc. | 30 000 | 0,00 | 877 | 0,69 | ||||
| 2025-08-14 | 13F | Federation des caisses Desjardins du Quebec | 300 | −86,36 | 9 | −87,30 | ||||
| 2025-08-27 | NP | HCIIX - The Core Fixed Income Portfolio HC Strategic Shares | 178 845 | 5 226 | ||||||
| 2025-08-06 | 13F | Legacy Wealth Managment, LLC/ID | 20 | 0,00 | 1 | |||||
| 2025-08-06 | 13F | Quadrant Private Wealth Management, LLC | 36 656 | −14,28 | 1 071 | −13,70 | ||||
| 2025-08-04 | 13F | Spire Wealth Management | 167 | −35,27 | 5 | −42,86 | ||||
| 2025-07-29 | 13F | Aire Advisors, Llc | 9 841 | 0,35 | 288 | 1,06 | ||||
| 2025-07-09 | 13F | Alesco Advisors Llc | 36 645 | 108,39 | 1 071 | 109,80 | ||||
| 2025-07-16 | 13F | Arkansas Financial Group, Inc. | 551 268 | 8,59 | 15 910 | 11,21 | ||||
| 2025-08-14 | 13F | Betterment LLC | 8 387 | 0 | ||||||
| 2025-07-25 | 13F | Cwm, Llc | 294 861 | 8,79 | 9 | 14,29 | ||||
| 2025-08-11 | 13F | Principal Securities, Inc. | 8 744 | −16,25 | 256 | −14,72 | ||||
| 2025-07-18 | 13F/A | MJT & Associates Financial Advisory Group, Inc. | 16 327 | 0,00 | 477 | 0,85 | ||||
| 2025-08-11 | 13F | Tidemark, LLC | 127 541 | 3,47 | 3 727 | 4,14 | ||||
| 2025-08-14 | 13F | UBS Group AG | 7 200 | 2,86 | 210 | 3,45 | ||||
| 2025-08-08 | 13F | Advyzon Investment Management, LLC | 12 430 | 363 | ||||||
| 2025-08-14 | 13F | Financial Advisory Service, Inc. | 247 | 1,23 | 7 | 0,00 | ||||
| 2025-04-16 | 13F | Private Wealth Group, LLC | 0 | −100,00 | 0 | |||||
| 2025-08-06 | 13F | AE Wealth Management LLC | 1 604 981 | 5,36 | 46 898 | 6,04 | ||||
| 2025-08-12 | 13F | Proequities, Inc. | 0 | 0 | ||||||
| 2025-08-14 | 13F | Graney & King, LLC | 356 | 1,14 | 10 | 0,00 | ||||
| 2025-07-31 | 13F | Kathleen S. Wright Associates Inc. | 44 786 | −3,20 | 1 309 | −2,61 | ||||
| 2025-08-14 | 13F | CoreCap Advisors, LLC | 12 568 | −98,70 | 367 | −98,69 | ||||
| 2025-09-09 | 13F | NWF Advisory Services Inc. | 13 794 | 403 | ||||||
| 2025-08-11 | 13F | Advisor Resource Council | 12 101 | −97,61 | 354 | −97,54 | ||||
| 2025-08-12 | 13F | Jacobi Capital Management LLC | 140 899 | 15,71 | 4 117 | 16,50 | ||||
| 2025-08-11 | 13F | Perennial Investment Advisors, LLC | 7 921 | −5,29 | 231 | −4,55 | ||||
| 2025-08-08 | 13F | Cetera Investment Advisers | 43 136 | 16,14 | 1 260 | 16,88 | ||||
| 2025-08-08 | 13F | Creative Planning | 16 712 | 63,62 | 488 | 64,86 | ||||
| 2025-08-11 | 13F | Mach-1 Financial Group, Inc. | 0 | −100,00 | 0 | |||||
| 2025-08-14 | 13F | Gerber Kawasaki Wealth & Investment Management | 1 340 903 | 1,08 | 39 181 | 1,74 | ||||
| 2025-07-10 | 13F | Sovran Advisors, LLC | 10 043 | 290 | ||||||
| 2025-08-12 | 13F | LPL Financial LLC | 2 778 680 | −8,00 | 81 193 | −7,40 | ||||
| 2025-05-09 | 13F | Atria Wealth Solutions, Inc. | 0 | −100,00 | 0 | |||||
| 2025-04-07 | 13F | GoalVest Advisory LLC | 0 | −100,00 | 0 | |||||
| 2025-07-28 | 13F | 5th Street Advisors, LLC | 149 109 | −6,68 | 4 357 | −6,08 | ||||
| 2025-08-12 | 13F | MAI Capital Management | 2 951 | −6,35 | 86 | −5,49 | ||||
| 2025-08-15 | 13F | CI Private Wealth, LLC | 63 644 | 100,00 | 1 860 | 101,41 | ||||
| 2025-07-31 | 13F | Buckingham Strategic Partners | 9 537 | 0,00 | 279 | 0,72 | ||||
| 2025-08-06 | 13F | Savant Capital, LLC | 48 256 | −19,52 | 1 410 | −18,97 | ||||
| 2025-08-04 | 13F | Assetmark, Inc | 1 335 023 | 1,37 | 39 009 | 2,04 | ||||
| 2025-08-14 | 13F | Bank Of America Corp /de/ | 2 702 160 | 2,72 | 78 957 | 3,39 | ||||
| 2025-04-29 | 13F | Financial Counselors Inc | 0 | −100,00 | 0 | |||||
| 2025-08-12 | 13F | Global Retirement Partners, LLC | 2 173 | −38,28 | 63 | −37,00 | ||||
| 2025-07-09 | 13F | Tounjian Advisory Partners, Llc | 82 740 | −0,42 | 2 402 | −0,46 | ||||
| 2025-08-08 | 13F | Pnc Financial Services Group, Inc. | 3 113 | −4,89 | 91 | −5,26 | ||||
| 2025-05-14 | 13F | Bnp Paribas Arbitrage, Sa | 0 | −100,00 | 0 | |||||
| 2025-07-14 | 13F | Golden State Equity Partners | 0 | −100,00 | 0 | |||||
| 2025-07-18 | 13F | Donald L. Hagan, LLC | 21 503 | −17,36 | 628 | −16,82 | ||||
| 2025-08-06 | 13F | Adviser Investments LLC | 1 399 638 | −81,59 | 40 897 | −81,47 | ||||
| 2025-07-28 | 13F | Ritholtz Wealth Management | 78 141 | 91,06 | 2 283 | 92,33 | ||||
| 2025-05-28 | 13F | Wealth Management Associates, Inc. | 0 | −100,00 | 0 | −100,00 | ||||
| 2025-08-14 | 13F | Comerica Bank | 4 985 | −6,74 | 146 | −6,45 | ||||
| 2025-08-05 | 13F | Transatlantique Private Wealth Llc | 62 560 | 2,90 | 1 828 | 3,63 | ||||
| 2025-08-08 | 13F | Financial Gravity Companies, Inc. | 374 959 | 14,87 | 10 956 | 17,20 | ||||
| 2025-08-14 | 13F | Royal Bank Of Canada | 252 106 | −2,88 | 7 367 | −2,23 | ||||
| 2025-08-15 | 13F | Morgan Stanley | 1 131 824 | 88,63 | 33 072 | 89,87 | ||||
| 2025-05-16 | 13F | Coppell Advisory Solutions LLC | 0 | −100,00 | 0 | |||||
| 2025-08-14 | 13F | Mml Investors Services, Llc | 372 636 | −0,67 | 11 | 0,00 | ||||
| 2025-07-10 | 13F | Exchange Traded Concepts, Llc | 1 494 916 | 43 681 | ||||||
| 2025-08-08 | 13F | Flaharty Asset Management, LLC | 680 216 | 1,71 | 19 876 | 2,37 | ||||
| 2025-05-05 | 13F | Diversify Advisory Services, LLC | 0 | −100,00 | 0 | |||||
| 2025-08-14 | 13F | Fmr Llc | 413 | −91,35 | 12 | −91,30 | ||||
| 2025-08-14 | 13F | Raymond James Financial Inc | 26 562 | −22,69 | 776 | −22,17 | ||||
| 2025-08-14 | 13F/A | Rockefeller Capital Management L.P. | 12 995 | 0,00 | 380 | 0,53 | ||||
| 2025-07-21 | 13F | Ameriflex Group, Inc. | 0 | −100,00 | 0 | |||||
| 2025-08-13 | 13F | Congress Wealth Management LLC / DE / | 1 179 900 | 3,42 | 34 477 | 4,10 | ||||
| 2025-08-14 | 13F | Wells Fargo & Company/mn | 255 152 | 3,59 | 7 456 | 4,27 | ||||
| 2025-07-31 | 13F | Cambridge Investment Research Advisors, Inc. | 8 103 | −43,04 | 0 | |||||
| 2025-08-14 | 13F | Atomi Financial Group, Inc. | 26 338 | 19,70 | 770 | 20,53 | ||||
| 2025-05-14 | 13F | Jane Street Group, Llc | 0 | −100,00 | 0 | |||||
| 2025-05-02 | 13F | Capital A Wealth Management, LLC | 45 | 0,00 | 1 | 0,00 | ||||
| 2025-07-16 | 13F/A | CX Institutional | 1 678 522 | 0,32 | 49 | 2,08 | ||||
| 2025-07-29 | 13F | Private Trust Co Na | 8 950 | −27,45 | 262 | −27,09 | ||||
| 2025-08-13 | 13F | Capital Analysts, Inc. | 2 317 | −11,90 | 0 | |||||
| 2025-08-12 | 13F | Change Path, LLC | 26 765 | −23,36 | 782 | −22,80 | ||||
| 2025-08-04 | 13F | Creative Financial Designs Inc /adv | 2 934 | 17,27 | 86 | 18,06 | ||||
| 2025-08-15 | 13F | Strategic Investment Advisors / MI | 32 990 | −4,89 | 962 | −4,37 |