Grundläggande statistik
| Institutionella ägare | 224 total, 224 long only, 0 short only, 0 long/short - change of 3,21% MRQ |
| Genomsnittlig portföljallokering | 0.1989 % - change of −16,87% MRQ |
| Institutionella aktier (lång) | 18 765 827 (ex 13D/G) - change of 1,20MM shares 6,85% MRQ |
| Institutionellt värde (lång) | $ 798 553 USD ($1000) |
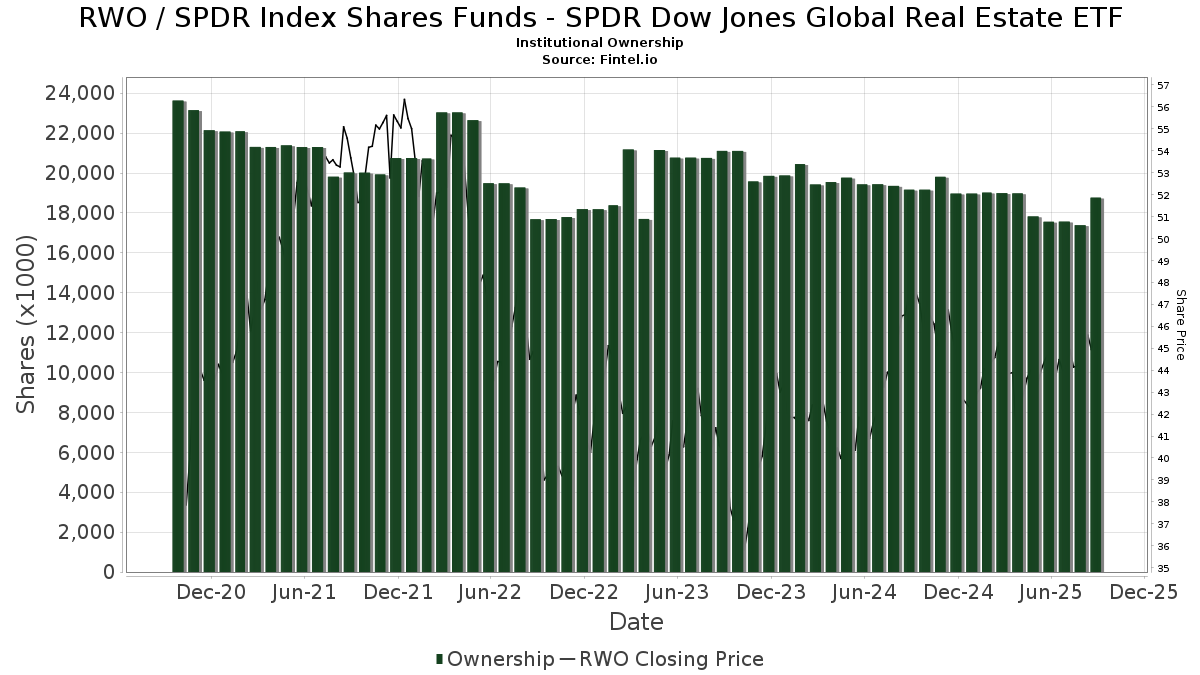
Institutionellt ägande och aktieägare
SPDR Index Shares Funds - SPDR Dow Jones Global Real Estate ETF (US:RWO) har 224 Institutionella ägare och aktieägare som har lämnat in 13D/G- eller 13F-formulär till Securities Exchange Commission (SEC). Dessa institut innehar totalt 18,765,827 aktier. Största aktieägare inkluderar State Street Corp, SSBRX - State Street Target Retirement 2025 Fund Class I, SSBWX - State Street Target Retirement 2030 Fund Class I, SSFNX - State Street Target Retirement Fund Class I, Bank Of America Corp /de/, Bank of New York Mellon Corp, SSBNX - State Street Target Retirement 2020 Fund Class I, Glenmede Trust Co Na, Glenmede Investment Management, LP, and Goldman Sachs Group Inc .
SPDR Index Shares Funds - SPDR Dow Jones Global Real Estate ETF (ARCA:RWO) Institutionell ägarstruktur visar institutioners och fonders nuvarande positioner i företaget, samt de senaste förändringarna i positionernas storlek. Större aktieägare kan vara enskilda investerare, fonder, hedgefonder eller institutioner. Bilaga 13D visar att investeraren äger (eller ägde) mer än 5% av företaget och avser (eller avsåg) att aktivt eftersträva en förändring av affärsstrategin. Schedule 13G indikerar en passiv investering på över 5%.
The share price as of September 17, 2025 is 45,77 / share. Previously, on September 18, 2024, the share price was 47,85 / share. This represents a decline of 4,35% over that period.
Fondsentimentets poäng
Fondsentimentet poängen(fka Ägarackumulation-poäng) visar vilka aktier som är mest köpta av fonder. Det är resultatet av en sofistikerad kvantitativ flerfaktormodell som identifierar företag med de högsta nivåerna av institutionell ackumulering. Poängsättningsmodellen använder en kombination av den totala ökningen av redovisade ägare, förändringarna i portföljallokeringarna för dessa ägare och andra mått. Siffran sträcker sig från 0 till 100, där högre siffror indikerar en högre nivå av ackumulering i förhållande till sina konkurrenter, och 50 är genomsnittet.
Uppdateringsfrekvens: Dagligen
Se Ownership Explorer, som innehåller en lista över de högst rankade företagen.
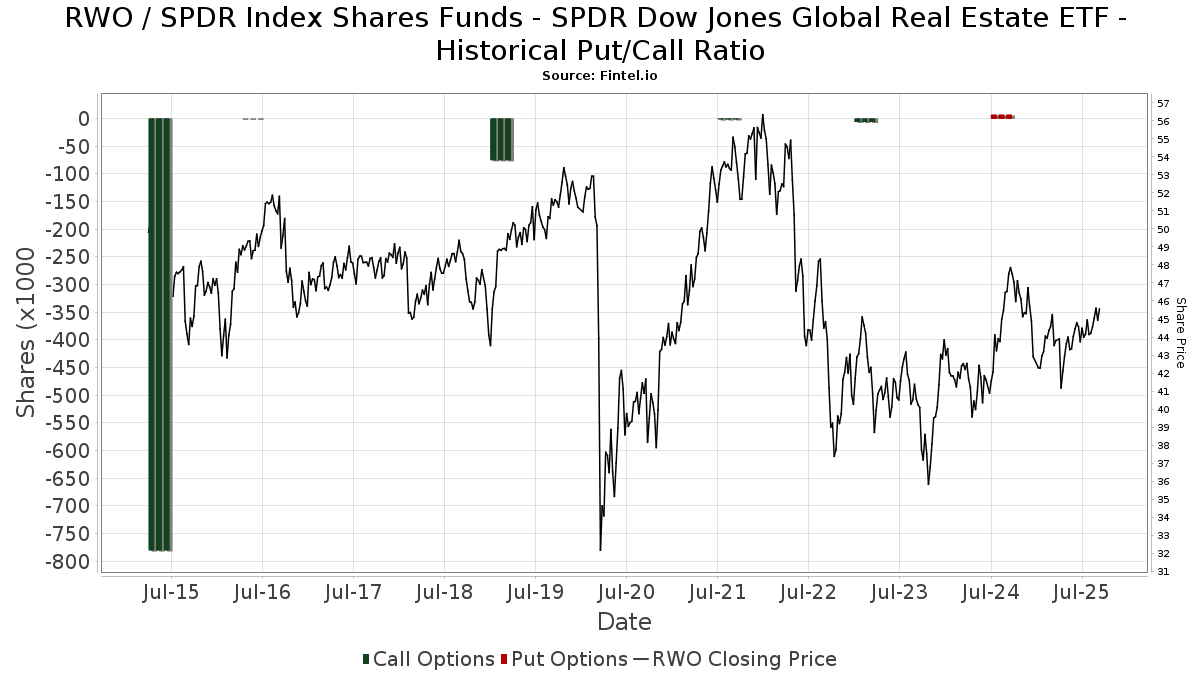
Institutionell sälj/köp-kvot
Förutom att rapportera vanliga eget kapital- och skuldemissioner måste institutioner med mer än 100MM tillgångar under förvaltning också avslöja sina innehav av sälj- och köpoptioner. Eftersom säljoptioner i allmänhet indikerar ett negativt sentiment och köpoptioner indikerar ett positivt sentiment, kan vi få en uppfattning om det övergripande institutionella sentimentet genom att plotta förhållandet mellan säljoptioner och köpoptioner. Diagrammet till höger visar det historiska förhållandet mellan sälj- och köpoptioner för detta instrument.
Genom att använda sälj/köp-kvoten som en indikator på aktieägarnas sentiment undviker man en av de största bristerna med att använda det totala institutionella ägandet, nämligen att en betydande del av de förvaltade tillgångarna investeras passivt för att följa index. Passivt förvaltade fonder köper vanligtvis inte optioner, så indikatorn för sälj/köp-kvoten ger en bättre bild av stämningen i aktivt förvaltade fonder.
13F- och NPORT-arkiveringar
Detaljer om 13F-arkiveringar är gratis. Detaljer om NP-arkiveringar kräver ett premiummedlemskap. Gröna rader indikerar nya positioner. Röda rader indikerar stängda positioner. Klicka på länk symbolen för att se hela transaktionshistoriken.
Uppgradera
för att låsa upp premiumdata och exportera till Excel ![]() .
.
| Fil Datum | Källa | Investerare | Typ | Genomsnittligt pris (beräknat) |
Aktier | Δ Aktier (%) |
Rapporterat värde (1000 USD) |
Δ Värde (%) |
Portföljallokering (%) |
|
|---|---|---|---|---|---|---|---|---|---|---|
| 2025-08-08 | 13F | Avantax Advisory Services, Inc. | 24 956 | 1,06 | 1 102 | 2,23 | ||||
| 2025-08-18 | 13F | Front Row Advisors LLC | 63 | −38,83 | 3 | −50,00 | ||||
| 2025-08-07 | 13F | Allworth Financial LP | 473 | 75,19 | 21 | 81,82 | ||||
| 2025-08-14 | 13F | Mpwm Advisory Solutions, Llc | 191 | −7,28 | 8 | 0,00 | ||||
| 2025-07-21 | 13F | Crews Bank & Trust | 31 | 1 | ||||||
| 2025-05-01 | 13F | Quest 10 Wealth Builders, Inc. | 0 | −100,00 | 0 | |||||
| 2025-08-14 | 13F | Boston Private Wealth Llc | 7 092 | −36,40 | 313 | −35,60 | ||||
| 2025-08-06 | 13F | Longview Financial Advisors LLC | 207 | 0,00 | 9 | 0,00 | ||||
| 2025-07-28 | 13F | Harbour Investments, Inc. | 7 249 | 4,98 | 320 | 5,98 | ||||
| 2025-08-11 | 13F | Banque Cantonale Vaudoise | 48 668 | 6,29 | 2 | 100,00 | ||||
| 2025-08-15 | 13F | Tower Research Capital LLC (TRC) | 8 | −33,33 | 0 | |||||
| 2025-08-06 | 13F | AE Wealth Management LLC | 5 653 | −13,50 | 250 | −12,63 | ||||
| 2025-07-22 | 13F | Aquire Wealth Advisors, LLC | 10 718 | −0,50 | 473 | 0,64 | ||||
| 2025-07-22 | 13F | Iron Horse Wealth Management, LLC | 106 | 0,00 | 5 | 0,00 | ||||
| 2025-07-22 | 13F | White & Co Financial Planning Inc | 117 574 | 1,33 | 5 178 | 2,94 | ||||
| 2025-07-18 | 13F | Consolidated Portfolio Review Corp | 6 257 | −5,98 | 276 | −4,83 | ||||
| 2025-07-18 | 13F | Truist Financial Corp | 12 833 | 0,46 | 566 | 1,62 | ||||
| 2025-07-17 | 13F | Moss Adams Wealth Advisors LLC | 59 583 | −20,49 | 2 630 | −19,60 | ||||
| 2025-08-06 | 13F | Golden State Wealth Management, LLC | 87 | 0,00 | 4 | 0,00 | ||||
| 2025-08-11 | 13F | GW&K Investment Management, LLC | 3 805 | 0,00 | 0 | |||||
| 2025-07-16 | 13F | Signaturefd, Llc | 48 | 0,00 | 2 | 0,00 | ||||
| 2025-08-05 | 13F | Cherry Tree Wealth Management, LLC | 106 | 0,00 | 5 | 0,00 | ||||
| 2025-08-12 | 13F | Steward Partners Investment Advisory, Llc | 291 | 0,34 | 13 | 0,00 | ||||
| 2025-07-08 | 13F | Boltwood Capital Management | 24 340 | 16,93 | 1 074 | 18,28 | ||||
| 2025-08-15 | 13F | Fsb Premier Wealth Management, Inc. | 14 270 | 0,01 | 630 | 1,13 | ||||
| 2025-08-13 | 13F | Flow Traders U.s. Llc | 142 137 | 14,40 | 6 | 20,00 | ||||
| 2025-07-28 | 13F | RFG Advisory, LLC | 20 398 | −1,34 | 900 | −0,22 | ||||
| 2025-08-05 | 13F | Scarborough Advisors, LLC | 128 | 6 | ||||||
| 2025-08-11 | 13F | Strategic Wealth Partners, Ltd. | 156 | 7 | ||||||
| 2025-08-05 | 13F | GPS Wealth Strategies Group, LLC | 480 | 0,63 | 21 | 5,00 | ||||
| 2025-07-24 | 13F | IFP Advisors, Inc | 2 872 | −22,90 | 127 | −22,22 | ||||
| 2025-08-05 | 13F | Lifeworks Advisors, LLC | 5 604 | −0,71 | 247 | 0,41 | ||||
| 2025-08-01 | 13F | Austin Private Wealth, LLC | 63 082 | 76,27 | 2 784 | 78,35 | ||||
| 2025-08-06 | 13F | Legacy Investment Solutions, LLC | 96 | 0,00 | 4 | 0,00 | ||||
| 2025-08-06 | 13F | Ironwood Wealth Management, LLC. | 912 | −79,71 | 40 | −79,59 | ||||
| 2025-08-08 | 13F | Capstone Financial Advisors, Inc. | 66 449 | 0,00 | 2 933 | 1,17 | ||||
| 2025-07-11 | 13F | Addis & Hill, Inc | 141 550 | −1,89 | 6 248 | −0,78 | ||||
| 2025-05-15 | 13F/A | Orion Portfolio Solutions, LLC | 14 118 | 13,22 | 616 | 15,36 | ||||
| 2025-08-13 | 13F | M&t Bank Corp | 72 432 | 145,59 | 3 197 | 148,33 | ||||
| 2025-07-09 | 13F | Pacific Capital Wealth Advisors, Inc | 6 578 | −36,60 | 290 | −35,84 | ||||
| 2025-07-17 | 13F | Wolff Wiese Magana Llc | 40 | 0,00 | 2 | 0,00 | ||||
| 2025-04-29 | 13F | Financial Network Wealth Management LLC | 623 | 0 | ||||||
| 2025-08-13 | 13F | Continuum Advisory, LLC | 0 | −100,00 | 0 | |||||
| 2025-08-08 | 13F | Larson Financial Group LLC | 2 444 | −16,07 | 108 | −15,75 | ||||
| 2025-08-12 | 13F | Foster Dykema Cabot & Partners, Llc | 53 | 0,00 | 2 | 0,00 | ||||
| 2025-08-12 | 13F | Jpmorgan Chase & Co | 3 277 | 0,09 | 145 | 1,41 | ||||
| 2025-08-14 | 13F | Smartleaf Asset Management LLC | 450 | −21,74 | 20 | −20,83 | ||||
| 2025-08-14 | 13F | Murphy & Mullick Capital Management Corp | 62 | 0,00 | 3 | 0,00 | ||||
| 2025-07-07 | 13F | Discipline Wealth Solutions, LLC | 4 622 | 204 | ||||||
| 2025-08-01 | 13F | SYM FINANCIAL Corp | 52 | 0,00 | 2 | 0,00 | ||||
| 2025-07-29 | 13F | MPS Loria Financial Planners, LLC | 10 824 | 0,82 | 478 | 1,92 | ||||
| 2025-07-24 | 13F | PDS Planning, Inc | 5 384 | 0,54 | 238 | 1,72 | ||||
| 2025-07-30 | 13F | Bogart Wealth, LLC | 6 | 0,00 | 0 | |||||
| 2025-08-08 | 13F | Bailard, Inc. | 7 402 | −1,00 | 327 | 0,00 | ||||
| 2025-07-25 | 13F | LRI Investments, LLC | 108 | 0,00 | 5 | 0,00 | ||||
| 2025-08-14 | 13F | Qube Research & Technologies Ltd | 154 | −69,74 | 7 | −72,73 | ||||
| 2025-08-14 | 13F | Jane Street Group, Llc | 450 000 | 1 264,13 | 19 863 | 1 280,33 | ||||
| 2025-07-14 | 13F | AdvisorNet Financial, Inc | 529 | 0,19 | 23 | 0,00 | ||||
| 2025-07-31 | 13F | FSM Wealth Advisors, LLC | 47 203 | −28,50 | 2 083 | −27,73 | ||||
| 2025-08-14 | 13F | Ancora Advisors, LLC | 2 965 | −8,49 | 131 | −7,80 | ||||
| 2025-07-31 | 13F | Brighton Jones Llc | 279 256 | 3,32 | 12 326 | 4,50 | ||||
| 2025-05-13 | 13F | Heck Capital Advisors, LLC | 0 | −100,00 | 0 | −100,00 | ||||
| 2025-08-13 | 13F | Baird Financial Group, Inc. | 8 407 | −1,45 | 371 | −0,27 | ||||
| 2025-07-15 | 13F | Evanson Asset Management, LLC | 6 467 | 0,00 | 285 | 1,06 | ||||
| 2025-07-22 | 13F | SOL Capital Management CO | 11 450 | −0,69 | 1 | |||||
| 2025-07-23 | 13F | Nbt Bank N A /ny | 342 | 0,00 | 15 | 7,14 | ||||
| 2025-08-07 | 13F | Efficient Advisors, LLC | 12 293 | −39,13 | 543 | −38,48 | ||||
| 2025-08-01 | 13F | Gwn Securities Inc. | 0 | −100,00 | 0 | |||||
| 2025-08-04 | 13F | IFG Advisory, LLC | 22 174 | 0,65 | 979 | 1,77 | ||||
| 2025-08-11 | 13F | Independent Advisor Alliance | 16 396 | 12,20 | 724 | 13,50 | ||||
| 2025-08-14 | 13F | Great Valley Advisor Group, Inc. | 31 176 | 3,50 | 1 376 | 4,72 | ||||
| 2025-08-01 | 13F | Rossby Financial, LCC | 40 | 0,00 | 2 | 0,00 | ||||
| 2025-07-15 | 13F | Fifth Third Bancorp | 15 250 | 9,26 | 673 | 10,51 | ||||
| 2025-04-28 | 13F | Fedenia Advisers LLC | 0 | −100,00 | 0 | |||||
| 2025-08-06 | 13F | Columbia River Financial Group, LLC | 31 788 | −9,45 | 1 | 0,00 | ||||
| 2025-08-11 | 13F | Private Advisor Group, LLC | 15 084 | −8,16 | 666 | −7,12 | ||||
| 2025-08-12 | 13F | J.w. Cole Advisors, Inc. | 5 376 | −42,79 | 237 | −42,20 | ||||
| 2025-07-08 | 13F | Parallel Advisors, LLC | 1 518 | 1,07 | 67 | 1,54 | ||||
| 2025-09-04 | 13F/A | Advisor Group Holdings, Inc. | 28 002 | 91,94 | 1 236 | 94,03 | ||||
| 2025-04-22 | 13F | Rappaport Reiches Capital Management, LLC | 76 602 | 1,88 | 3 343 | 3,66 | ||||
| 2025-08-06 | 13F | Walkner Condon Financial Advisors LLC | 0 | −100,00 | 0 | |||||
| 2025-08-14 | 13F | UBS Group AG | 20 482 | −6,73 | 904 | −5,64 | ||||
| 2025-05-06 | 13F | City National Bank Of Florida /msd | 0 | −100,00 | 0 | |||||
| 2025-07-30 | 13F | Avidian Wealth Solutions, LLC | 143 592 | 3,57 | 6 338 | 4,76 | ||||
| 2025-08-11 | 13F | Aptus Capital Advisors, LLC | 106 | 0,00 | 5 | 0,00 | ||||
| 2025-08-13 | 13F | Mount Yale Investment Advisors, LLC | 131 | 6 | ||||||
| 2025-07-22 | 13F | Simplicity Wealth,LLC | 37 766 | 1 667 | ||||||
| 2025-08-12 | 13F | Proequities, Inc. | 0 | 0 | ||||||
| 2025-05-15 | 13F | Lido Advisors, LLC | 0 | −100,00 | 0 | −100,00 | ||||
| 2025-07-14 | 13F | UMA Financial Services, Inc. | 1 102 | 0,00 | 49 | 0,00 | ||||
| 2025-07-28 | 13F | Mutual Advisors, LLC | 0 | −100,00 | 0 | |||||
| 2025-07-29 | 13F | Kondo Wealth Advisors, Inc. | 5 186 | 0,68 | 231 | 2,68 | ||||
| 2025-08-08 | 13F | Gts Securities Llc | 5 879 | 259 | ||||||
| 2025-08-14 | 13F | Mariner, LLC | 307 117 | 4,79 | 13 556 | 5,99 | ||||
| 2025-08-06 | 13F | Commonwealth Equity Services, Llc | 8 347 | −10,94 | 0 | |||||
| 2025-07-31 | 13F | Waldron Private Wealth LLC | 123 099 | −3,34 | 5 434 | −2,23 | ||||
| 2025-07-25 | 13F | Northwest Capital Management Inc | 71 | 0,00 | 3 | 0,00 | ||||
| 2025-07-31 | 13F | Glass Jacobson Investment Advisors llc | 30 | 0,00 | 1 | 0,00 | ||||
| 2025-08-05 | 13F | Hills Bank & Trust Co | 282 877 | −5,45 | 12 486 | −4,37 | ||||
| 2025-07-30 | 13F | Loring Wolcott & Coolidge Fiduciary Advisors Llp/ma | 300 | 0,00 | 13 | 8,33 | ||||
| 2025-08-04 | 13F | Creative Financial Designs Inc /adv | 2 275 | 69,78 | 100 | 72,41 | ||||
| 2025-08-01 | 13F | Envestnet Asset Management Inc | 331 806 | −46,94 | 14 632 | −46,38 | ||||
| 2025-08-13 | 13F | Jones Financial Companies Lllp | 139 111 | 1,94 | 6 126 | 3,57 | ||||
| 2025-08-05 | 13F | Bank Of Montreal /can/ | 732 | −85,68 | 32 | −85,65 | ||||
| 2025-08-14 | 13F/A | Barclays Plc | 27 771 | 5,63 | 1 | 0,00 | ||||
| 2025-07-24 | 13F | Jfs Wealth Advisors, Llc | 97 532 | −2,68 | 4 305 | −1,55 | ||||
| 2025-08-13 | 13F | Safe Harbor Fiduciary, LLC | 156 | 23,81 | 7 | 20,00 | ||||
| 2025-07-24 | 13F | Blair William & Co/il | 34 827 | −13,58 | 1 537 | −12,57 | ||||
| 2025-05-28 | NP | SSBNX - State Street Target Retirement 2020 Fund Class I This fund is a listed as child fund of State Street Corp and if that institution has disclosed ownership in this security, then these positions will not be double counted when calculating total shares and total value | 924 011 | −11,99 | 40 324 | −10,46 | ||||
| 2025-07-28 | 13F | Courier Capital Llc | 13 125 | −9,50 | 579 | −8,39 | ||||
| 2025-07-07 | 13F | First Community Trust Na | 900 | 0,00 | 40 | 0,00 | ||||
| 2025-08-08 | 13F | Capital Investment Advisory Services, LLC | 66 | 0,00 | 3 | 0,00 | ||||
| 2025-08-14 | 13F | GWM Advisors LLC | 5 250 | −20,86 | 232 | −20,07 | ||||
| 2025-08-28 | NP | SSBRX - State Street Target Retirement 2025 Fund Class I This fund is a listed as child fund of State Street Corp and if that institution has disclosed ownership in this security, then these positions will not be double counted when calculating total shares and total value | 2 219 600 | −0,21 | 97 973 | 0,94 | ||||
| 2025-08-07 | 13F | FDx Advisors, Inc. | 5 812 | −0,80 | 0 | |||||
| 2025-08-14 | 13F | Guardian Wealth Advisors, Llc / Nc | 106 | 0,00 | 5 | 0,00 | ||||
| 2025-08-14 | 13F | Royal Bank Of Canada | 53 317 | −5,13 | 2 354 | −4,04 | ||||
| 2025-07-28 | 13F | Rosenberg Matthew Hamilton | 185 | 0,00 | 8 | 0,00 | ||||
| 2025-08-11 | 13F | HighTower Advisors, LLC | 113 052 | 13,24 | 4 990 | 14,55 | ||||
| 2025-08-13 | 13F | Northwestern Mutual Wealth Management Co | 26 973 | −0,35 | 1 191 | 0,76 | ||||
| 2025-07-17 | 13F | Sound Income Strategies, LLC | 34 | 0,00 | 2 | 0,00 | ||||
| 2025-08-08 | 13F | Altfest L J & Co Inc | 39 587 | −1,18 | 1 747 | −0,06 | ||||
| 2025-08-06 | 13F | ORBA Wealth Advisors, L.L.C. | 16 875 | −42,29 | 745 | −41,69 | ||||
| 2025-07-10 | 13F | Brooklyn FI, LLC | 61 902 | −4,12 | 2 732 | −3,02 | ||||
| 2025-07-21 | 13F | Quent Capital, LLC | 435 275 | 8,87 | 19 213 | 10,12 | ||||
| 2025-07-24 | 13F | Us Bancorp \de\ | 4 332 | 3,93 | 191 | 5,52 | ||||
| 2025-08-14 | 13F | Raymond James Financial Inc | 351 013 | 3,36 | 15 494 | 4,55 | ||||
| 2025-08-14 | 13F | Archetype Wealth Partners | 16 714 | −0,85 | 1 | |||||
| 2025-04-10 | 13F | St. Clair Advisors, LLC | 0 | −100,00 | 0 | −100,00 | ||||
| 2025-08-13 | 13F | Financial Freedom, LLC | 285 | 1,06 | 13 | 0,00 | ||||
| 2025-08-28 | NP | SSBWX - State Street Target Retirement 2030 Fund Class I This fund is a listed as child fund of State Street Corp and if that institution has disclosed ownership in this security, then these positions will not be double counted when calculating total shares and total value | 2 032 945 | 9,36 | 89 734 | 10,61 | ||||
| 2025-07-14 | 13F | Signature Securities Group Corporation | 4 713 | 208 | ||||||
| 2025-08-11 | 13F | Nomura Asset Management Co Ltd | 7 000 | 0,00 | 309 | 0,98 | ||||
| 2025-07-15 | 13F | Total Wealth Planning, Llc | 26 695 | −8,94 | 1 178 | −7,90 | ||||
| 2025-08-06 | 13F | Innealta Capital, Llc | 8 830 | 12,53 | 390 | 13,74 | ||||
| 2025-08-12 | 13F | Virtu Financial LLC | 0 | −100,00 | 0 | |||||
| 2025-08-12 | 13F | OneAscent Financial Services LLC | 11 440 | 1 | ||||||
| 2025-07-23 | 13F | Valmark Advisers, Inc. | 101 143 | 13,50 | 4 464 | 14,81 | ||||
| 2025-07-29 | 13F | Tradewinds Capital Management, LLC | 16 | 0,00 | 1 | |||||
| 2025-08-14 | 13F | Fmr Llc | 1 776 | −36,23 | 78 | −35,54 | ||||
| 2025-08-14 | 13F | Mercer Global Advisors Inc /adv | 82 604 | −27,98 | 3 646 | −27,15 | ||||
| 2025-08-14 | 13F | Mml Investors Services, Llc | 92 779 | 1,69 | 4 | 33,33 | ||||
| 2025-08-14 | 13F | Matrix Private Capital Group Llc | 19 127 | −8,20 | 844 | −7,15 | ||||
| 2025-08-13 | 13F | Fi3 FINANCIAL ADVISORS, LLC | 7 786 | 344 | ||||||
| 2025-08-13 | 13F | EverSource Wealth Advisors, LLC | 830 | 0,00 | 37 | 0,00 | ||||
| 2025-08-12 | 13F | MAI Capital Management | 3 968 | −18,42 | 175 | −17,45 | ||||
| 2025-08-12 | 13F | LPL Financial LLC | 183 742 | −0,05 | 8 110 | 1,10 | ||||
| 2025-07-31 | 13F | BIP Wealth, LLC | 28 576 | −6,13 | 1 261 | −5,05 | ||||
| 2025-08-14 | 13F | AllSquare Wealth Management LLC | 22 | 0,00 | 1 | |||||
| 2025-08-07 | 13F | Parkside Financial Bank & Trust | 471 | 0,00 | 21 | 0,00 | ||||
| 2025-08-14 | 13F | Financial Advisory Service, Inc. | 1 578 | −0,75 | 70 | 0,00 | ||||
| 2025-08-12 | 13F | SRS Capital Advisors, Inc. | 32 | 0,00 | 1 | 0,00 | ||||
| 2025-08-04 | 13F | Assetmark, Inc | 31 | 1 | ||||||
| 2025-07-08 | 13F | Nbc Securities, Inc. | 15 030 | 1 107,23 | 1 | |||||
| 2025-08-06 | 13F | Legacy Wealth Managment, LLC/ID | 96 | 0,00 | 4 | 0,00 | ||||
| 2025-08-05 | 13F | Huntington National Bank | 66 489 | 2,32 | ||||||
| 2025-08-13 | 13F | Virtue Capital Management, LLC | 0 | −100,00 | 0 | |||||
| 2025-08-05 | 13F | Bank of New York Mellon Corp | 1 386 448 | −3,49 | 61 198 | −2,38 | ||||
| 2025-07-21 | 13F | Empirical Financial Services, LLC d.b.a. Empirical Wealth Management | 5 471 | −0,87 | 241 | 0,42 | ||||
| 2025-08-11 | 13F | Principal Securities, Inc. | 16 | 0,00 | 1 | |||||
| 2025-08-14 | 13F | CoreCap Advisors, LLC | 3 152 | −4,40 | 139 | −2,80 | ||||
| 2025-07-31 | 13F/A | Avion Wealth | 110 | 0,00 | 0 | |||||
| 2025-07-25 | 13F | Cwm, Llc | 2 379 | 8,48 | 0 | |||||
| 2025-08-14 | 13F | Wells Fargo & Company/mn | 14 972 | −3,07 | 661 | −2,08 | ||||
| 2025-07-31 | 13F | Hoge Financial Services, Llc | 6 830 | −26,21 | 301 | −25,31 | ||||
| 2025-08-14 | 13F | Susquehanna International Group, Llp | 8 532 | −29,63 | 377 | −28,92 | ||||
| 2025-08-04 | 13F | Jim Saulnier & Associates, Llc | 6 904 | −7,24 | 305 | −6,17 | ||||
| 2025-08-14 | 13F | DHK Financial Advisors, Inc. | 25 481 | 1,02 | 1 125 | 2,18 | ||||
| 2025-07-11 | 13F | Farther Finance Advisors, LLC | 0 | −100,00 | 0 | |||||
| 2025-07-21 | 13F/A | Abacus Planning Group, Inc. | 32 781 | −0,12 | 1 447 | 0,98 | ||||
| 2025-08-11 | 13F | HHM Wealth Advisors, LLC | 24 235 | −19,57 | 1 070 | −18,65 | ||||
| 2025-04-24 | 13F | Decker Retirement Planning Inc. | 0 | −100,00 | 0 | |||||
| 2025-08-08 | 13F | Creative Planning | 21 022 | −2,47 | 928 | −1,38 | ||||
| 2025-08-13 | 13F | Hsbc Holdings Plc | 446 114 | −2,51 | 19 691 | −1,39 | ||||
| 2025-07-10 | 13F | Wealth Enhancement Advisory Services, Llc | 9 474 | −42,38 | 422 | −41,14 | ||||
| 2025-08-18 | 13F | N.E.W. Advisory Services LLC | 4 447 | −0,31 | 196 | 1,03 | ||||
| 2025-08-27 | 13F/A | Brinker Capital Investments, LLC | 18 159 | 28,62 | 802 | 30,03 | ||||
| 2025-05-15 | 13F | Glenmede Trust Co Na | 898 714 | −2,40 | 39 220 | −0,69 | ||||
| 2025-05-14 | 13F | Van Hulzen Asset Management, LLC | 0 | −100,00 | 0 | −100,00 | ||||
| 2025-07-25 | 13F | Endowment Wealth Management, Inc. | 4 658 | 206 | ||||||
| 2025-08-14 | 13F | Colony Group, LLC | 60 894 | −9,79 | 2 688 | −8,76 | ||||
| 2025-08-11 | 13F | Citigroup Inc | 0 | −100,00 | 0 | |||||
| 2025-07-24 | 13F | Trust Co Of Toledo Na /oh/ | 300 | 13 | ||||||
| 2025-08-14 | 13F | Cardiff Park Advisors, Llc | 1 591 | 0,00 | 70 | 1,45 | ||||
| 2025-08-12 | 13F | Integrated Advisors Network LLC | 9 098 | −3,35 | 402 | −2,20 | ||||
| 2025-04-14 | 13F | First Citizens Bank & Trust Co | 0 | −100,00 | 0 | −100,00 | ||||
| 2025-08-13 | 13F | SageView Advisory Group, LLC | 7 197 | 11,32 | 317 | 12,06 | ||||
| 2025-08-14 | 13F | Old Mission Capital Llc | 0 | −100,00 | 0 | |||||
| 2025-07-09 | 13F | Brand Asset Management Group, Inc. | 21 733 | 5,28 | 959 | 6,56 | ||||
| 2025-08-11 | 13F | Heritage Wealth Advisors | 21 | 0,00 | 1 | |||||
| 2025-08-14 | 13F | Bank Of America Corp /de/ | 1 443 869 | 1,40 | 63 732 | 2,56 | ||||
| 2025-07-10 | 13F | Farmers & Merchants Trust Co of Chambersburg PA | 298 | 0,00 | 0 | |||||
| 2025-07-08 | 13F | Apella Capital, LLC | 23 738 | −27,73 | 1 048 | −22,56 | ||||
| 2025-08-13 | 13F | Beacon Pointe Advisors, LLC | 62 868 | −16,48 | 2 775 | −15,56 | ||||
| 2025-08-14 | 13F | State Street Corp | 6 154 007 | 4,38 | 271 638 | 5,58 | ||||
| 2025-08-04 | 13F | Wolverine Asset Management Llc | 22 393 | 988 | ||||||
| 2025-08-06 | 13F | Savant Capital, LLC | 21 736 | −8,72 | 959 | −7,70 | ||||
| 2025-08-11 | 13F | One Capital Management, LLC | 72 421 | −2,57 | 3 197 | −1,45 | ||||
| 2025-08-08 | 13F | Pnc Financial Services Group, Inc. | 1 744 | 217,09 | 77 | 216,67 | ||||
| 2025-08-13 | 13F | Cerity Partners LLC | 130 714 | −0,18 | 5 770 | 0,96 | ||||
| 2025-07-22 | 13F | Aspire Private Capital, LLC | 18 613 | 0,44 | 822 | 1,61 | ||||
| 2025-07-07 | 13F | Thurston, Springer, Miller, Herd & Titak, Inc. | 72 | 0,00 | 3 | 0,00 | ||||
| 2025-07-24 | 13F | Lester Murray Antman dba SimplyRich | 23 237 | 0,00 | 1 | 0,00 | ||||
| 2025-04-11 | 13F | Princeton Global Asset Management LLC | 0 | −100,00 | 0 | |||||
| 2025-08-14 | 13F | Goldman Sachs Group Inc | 567 912 | 1,54 | 25 068 | 2,70 | ||||
| 2025-08-28 | NP | SSCJX - State Street Target Retirement 2035 Fund Class I This fund is a listed as child fund of State Street Corp and if that institution has disclosed ownership in this security, then these positions will not be double counted when calculating total shares and total value | 187 815 | 103,54 | 8 290 | 105,91 | ||||
| 2025-08-07 | 13F | Tilson Financial Group, Inc. | 7 312 | 0 | ||||||
| 2025-08-13 | 13F | Nicolet Advisory Services, Llc | 8 117 | −3,05 | 354 | 4,44 | ||||
| 2025-08-08 | 13F | Cetera Investment Advisers | 42 051 | 0,44 | 1 856 | 1,59 | ||||
| 2025-04-04 | 13F | Webster Bank, N. A. | 0 | −100,00 | 0 | |||||
| 2025-07-15 | 13F | Mather Group, Llc. | 0 | −100,00 | 0 | |||||
| 2025-07-16 | 13F | ORG Wealth Partners, LLC | 17 | 0,00 | 1 | |||||
| 2025-08-06 | 13F | Modera Wealth Management, LLC | 208 895 | −0,21 | 9 221 | 0,93 | ||||
| 2025-07-17 | 13F | Emerald Advisors, LLC | 5 943 | 262 | ||||||
| 2025-03-28 | 13F/A | Berkeley, Inc | 0 | −100,00 | 0 | −100,00 | ||||
| 2025-07-22 | 13F | USAdvisors Wealth Management, LLC | 4 840 | 1,49 | 0 | |||||
| 2025-08-12 | 13F | CIBC Private Wealth Group, LLC | 0 | −100,00 | 0 | |||||
| 2025-08-12 | 13F | Sky-mountain Capital Management, Inc. | 8 897 | −49,41 | 395 | −48,63 | ||||
| 2025-08-15 | 13F | Kestra Advisory Services, LLC | 5 368 | 237 | ||||||
| 2025-07-14 | 13F | Park Avenue Securities Llc | 64 828 | 3 | ||||||
| 2025-07-25 | 13F | Envestnet Portfolio Solutions, Inc. | 4 988 | −33,45 | 220 | −32,72 | ||||
| 2025-08-13 | 13F | Transce3nd, LLC | 439 | 3,54 | 19 | 5,56 | ||||
| 2025-07-17 | 13F | XML Financial, LLC | 15 170 | 0,75 | 670 | 1,83 | ||||
| 2025-07-03 | 13F | Fiduciary Financial Group, Llc | 22 115 | 3,41 | 985 | 13,76 | ||||
| 2025-07-29 | 13F | Orin Green Financial, LLC | 115 241 | 0,14 | 5 087 | 5,15 | ||||
| 2025-08-07 | 13F/A | Joseph Group Capital Management | 1 185 | −8,42 | 52 | −7,14 | ||||
| 2025-05-15 | 13F | Citadel Advisors Llc | 0 | −100,00 | 0 | |||||
| 2025-08-11 | 13F | CBIZ Investment Advisory Services, LLC | 11 | −96,71 | 0 | −100,00 | ||||
| 2025-08-14 | 13F | Comerica Bank | 355 | 0,00 | 16 | 0,00 | ||||
| 2025-08-05 | 13F | Tsfg, Llc | 120 | 0,84 | 0 | |||||
| 2025-08-14 | 13F | Glenmede Investment Management, LP | 776 801 | 34 288 | ||||||
| 2025-07-10 | 13F | Envision Financial LLC | 10 543 | −0,60 | 465 | 0,65 | ||||
| 2025-08-12 | 13F | Global Retirement Partners, LLC | 930 | −6,25 | 41 | −2,38 | ||||
| 2025-08-18 | 13F | Geneos Wealth Management Inc. | 215 | 0,00 | 9 | 0,00 | ||||
| 2025-07-25 | 13F | Fifth Third Wealth Advisors LLC | 6 054 | −25,22 | 267 | −24,36 | ||||
| 2025-08-13 | 13F | Natixis Advisors, L.p. | 69 538 | 0,48 | 3 | 0,00 | ||||
| 2025-08-01 | 13F | First Command Advisory Services, Inc. | 3 474 | −34,55 | 153 | −33,77 | ||||
| 2025-08-14 | 13F | FC Advisory LLC | 7 137 | −2,94 | 315 | −1,56 | ||||
| 2025-05-15 | 13F | Manufacturers Life Insurance Company, The | 0 | −100,00 | 0 | |||||
| 2025-08-15 | 13F | Morgan Stanley | 420 759 | −1,62 | 18 572 | −0,49 | ||||
| 2025-07-31 | 13F | Cambridge Investment Research Advisors, Inc. | 70 050 | 1,29 | 3 | 0,00 | ||||
| 2025-07-18 | 13F | Trust Co Of Vermont | 88 | 0,00 | 4 | 0,00 | ||||
| 2025-08-28 | NP | SSFNX - State Street Target Retirement Fund Class I This fund is a listed as child fund of State Street Corp and if that institution has disclosed ownership in this security, then these positions will not be double counted when calculating total shares and total value | 1 713 647 | −0,38 | 75 640 | 0,77 | ||||
| 2025-08-05 | 13F | Key FInancial Inc | 37 | 0,00 | 2 | 0,00 | ||||
| 2025-08-13 | 13F | Capital Analysts, Inc. | 1 787 | 0,90 | 0 | |||||
| 2025-08-14 | 13F | Family Office Research LLC | 13 547 | −32,03 | 598 | −31,19 | ||||
| 2025-07-15 | 13F | Main Street Group, LTD | 672 | −2,75 | 30 | −3,33 | ||||
| 2025-07-29 | 13F | Private Trust Co Na | 48 | 0,00 | 2 | 0,00 | ||||
| 2025-08-08 | 13F | Hartland & Co., LLC | 250 | −84,11 | 11 | −83,82 | ||||
| 2025-07-28 | 13F | Lunt Capital Management, Inc. | 10 764 | 475 | ||||||
| 2025-07-22 | 13F | Coastal Investment Advisors, Inc. | 83 | 0,00 | 4 | 0,00 |
Other Listings
| MX:RWO |