Grundläggande statistik
| Institutionella ägare | 214 total, 214 long only, 0 short only, 0 long/short - change of 4,37% MRQ |
| Genomsnittlig portföljallokering | 0.2887 % - change of 10,54% MRQ |
| Institutionella aktier (lång) | 34 265 953 (ex 13D/G) - change of 2,88MM shares 9,17% MRQ |
| Institutionellt värde (lång) | $ 1 837 343 USD ($1000) |
Institutionellt ägande och aktieägare
Invesco Exchange-Traded Fund Trust II - Invesco RAFI Developed Markets ex-U.S. ETF (US:PXF) har 214 Institutionella ägare och aktieägare som har lämnat in 13D/G- eller 13F-formulär till Securities Exchange Commission (SEC). Dessa institut innehar totalt 34,265,953 aktier. Största aktieägare inkluderar Charles Schwab Investment Management Inc, Invesco Ltd., Proficio Capital Partners LLC, Morgan Stanley, AIM GROWTH SERIES (INVESCO GROWTH SERIES) - Invesco Oppenheimer Portfolio Series: Active Allocation Fund Class R5, Victory Capital Management Inc, AIM GROWTH SERIES (INVESCO GROWTH SERIES) - Invesco Oppenheimer Portfolio Series: Moderate Investor Fund Class C, Bank Of America Corp /de/, Bank of New York Mellon Corp, and USCRX - Cornerstone Moderately Aggressive Fund .
Invesco Exchange-Traded Fund Trust II - Invesco RAFI Developed Markets ex-U.S. ETF (ARCA:PXF) Institutionell ägarstruktur visar institutioners och fonders nuvarande positioner i företaget, samt de senaste förändringarna i positionernas storlek. Större aktieägare kan vara enskilda investerare, fonder, hedgefonder eller institutioner. Bilaga 13D visar att investeraren äger (eller ägde) mer än 5% av företaget och avser (eller avsåg) att aktivt eftersträva en förändring av affärsstrategin. Schedule 13G indikerar en passiv investering på över 5%.
The share price as of September 10, 2025 is 60,89 / share. Previously, on September 11, 2024, the share price was 50,30 / share. This represents an increase of 21,04% over that period.

Fondsentimentets poäng
Fondsentimentet poängen(fka Ägarackumulation-poäng) visar vilka aktier som är mest köpta av fonder. Det är resultatet av en sofistikerad kvantitativ flerfaktormodell som identifierar företag med de högsta nivåerna av institutionell ackumulering. Poängsättningsmodellen använder en kombination av den totala ökningen av redovisade ägare, förändringarna i portföljallokeringarna för dessa ägare och andra mått. Siffran sträcker sig från 0 till 100, där högre siffror indikerar en högre nivå av ackumulering i förhållande till sina konkurrenter, och 50 är genomsnittet.
Uppdateringsfrekvens: Dagligen
Se Ownership Explorer, som innehåller en lista över de högst rankade företagen.
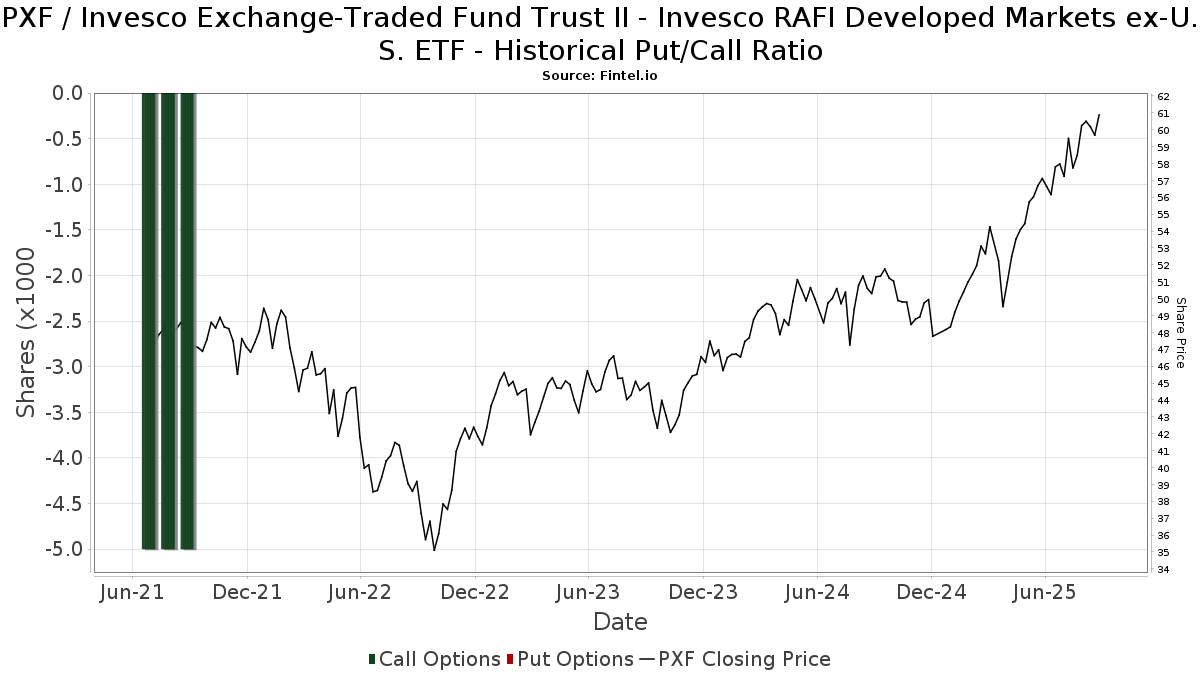
Institutionell sälj/köp-kvot
Förutom att rapportera vanliga eget kapital- och skuldemissioner måste institutioner med mer än 100MM tillgångar under förvaltning också avslöja sina innehav av sälj- och köpoptioner. Eftersom säljoptioner i allmänhet indikerar ett negativt sentiment och köpoptioner indikerar ett positivt sentiment, kan vi få en uppfattning om det övergripande institutionella sentimentet genom att plotta förhållandet mellan säljoptioner och köpoptioner. Diagrammet till höger visar det historiska förhållandet mellan sälj- och köpoptioner för detta instrument.
Genom att använda sälj/köp-kvoten som en indikator på aktieägarnas sentiment undviker man en av de största bristerna med att använda det totala institutionella ägandet, nämligen att en betydande del av de förvaltade tillgångarna investeras passivt för att följa index. Passivt förvaltade fonder köper vanligtvis inte optioner, så indikatorn för sälj/köp-kvoten ger en bättre bild av stämningen i aktivt förvaltade fonder.
13F- och NPORT-arkiveringar
Detaljer om 13F-arkiveringar är gratis. Detaljer om NP-arkiveringar kräver ett premiummedlemskap. Gröna rader indikerar nya positioner. Röda rader indikerar stängda positioner. Klicka på länk symbolen för att se hela transaktionshistoriken.
Uppgradera
för att låsa upp premiumdata och exportera till Excel ![]() .
.
| Fil Datum | Källa | Investerare | Typ | Genomsnittligt pris (beräknat) |
Aktier | Δ Aktier (%) |
Rapporterat värde (1000 USD) |
Δ Värde (%) |
Portföljallokering (%) |
|
|---|---|---|---|---|---|---|---|---|---|---|
| 2025-07-23 | 13F | Bellevue Asset Management, Llc | 721 | 0,84 | 41 | 10,81 | ||||
| 2025-07-30 | 13F | Cullen/frost Bankers, Inc. | 154 | 9 | ||||||
| 2025-07-24 | 13F | Blair William & Co/il | 1 030 | 0,39 | 59 | 11,32 | ||||
| 2025-08-15 | 13F | Morgan Stanley | 1 322 481 | 23,87 | 75 937 | 36,81 | ||||
| 2025-05-02 | 13F | United Community Bank | 0 | −100,00 | 0 | |||||
| 2025-04-30 | 13F | Ridgeline Wealth Planning, LLC | 0 | −100,00 | 0 | |||||
| 2025-08-04 | 13F | Bristlecone Advisors, LLC | 0 | −100,00 | 0 | |||||
| 2025-07-25 | 13F | McNamara Financial Services, Inc. | 3 949 | −2,06 | 227 | 8,13 | ||||
| 2025-07-25 | 13F | NorthRock Partners, LLC | 946 | −76,24 | 54 | −73,79 | ||||
| 2025-08-14 | 13F | Federation des caisses Desjardins du Quebec | 3 423 | 0,00 | 197 | 10,73 | ||||
| 2025-07-23 | 13F | Godsey & Gibb Associates | 311 | 18 | ||||||
| 2025-07-28 | 13F | Deroy & Devereaux Private Investment Counsel Inc | 3 570 | 0 | ||||||
| 2025-08-11 | 13F | Rothschild Investment Llc | 21 455 | 7,84 | 1 232 | 19,05 | ||||
| 2025-08-12 | 13F | RiverFront Investment Group, LLC | 4 583 | 263 | ||||||
| 2025-05-06 | 13F | Lifeworks Advisors, LLC | 0 | −100,00 | 0 | |||||
| 2025-08-08 | 13F | Emerald Investment Partners, Llc | 457 | −3,18 | 26 | 8,33 | ||||
| 2025-05-22 | 13F | Mattson Financial Services, LLC | 0 | −100,00 | 0 | |||||
| 2025-07-28 | 13F | Aries Wealth Management | 23 596 | 0,00 | 1 355 | 10,44 | ||||
| 2025-08-14 | 13F | Warren Averett Asset Management, LLC | 68 445 | −0,20 | 3 930 | 10,24 | ||||
| 2025-07-08 | 13F | Zrc Wealth Management, Llc | 205 | 1,49 | 12 | 10,00 | ||||
| 2025-07-24 | 13F | Jfs Wealth Advisors, Llc | 12 483 | −2,04 | 717 | 8,16 | ||||
| 2025-07-16 | 13F | Octavia Wealth Advisors, LLC | 11 235 | 0,00 | 645 | 10,45 | ||||
| 2025-07-28 | 13F | Cutler Investment Counsel Llc | 3 695 | 212 | ||||||
| 2025-08-08 | 13F | Creative Planning | 70 917 | 3,78 | 4 072 | 14,64 | ||||
| 2025-07-21 | 13F | Quent Capital, LLC | 0 | −100,00 | 0 | |||||
| 2025-07-28 | 13F | Harbour Investments, Inc. | 883 | 103,93 | 51 | 127,27 | ||||
| 2025-05-05 | 13F | Private Advisor Group, LLC | 0 | −100,00 | 0 | |||||
| 2025-05-15 | 13F | Glenmede Trust Co Na | 65 345 | −0,84 | 3 397 | 7,67 | ||||
| 2025-08-12 | 13F | Archer Investment Corp | 66 099 | 1,65 | 3 795 | 12,28 | ||||
| 2025-08-01 | 13F | Envestnet Asset Management Inc | 92 898 | −5,25 | 5 293 | 3,83 | ||||
| 2025-08-11 | 13F | Aptus Capital Advisors, LLC | 2 729 | −0,44 | 157 | 9,86 | ||||
| 2025-08-05 | 13F | Plante Moran Financial Advisors, LLC | 0 | −100,00 | 0 | |||||
| 2025-08-12 | 13F | Coston, McIsaac & Partners | 150 | 0,00 | 0 | |||||
| 2025-08-15 | 13F | CI Private Wealth, LLC | 480 380 | −10,79 | 27 583 | −1,48 | ||||
| 2025-08-12 | 13F | Shakespeare Wealth Management, Inc. | 26 941 | −20,34 | 1 547 | −12,06 | ||||
| 2025-08-28 | NP | AIM GROWTH SERIES (INVESCO GROWTH SERIES) - Invesco Oppenheimer Portfolio Series: Active Allocation Fund Class R5 | 1 215 737 | 8,54 | 69 808 | 19,88 | ||||
| 2025-08-14 | 13F | Ieq Capital, Llc | 9 483 | 0,00 | 545 | 10,34 | ||||
| 2025-08-12 | 13F | Integrated Advisors Network LLC | 24 237 | −14,03 | 1 392 | −5,05 | ||||
| 2025-07-14 | 13F | Abound Wealth Management | 1 073 | 62 | ||||||
| 2025-07-16 | 13F | Moisand Fitzgerald Tamayo, LLC | 477 | 0,00 | 27 | 12,50 | ||||
| 2025-08-11 | 13F | WPG Advisers, LLC | 195 | 0,00 | 11 | 10,00 | ||||
| 2025-07-14 | 13F | AdvisorNet Financial, Inc | 46 | 0,00 | 3 | 0,00 | ||||
| 2025-08-12 | 13F | Cornerstone Wealth Management, LLC | 51 885 | 9,06 | 2 979 | 20,46 | ||||
| 2025-08-14 | 13F | Hara Capital LLC | 477 | 0,00 | 27 | 12,50 | ||||
| 2025-04-23 | 13F | Oppenheimer & Co Inc | 0 | −100,00 | 0 | −100,00 | ||||
| 2025-07-21 | 13F | Empirical Financial Services, LLC d.b.a. Empirical Wealth Management | 4 130 | −5,01 | 237 | 4,87 | ||||
| 2025-08-14 | 13F | Comerica Bank | 7 185 | −4,82 | 413 | 5,10 | ||||
| 2025-07-11 | 13F | Farther Finance Advisors, LLC | 33 | 0,00 | 2 | 0,00 | ||||
| 2025-07-31 | 13F | Wealthfront Advisers Llc | 8 555 | −11,54 | 491 | −2,19 | ||||
| 2025-08-08 | 13F | Hartland & Co., LLC | 0 | −100,00 | 0 | |||||
| 2025-08-13 | 13F | Northern Trust Corp | 4 161 | 239 | ||||||
| 2025-07-08 | 13F | Webster Bank, N. A. | 61 | 0,00 | 4 | 0,00 | ||||
| 2025-08-12 | 13F | Rather & Kittrell, Inc. | 16 351 | −1,32 | 939 | 8,94 | ||||
| 2025-07-17 | 13F/A | Capital Investment Advisors, LLC | 4 182 | 240 | ||||||
| 2025-07-25 | 13F | Cwm, Llc | 3 551 | −23,07 | 0 | |||||
| 2025-07-29 | 13F | Harbor Asset Planning, Inc. | 1 138 | 65 | ||||||
| 2025-07-17 | 13F | Charles Schwab Trust Co | 378 017 | 10,81 | 21 706 | 22,38 | ||||
| 2025-08-13 | 13F | Cerity Partners LLC | 27 281 | −9,76 | 1 566 | −0,32 | ||||
| 2025-08-14 | 13F | Quantinno Capital Management LP | 7 764 | 57,26 | 446 | 73,83 | ||||
| 2025-07-17 | 13F | KWB Wealth | 49 696 | −7,62 | 2 584 | 0,27 | ||||
| 2025-08-13 | 13F | Capital Analysts, Inc. | 1 099 | 0,64 | 0 | |||||
| 2025-08-11 | 13F | Bell Investment Advisors, Inc | 492 | 113,91 | 28 | 154,55 | ||||
| 2025-08-14 | 13F | Garden State Investment Advisory Services LLC | 57 531 | 60,77 | 3 304 | 77,58 | ||||
| 2025-08-13 | 13F | Townsquare Capital Llc | 0 | −100,00 | 0 | |||||
| 2025-04-22 | 13F | Cordant, Inc. | 0 | −100,00 | 0 | |||||
| 2025-07-24 | 13F | Ronald Blue Trust, Inc. | 695 | 0,00 | 40 | 8,33 | ||||
| 2025-08-12 | 13F | Jpmorgan Chase & Co | 116 602 | 64,29 | 6 695 | 81,44 | ||||
| 2025-07-24 | 13F | IFP Advisors, Inc | 2 680 | 3,88 | 154 | 14,18 | ||||
| 2025-08-15 | 13F | WFA of San Diego, LLC | 11 761 | −1,41 | 675 | 8,70 | ||||
| 2025-08-14 | 13F | Financial Advisory Service, Inc. | 493 | 0,00 | 28 | 12,00 | ||||
| 2025-07-10 | 13F | Redhawk Wealth Advisors, Inc. | 83 720 | 4 807 | ||||||
| 2025-08-15 | 13F | Binnacle Investments Inc | 114 | 7 | ||||||
| 2025-08-28 | NP | AIM GROWTH SERIES (INVESCO GROWTH SERIES) - Invesco Oppenheimer Portfolio Series: Moderate Investor Fund Class C | 884 052 | 1,55 | 50 762 | 12,15 | ||||
| 2025-08-08 | 13F | Avantax Advisory Services, Inc. | 22 396 | 1,00 | 1 286 | 11,55 | ||||
| 2025-08-14 | 13F | Betterment LLC | 3 521 | −29,15 | 0 | |||||
| 2025-08-14 | 13F | Jane Street Group, Llc | 49 166 | −37,90 | 2 823 | −31,41 | ||||
| 2025-08-08 | 13F | Gts Securities Llc | 14 057 | 134,09 | 807 | 158,65 | ||||
| 2025-08-14 | 13F | Royal Bank Of Canada | 110 557 | −7,05 | 6 348 | 2,65 | ||||
| 2025-08-07 | 13F | Rathbone Brothers plc | 14 600 | 0,00 | 838 | 10,41 | ||||
| 2025-07-10 | 13F | Global Financial Private Client, LLC | 0 | −100,00 | 0 | |||||
| 2025-08-13 | 13F | Jones Financial Companies Lllp | 30 707 | 126,32 | 1 760 | 147,05 | ||||
| 2025-07-29 | 13F | Foster & Motley Inc | 15 221 | −9,67 | 1 | |||||
| 2025-08-08 | 13F | Pnc Financial Services Group, Inc. | 465 | −47,46 | 27 | −43,48 | ||||
| 2025-08-11 | 13F | Citigroup Inc | 7 915 | −2,80 | 454 | 7,33 | ||||
| 2025-08-14 | 13F | Wells Fargo & Company/mn | 386 923 | −2,71 | 22 217 | 7,45 | ||||
| 2025-08-28 | NP | CMAIX - Invesco Conservative Allocation Fund CLASS R5 | 88 866 | 12,99 | 5 103 | 24,80 | ||||
| 2025-08-11 | 13F | Pin Oak Investment Advisors Inc | 204 | 0 | ||||||
| 2025-08-12 | 13F | CIBC Private Wealth Group, LLC | 130 455 | −6,25 | 7 491 | 16,47 | ||||
| 2025-08-04 | 13F | Mesirow Financial Investment Management, Inc. | 13 729 | −7,67 | 788 | 1,94 | ||||
| 2025-07-16 | 13F | Paragon Capital Management Ltd | 5 086 | 0,00 | 292 | 10,61 | ||||
| 2025-07-30 | 13F | Fairway Wealth LLC | 511 | −15,40 | 29 | −6,45 | ||||
| 2025-08-11 | 13F | Principal Securities, Inc. | 256 | −31,91 | 15 | −22,22 | ||||
| 2025-07-30 | 13F | Castle Wealth Management Llc | 4 831 | 0,00 | 277 | 10,36 | ||||
| 2025-07-24 | 13F | Stonebridge Financial Group, LLC | 0 | −100,00 | 0 | |||||
| 2025-08-28 | NP | AIM GROWTH SERIES (INVESCO GROWTH SERIES) - Invesco Oppenheimer Portfolio Series: Growth Investor Fund Class R6 | 607 809 | 4,39 | 34 900 | 15,30 | ||||
| 2025-08-12 | 13F | Global Retirement Partners, LLC | 112 | −27,74 | 6 | −14,29 | ||||
| 2025-07-21 | 13F | Fortis Capital Advisors, LLC | 20 000 | 0,00 | 1 148 | 10,49 | ||||
| 2025-08-14 | 13F | IHT Wealth Management, LLC | 20 070 | 8,70 | 1 152 | 20,13 | ||||
| 2025-08-14 | 13F | UBS Group AG | 147 075 | 17,72 | 8 445 | 30,02 | ||||
| 2025-08-15 | 13F | Equitable Holdings, Inc. | 291 794 | 61,17 | 16 755 | 78,01 | ||||
| 2025-07-08 | 13F | Arlington Trust Co LLC | 565 | 0,00 | 32 | 10,34 | ||||
| 2025-08-13 | 13F | Vertex Planning Partners, LLC | 6 280 | 6,51 | 361 | 17,65 | ||||
| 2025-08-14 | 13F | Goldman Sachs Group Inc | 0 | −100,00 | 0 | |||||
| 2025-08-27 | 13F/A | Brinker Capital Investments, LLC | 4 890 | −2,65 | 281 | 7,28 | ||||
| 2025-07-14 | 13F | Sentinel Pension Advisors Inc | 3 805 | 218 | ||||||
| 2025-07-15 | 13F | Colonial River Wealth Management, LLC | 9 976 | 51,40 | 579 | 69,01 | ||||
| 2025-08-12 | 13F | Proequities, Inc. | 0 | 0 | ||||||
| 2025-07-15 | 13F | Verum Partners LLC | 66 905 | 1,29 | 3 842 | 11,85 | ||||
| 2025-08-13 | 13F | Continuum Advisory, LLC | 0 | −100,00 | 0 | |||||
| 2025-08-14 | 13F | Vident Advisory, LLC | 3 897 | 0,00 | 224 | 10,40 | ||||
| 2025-05-13 | 13F | EverSource Wealth Advisors, LLC | 0 | −100,00 | 0 | |||||
| 2025-07-30 | 13F | Drive Wealth Management, Llc | 28 278 | 2,94 | 1 624 | 13,66 | ||||
| 2025-07-14 | 13F | Signature Securities Group Corporation | 21 291 | 1,84 | 1 223 | 12,52 | ||||
| 2025-08-06 | 13F | Modera Wealth Management, LLC | 4 753 | 0,00 | 273 | 10,12 | ||||
| 2025-08-28 | NP | AIM GROWTH SERIES (INVESCO GROWTH SERIES) - Invesco Oppenheimer Portfolio Series: Conservative Investor Fund Class R6 | 68 216 | 33,10 | 3 917 | 47,00 | ||||
| 2025-08-13 | 13F | Lido Advisors, LLC | 10 594 | −12,19 | 608 | −3,03 | ||||
| 2025-07-28 | 13F | Arlington Financial Advisors, LLC | 232 516 | 6,97 | 13 351 | 18,15 | ||||
| 2025-08-06 | 13F | Savant Capital, LLC | 16 400 | 5,01 | 942 | 16,03 | ||||
| 2025-07-24 | 13F | Robertson Stephens Wealth Management, LLC | 0 | −100,00 | 0 | |||||
| 2025-08-06 | 13F | Atlantic Union Bankshares Corp | 113 | 6 | ||||||
| 2025-07-25 | NP | USBSX - Cornerstone Moderate Fund | 322 043 | −4,13 | 18 146 | 4,85 | ||||
| 2025-07-29 | 13F | Private Trust Co Na | 700 | 0,00 | 40 | 11,11 | ||||
| 2025-05-14 | 13F | Venture Visionary Partners LLC | 0 | −100,00 | 0 | |||||
| 2025-07-16 | 13F | Kathmere Capital Management, LLC | 20 290 | −8,55 | 1 165 | 1,04 | ||||
| 2025-07-29 | 13F | Cidel Asset Management Inc | 31 072 | −0,14 | 1 784 | 10,33 | ||||
| 2025-08-13 | 13F | Flow Traders U.s. Llc | 0 | −100,00 | 0 | |||||
| 2025-07-15 | 13F | Mather Group, Llc. | 10 897 | −7,52 | 626 | 2,12 | ||||
| 2025-08-08 | 13F | Security Financial Services, INC. | 10 496 | 63,34 | 603 | 80,24 | ||||
| 2025-07-08 | 13F | Lowe Wealth Advisors, LLC | 19 174 | 8,43 | 1 101 | 19,70 | ||||
| 2025-08-08 | 13F | Crossmark Global Holdings, Inc. | 3 502 | 201 | ||||||
| 2025-08-27 | NP | ALAAX - INVESCO Income Allocation Fund Class A | 307 673 | −9,72 | 17 667 | −0,29 | ||||
| 2025-08-14 | 13F | Qube Research & Technologies Ltd | 3 015 | 728,30 | 173 | 861,11 | ||||
| 2025-05-15 | 13F/A | Orion Portfolio Solutions, LLC | 5 023 | −23,34 | 261 | −16,61 | ||||
| 2025-07-22 | 13F | Belpointe Asset Management LLC | 20 000 | 0,00 | 1 148 | 10,49 | ||||
| 2025-07-18 | 13F | Bartlett & Co. Wealth Management Llc | 165 | 0,00 | 9 | 12,50 | ||||
| 2025-07-07 | 13F | Centurion Wealth Management LLC | 56 530 | 55,61 | 3 246 | 86,60 | ||||
| 2025-07-14 | 13F | Farmers & Merchants Investments Inc | 0 | −100,00 | 0 | |||||
| 2025-07-24 | 13F | McKinley Carter Wealth Services, Inc. | 4 498 | 258 | ||||||
| 2025-08-14 | 13F | Raymond James Financial Inc | 10 535 | −9,53 | 605 | −0,17 | ||||
| 2025-07-31 | 13F | AlTi Global, Inc. | 0 | −100,00 | 0 | |||||
| 2025-08-04 | 13F | Assetmark, Inc | 1 229 | 71 | ||||||
| 2025-08-13 | 13F | Cresset Asset Management, LLC | 5 761 | 0,00 | 331 | 10,37 | ||||
| 2025-07-10 | 13F | Wealth Enhancement Advisory Services, Llc | 74 861 | 0,16 | 4 331 | 11,48 | ||||
| 2025-08-08 | 13F | Capital Investment Advisory Services, LLC | 368 | 0,00 | 21 | 10,53 | ||||
| 2025-08-01 | 13F | Chilton Capital Management Llc | 640 | 0,00 | 37 | 9,09 | ||||
| 2025-07-24 | 13F | Financial Connections Group, Inc. | 2 794 | 1,79 | 0 | |||||
| 2025-08-19 | 13F | Newbridge Financial Services Group, Inc. | 770 | 44 | ||||||
| 2025-05-12 | 13F | Sandy Spring Bank | 113 | −34,30 | 6 | −37,50 | ||||
| 2025-08-06 | 13F | Quadrant Private Wealth Management, LLC | 9 150 | 0,00 | 525 | 10,53 | ||||
| 2025-08-18 | 13F/A | National Bank Of Canada /fi/ | 82 | 0,00 | 5 | 0,00 | ||||
| 2025-08-07 | 13F | Proficio Capital Partners LLC | 1 768 322 | 1 858 | ||||||
| 2025-05-12 | 13F | Independent Advisor Alliance | 0 | −100,00 | 0 | |||||
| 2025-07-15 | 13F | RTD Financial Advisors, Inc. | 149 060 | −2,16 | 8 559 | 8,05 | ||||
| 2025-08-06 | 13F | Commonwealth Equity Services, Llc | 65 006 | −2,78 | 4 | 0,00 | ||||
| 2025-08-14 | 13F | Fmr Llc | 29 322 | 3,45 | 1 684 | 14,26 | ||||
| 2025-07-30 | 13F | Retirement Planning Group | 82 341 | −0,76 | 4 728 | 9,62 | ||||
| 2025-08-14 | 13F | Mml Investors Services, Llc | 21 117 | 2,90 | 1 | 0,00 | ||||
| 2025-08-14 | 13F | CoreCap Advisors, LLC | 4 283 | −1,02 | 246 | 9,38 | ||||
| 2025-08-12 | 13F | AlphaCore Capital LLC | 96 009 | 9 932,29 | 5 513 | 11 148,98 | ||||
| 2025-07-15 | 13F | MCF Advisors LLC | 675 | 0,00 | 39 | 8,57 | ||||
| 2025-07-17 | 13F | Johnson & White Wealth Management, LLC | 366 105 | 0,86 | 21 | 16,67 | ||||
| 2025-07-23 | 13F | Hardy Reed LLC | 10 346 | 0,00 | 594 | 10,61 | ||||
| 2025-07-08 | 13F | Parallel Advisors, LLC | 5 674 | 0,00 | 326 | 10,54 | ||||
| 2025-08-07 | 13F | Allworth Financial LP | 238 | 1,28 | 14 | 8,33 | ||||
| 2025-08-11 | 13F | Wealthspire Advisors, LLC | 38 439 | 0,00 | 2 207 | 10,46 | ||||
| 2025-08-08 | 13F | SBI Securities Co., Ltd. | 310 | 2,65 | 18 | 13,33 | ||||
| 2025-05-09 | 13F | Atria Wealth Solutions, Inc. | 0 | −100,00 | 0 | |||||
| 2025-07-16 | 13F | Maridea Wealth Management LLC | 4 712 | 271 | ||||||
| 2025-08-12 | 13F | Coldstream Capital Management Inc | 0 | −100,00 | 0 | |||||
| 2025-08-12 | 13F | Atlas Capital Advisors Llc | 23 628 | −0,56 | 1 357 | 9,80 | ||||
| 2025-07-16 | 13F | Signaturefd, Llc | 205 | 0,00 | 12 | 10,00 | ||||
| 2025-07-28 | 13F | Revolve Wealth Partners, LLC | 8 573 | 7,78 | 492 | 19,13 | ||||
| 2025-08-06 | 13F | AE Wealth Management LLC | 3 456 | 6,18 | 198 | 17,16 | ||||
| 2025-08-14 | 13F | GWM Advisors LLC | 502 | −79,02 | 29 | −77,42 | ||||
| 2025-08-05 | 13F | Bank of New York Mellon Corp | 845 228 | −3,08 | 48 533 | 7,04 | ||||
| 2025-08-06 | 13F | Atlas Legacy Advisors, LLC | 11 184 | 93,63 | 642 | 111,88 | ||||
| 2025-08-13 | 13F | Scotia Capital Inc. | 10 555 | 5,70 | 606 | 16,76 | ||||
| 2025-08-05 | 13F | Carolinas Wealth Consulting Llc | 0 | −100,00 | 0 | −100,00 | ||||
| 2025-08-14 | 13F | Snowden Capital Advisors LLC | 10 815 | −0,52 | 621 | 9,91 | ||||
| 2025-08-14 | 13F | Citadel Advisors Llc | 125 291 | 7 194 | ||||||
| 2025-08-12 | 13F | Steward Partners Investment Advisory, Llc | 83 | −80,96 | 5 | −81,82 | ||||
| 2025-07-15 | 13F | Foster Victor Wealth Advisors, LLC | 66 378 | −3,83 | 3 848 | 11,51 | ||||
| 2025-08-28 | NP | AADAX - INVESCO Growth Allocation Fund Class A | 624 071 | 5,04 | 35 834 | 16,02 | ||||
| 2025-08-12 | 13F | Financial Advocates Investment Management | 3 490 | −16,29 | 200 | −7,41 | ||||
| 2025-07-15 | 13F | Fifth Third Bancorp | 314 | −25,24 | 18 | −14,29 | ||||
| 2025-08-14 | 13F | Toronto Dominion Bank | 22 | −78,00 | 1 | −80,00 | ||||
| 2025-08-14 | 13F | EP Wealth Advisors, Inc. | 14 070 | −0,34 | 808 | 9,95 | ||||
| 2025-08-12 | 13F | MAI Capital Management | 8 041 | 0,00 | 462 | 10,29 | ||||
| 2025-08-13 | 13F | Northwestern Mutual Wealth Management Co | 146 563 | −4,16 | 8 416 | 5,85 | ||||
| 2025-08-14 | 13F | Colony Group, LLC | 9 633 | 553 | ||||||
| 2025-08-15 | 13F | Kestra Advisory Services, LLC | 9 160 | −0,52 | 526 | 9,83 | ||||
| 2025-08-04 | 13F | Spire Wealth Management | 11 711 | 381,74 | 245 | 94,44 | ||||
| 2025-08-14 | 13F | Bank Of America Corp /de/ | 883 792 | −3,73 | 50 747 | 6,33 | ||||
| 2025-08-14 | 13F | Mercer Global Advisors Inc /adv | 27 953 | 4,41 | 1 605 | 15,38 | ||||
| 2025-08-14 | 13F | Stifel Financial Corp | 44 741 | −3,83 | 2 569 | 6,24 | ||||
| 2025-07-25 | 13F | Sequoia Financial Advisors, LLC | 7 314 | 0,22 | 420 | 10,55 | ||||
| 2025-07-16 | 13F | Essex Financial Services, Inc. | 6 365 | 0,02 | 365 | 10,61 | ||||
| 2025-08-12 | 13F | Belmont Capital, LLC | 361 | 0,00 | 21 | 11,11 | ||||
| 2025-08-01 | 13F | Cedar Point Capital Partners, LLC | 36 006 | 4,71 | 2 067 | 15,67 | ||||
| 2025-08-14 | 13F | Mariner, LLC | 36 749 | 8,75 | 2 110 | 20,16 | ||||
| 2025-08-12 | 13F | LPL Financial LLC | 648 408 | 26,78 | 37 232 | 40,02 | ||||
| 2025-07-30 | 13F | Atlantic Edge Private Wealth Management, LLC | 105 | 0,00 | 6 | 20,00 | ||||
| 2025-08-14 | 13F | Ameriprise Financial Inc | 47 979 | −22,37 | 2 755 | −14,34 | ||||
| 2025-08-19 | 13F | Advisory Services Network, LLC | 7 804 | 447 | ||||||
| 2025-08-12 | 13F | Bokf, Na | 0 | −100,00 | 0 | |||||
| 2025-09-04 | 13F/A | Advisor Group Holdings, Inc. | 91 099 | 17,27 | 5 231 | 29,54 | ||||
| 2025-07-30 | 13F | Avidian Wealth Solutions, LLC | 5 694 | 327 | ||||||
| 2025-08-15 | 13F | Captrust Financial Advisors | 130 257 | 1,34 | 7 479 | 11,93 | ||||
| 2025-08-08 | 13F | Larson Financial Group LLC | 7 368 | 39,73 | 423 | 54,38 | ||||
| 2025-07-29 | 13F | Activest Wealth Management | 0 | 0 | ||||||
| 2025-07-25 | NP | UCAGX - Cornerstone Aggressive Fund | 43 991 | 0,00 | 2 479 | 9,36 | ||||
| 2025-08-14 | 13F | Greenline Partners, LLC | 0 | −100,00 | 0 | |||||
| 2025-07-24 | 13F | PDS Planning, Inc | 11 324 | 0,00 | 650 | 10,54 | ||||
| 2025-08-05 | 13F | Key FInancial Inc | 15 022 | 0,54 | 863 | 11,08 | ||||
| 2025-08-05 | 13F | Bank Of Montreal /can/ | 3 549 | 13,21 | 204 | 25,31 | ||||
| 2025-07-22 | 13F | Three Bridge Wealth Advisors, LLC | 62 360 | 158,32 | 3 581 | 185,26 | ||||
| 2025-08-14 | 13F | Susquehanna International Group, Llp | 4 516 | −93,81 | 259 | −93,17 | ||||
| 2025-04-29 | 13F | Callan Capital, LLC | 105 664 | −2,93 | 5 493 | 5,37 | ||||
| 2025-03-28 | 13F/A | Berkeley, Inc | 0 | −100,00 | 0 | −100,00 | ||||
| 2025-07-24 | 13F | Riverchase Wealth Management, Llc | 25 378 | 0,00 | 1 457 | 10,46 | ||||
| 2025-07-28 | 13F | Axxcess Wealth Management, Llc | 9 485 | 46,10 | 545 | 61,42 | ||||
| 2025-08-14 | 13F | CIBC World Markets Inc. | 5 330 | −3,62 | 306 | 6,62 | ||||
| 2025-08-15 | 13F | Tower Research Capital LLC (TRC) | 4 | −20,00 | 0 | |||||
| 2025-08-13 | 13F | Invesco Ltd. | 4 588 907 | 2,93 | 263 495 | 13,68 | ||||
| 2025-08-12 | 13F | O'shaughnessy Asset Management, Llc | 9 130 | −13,80 | 524 | −4,73 | ||||
| 2025-05-14 | 13F | Brown Brothers Harriman & Co | 0 | −100,00 | 0 | |||||
| 2025-08-06 | 13F | Maltin Wealth Management, Inc. | 85 820 | 4 928 | ||||||
| 2025-08-08 | 13F | Austin Wealth Management, LLC | 3 869 | 0,00 | 222 | 7,80 | ||||
| 2025-08-11 | 13F | HighTower Advisors, LLC | 84 261 | −5,90 | 4 838 | 3,93 | ||||
| 2025-08-08 | 13F | Cetera Investment Advisers | 171 590 | 2,65 | 9 853 | 13,37 | ||||
| 2025-07-25 | NP | USCRX - Cornerstone Moderately Aggressive Fund | 653 206 | 0,00 | 36 805 | 9,36 | ||||
| 2025-05-06 | 13F | Kathleen S. Wright Associates Inc. | 0 | −100,00 | 0 | |||||
| 2025-08-12 | 13F | Charles Schwab Investment Management Inc | 11 861 260 | 1,38 | 681 074 | 11,97 | ||||
| 2025-08-13 | 13F | Victory Capital Management Inc | 979 947 | −8,27 | 56 269 | 1,31 | ||||
| 2025-08-08 | 13F | WASHINGTON TRUST Co | 0 | −100,00 | 0 | |||||
| 2025-07-25 | NP | UCMCX - Cornerstone Moderately Conservative Fund | 35 176 | 0,00 | 1 982 | 9,33 | ||||
| 2025-08-07 | 13F | Rollins Financial Advisors, LLC | 3 837 | 220 | ||||||
| 2025-08-11 | 13F | Vanguard Group Inc | 16 062 | 1,81 | 922 | 12,44 | ||||
| 2025-08-14 | 13F | Glenmede Investment Management, LP | 65 345 | 3 752 | ||||||
| 2025-07-07 | 13F | Versant Capital Management, Inc | 1 294 | 161,94 | 74 | 196,00 | ||||
| 2025-08-05 | 13F | Huntington National Bank | 88 | 11,39 | ||||||
| 2025-07-30 | 13F | Crewe Advisors LLC | 1 841 | 10,31 | 106 | 22,09 | ||||
| 2025-07-16 | 13F | Prairiewood Capital, LLC | 12 206 | −9,79 | 701 | −0,43 | ||||
| 2025-07-22 | 13F | Red Tortoise LLC | 39 595 | 0,80 | 2 274 | 11,31 | ||||
| 2025-08-05 | 13F | Tiaa Trust, National Association | 4 215 | 0,00 | 242 | 10,05 | ||||
| 2025-07-09 | 13F | Breakwater Capital Group | 76 931 | 0,87 | 4 417 | 11,40 | ||||
| 2025-07-24 | 13F | Us Bancorp \de\ | 63 489 | −4,64 | 3 646 | 5,32 | ||||
| 2025-07-31 | 13F | Harbour Investment Management Llc | 7 887 | 0,00 | 453 | 10,24 | ||||
| 2025-08-18 | 13F | Geneos Wealth Management Inc. | 6 314 | −15,00 | 363 | −6,22 |