Grundläggande statistik
| Institutionella ägare | 229 total, 229 long only, 0 short only, 0 long/short - change of 5,50% MRQ |
| Genomsnittlig portföljallokering | 0.1432 % - change of −10,68% MRQ |
| Institutionella aktier (lång) | 4 530 109 (ex 13D/G) - change of 0,25MM shares 5,93% MRQ |
| Institutionellt värde (lång) | $ 534 648 USD ($1000) |
Institutionellt ägande och aktieägare
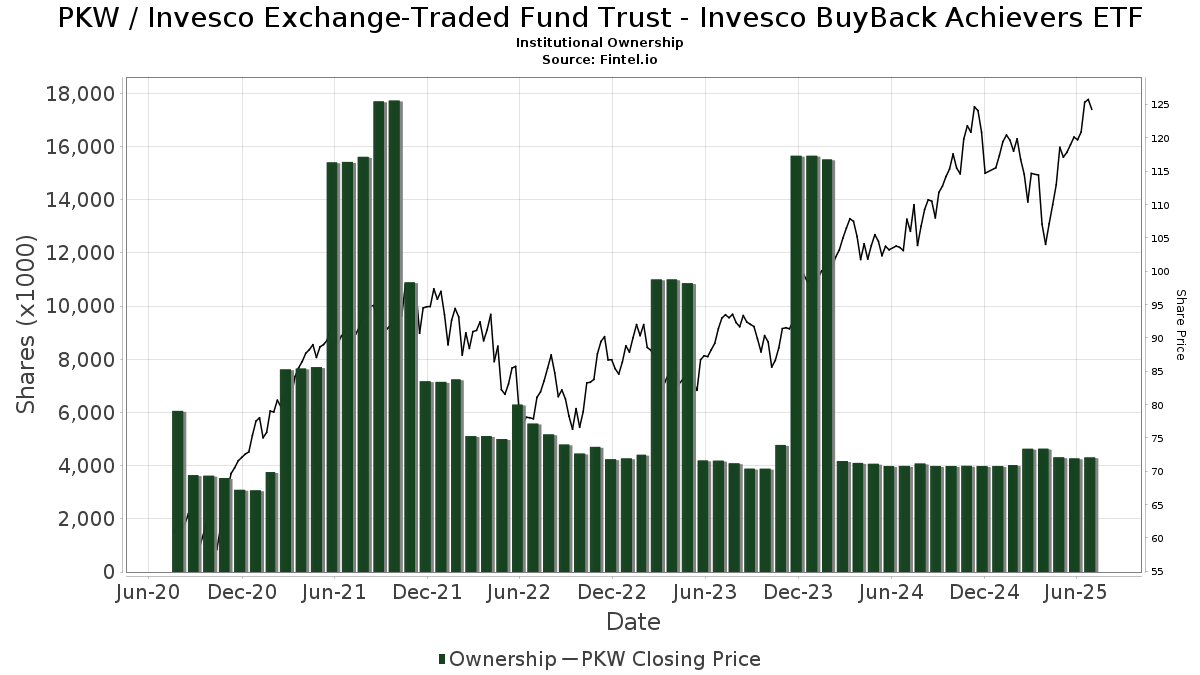
Invesco Exchange-Traded Fund Trust - Invesco BuyBack Achievers ETF (US:PKW) har 229 Institutionella ägare och aktieägare som har lämnat in 13D/G- eller 13F-formulär till Securities Exchange Commission (SEC). Dessa institut innehar totalt 4,530,109 aktier. Största aktieägare inkluderar Bank Of America Corp /de/, LPL Financial LLC, Wells Fargo & Company/mn, Morgan Stanley, Raymond James Financial Inc, UBS Group AG, Mariner, LLC, Pacific Wealth Strategies Group, Inc., Curtis Advisory Group, LLC, and Cambridge Investment Research Advisors, Inc. .
Invesco Exchange-Traded Fund Trust - Invesco BuyBack Achievers ETF (NasdaqGM:PKW) Institutionell ägarstruktur visar institutioners och fonders nuvarande positioner i företaget, samt de senaste förändringarna i positionernas storlek. Större aktieägare kan vara enskilda investerare, fonder, hedgefonder eller institutioner. Bilaga 13D visar att investeraren äger (eller ägde) mer än 5% av företaget och avser (eller avsåg) att aktivt eftersträva en förändring av affärsstrategin. Schedule 13G indikerar en passiv investering på över 5%.
The share price as of September 12, 2025 is 131,97 / share. Previously, on September 13, 2024, the share price was 110,34 / share. This represents an increase of 19,60% over that period.
Fondsentimentets poäng
Fondsentimentet poängen(fka Ägarackumulation-poäng) visar vilka aktier som är mest köpta av fonder. Det är resultatet av en sofistikerad kvantitativ flerfaktormodell som identifierar företag med de högsta nivåerna av institutionell ackumulering. Poängsättningsmodellen använder en kombination av den totala ökningen av redovisade ägare, förändringarna i portföljallokeringarna för dessa ägare och andra mått. Siffran sträcker sig från 0 till 100, där högre siffror indikerar en högre nivå av ackumulering i förhållande till sina konkurrenter, och 50 är genomsnittet.
Uppdateringsfrekvens: Dagligen
Se Ownership Explorer, som innehåller en lista över de högst rankade företagen.
Institutionell sälj/köp-kvot
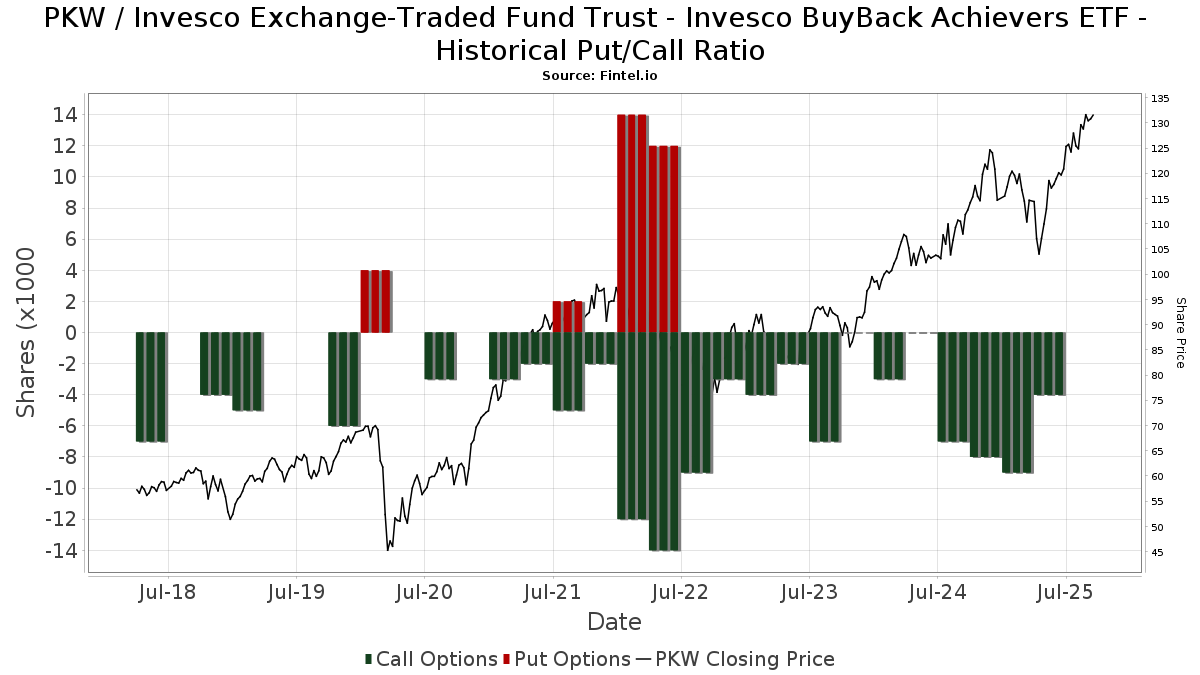
Förutom att rapportera vanliga eget kapital- och skuldemissioner måste institutioner med mer än 100MM tillgångar under förvaltning också avslöja sina innehav av sälj- och köpoptioner. Eftersom säljoptioner i allmänhet indikerar ett negativt sentiment och köpoptioner indikerar ett positivt sentiment, kan vi få en uppfattning om det övergripande institutionella sentimentet genom att plotta förhållandet mellan säljoptioner och köpoptioner. Diagrammet till höger visar det historiska förhållandet mellan sälj- och köpoptioner för detta instrument.
Genom att använda sälj/köp-kvoten som en indikator på aktieägarnas sentiment undviker man en av de största bristerna med att använda det totala institutionella ägandet, nämligen att en betydande del av de förvaltade tillgångarna investeras passivt för att följa index. Passivt förvaltade fonder köper vanligtvis inte optioner, så indikatorn för sälj/köp-kvoten ger en bättre bild av stämningen i aktivt förvaltade fonder.
13F- och NPORT-arkiveringar
Detaljer om 13F-arkiveringar är gratis. Detaljer om NP-arkiveringar kräver ett premiummedlemskap. Gröna rader indikerar nya positioner. Röda rader indikerar stängda positioner. Klicka på länk symbolen för att se hela transaktionshistoriken.
Uppgradera
för att låsa upp premiumdata och exportera till Excel ![]() .
.
| Fil Datum | Källa | Investerare | Typ | Genomsnittligt pris (beräknat) |
Aktier | Δ Aktier (%) |
Rapporterat värde (1000 USD) |
Δ Värde (%) |
Portföljallokering (%) |
|
|---|---|---|---|---|---|---|---|---|---|---|
| 2025-08-05 | 13F | Pacific Wealth Strategies Group, Inc. | 81 647 | −28,86 | 10 203 | −21,10 | ||||
| 2025-08-11 | 13F | Aptus Capital Advisors, LLC | 100 | 0,00 | 12 | 9,09 | ||||
| 2025-08-13 | 13F | EverSource Wealth Advisors, LLC | 100 | 0,00 | 12 | 9,09 | ||||
| 2025-05-08 | 13F | 360 Financial, Inc. | 0 | −100,00 | 0 | −100,00 | ||||
| 2025-08-14 | 13F | First Manhattan Co | 2 900 | 0,00 | 358 | 9,82 | ||||
| 2025-07-23 | 13F | Prime Capital Investment Advisors, LLC | 45 686 | 0,81 | 5 647 | 10,60 | ||||
| 2025-08-18 | 13F/A | National Bank Of Canada /fi/ | 5 035 | 8,75 | 622 | 19,19 | ||||
| 2025-08-15 | 13F | Kestra Advisory Services, LLC | 29 840 | 115,78 | 3 688 | 136,71 | ||||
| 2025-08-08 | 13F | Cetera Investment Advisers | 27 498 | −2,37 | 3 399 | 7,09 | ||||
| 2025-07-21 | 13F | Ameritas Advisory Services, LLC | 933 | 115 | ||||||
| 2025-08-08 | 13F | Collaborative Wealth Managment Inc. | 7 474 | 0,00 | 924 | 9,62 | ||||
| 2025-08-05 | 13F | GHP Investment Advisors, Inc. | 25 925 | −4,01 | 3 204 | 5,29 | ||||
| 2025-08-06 | 13F | Miller Investment Management, LP | 2 675 | 0,00 | 331 | 9,63 | ||||
| 2025-08-07 | 13F | Runnymede Capital Advisors, Inc. | 2 340 | 0,00 | 289 | 9,89 | ||||
| 2025-08-11 | 13F | HighTower Advisors, LLC | 20 226 | 0,09 | 2 500 | 9,80 | ||||
| 2025-08-14 | 13F | Wiley Bros.-aintree Capital, Llc | 5 786 | 0,24 | 715 | 10,68 | ||||
| 2025-07-25 | 13F | Means Investment Co., Inc. | 3 233 | 0,06 | 400 | 9,62 | ||||
| 2025-08-15 | 13F | CI Private Wealth, LLC | 1 897 | 235 | ||||||
| 2025-04-29 | 13F | Hm Payson & Co | 125 | 0,00 | 14 | 0,00 | ||||
| 2025-08-12 | 13F | O'shaughnessy Asset Management, Llc | 223 | −67,35 | 28 | −64,47 | ||||
| 2025-07-24 | 13F | Blair William & Co/il | 677 | −22,81 | 84 | −15,31 | ||||
| 2025-07-29 | 13F | Elevation Capital Advisory, LLC | 14 033 | 142,24 | 1 734 | 165,95 | ||||
| 2025-08-14 | 13F | Abound Financial, Llc | 1 980 | 0,00 | 245 | 9,42 | ||||
| 2025-07-22 | 13F | Wealthcare Advisory Partners LLC | 4 188 | 9,83 | 518 | 20,51 | ||||
| 2025-08-12 | 13F | Archer Investment Corp | 3 312 | 0,00 | 409 | 9,65 | ||||
| 2025-07-11 | 13F | Farther Finance Advisors, LLC | 7 162 | 9,51 | 885 | 19,59 | ||||
| 2025-07-25 | 13F | Cwm, Llc | 5 716 | 24,07 | 1 | |||||
| 2025-08-15 | 13F | Equitable Holdings, Inc. | 52 875 | 14,35 | 6 535 | 25,46 | ||||
| 2025-05-02 | 13F | Wealthfront Advisers Llc | 0 | −100,00 | 0 | −100,00 | ||||
| 2025-08-11 | 13F | Madison Asset Management, LLC | 16 969 | −3,35 | 2 097 | 6,02 | ||||
| 2025-04-29 | 13F | Element Wealth, LLC | 0 | −100,00 | 0 | |||||
| 2025-08-13 | 13F | Providence Capital Advisors, LLC | 200 | 25 | ||||||
| 2025-08-12 | 13F | Jpmorgan Chase & Co | 32 289 | 1,23 | 3 991 | 11,05 | ||||
| 2025-05-06 | 13F | Venturi Wealth Management, LLC | 0 | −100,00 | 0 | |||||
| 2025-08-08 | 13F | Fortis Group Advisors, LLC | 19 647 | 2 455 | ||||||
| 2025-08-11 | 13F | Citigroup Inc | 12 420 | 5,50 | 1 535 | 15,76 | ||||
| 2025-08-18 | 13F | Hershey Financial Advisers, LLC | 0 | −100,00 | 0 | |||||
| 2025-08-13 | 13F | Northwestern Mutual Wealth Management Co | 65 199 | 130,31 | 8 059 | 152,68 | ||||
| 2025-08-08 | 13F | Pnc Financial Services Group, Inc. | 3 993 | 0,03 | 494 | 9,80 | ||||
| 2025-08-14 | 13F | D. E. Shaw & Co., Inc. | 2 140 | 0,00 | 265 | 9,54 | ||||
| 2025-08-06 | 13F | Paladin Advisory Group, LLC | 45 | 6 | ||||||
| 2025-08-14 | 13F | Bank Of America Corp /de/ | 780 882 | 2,11 | 96 517 | 12,02 | ||||
| 2025-08-12 | 13F | J.w. Cole Advisors, Inc. | 17 746 | −5,41 | 2 193 | 3,79 | ||||
| 2025-08-01 | 13F | Envestnet Asset Management Inc | 61 019 | −8,57 | 7 542 | 0,29 | ||||
| 2025-07-22 | 13F | Merit Financial Group, LLC | 3 702 | −30,07 | 458 | −23,32 | ||||
| 2025-07-24 | 13F | IFP Advisors, Inc | 190 | 0,00 | 23 | 9,52 | ||||
| 2025-08-01 | 13F | Rossby Financial, LCC | 104 | 0,00 | 13 | 9,09 | ||||
| 2025-08-13 | 13F | M&t Bank Corp | 3 250 | 0,00 | 402 | 9,56 | ||||
| 2025-07-09 | 13F | Dynamic Advisor Solutions LLC | 1 688 | 209 | ||||||
| 2025-08-12 | 13F | Proequities, Inc. | 0 | 0 | ||||||
| 2025-05-15 | 13F | JDM Financial Group LLC | 0 | −100,00 | 0 | |||||
| 2025-04-15 | 13F | Noble Wealth Management PBC | 465 | 0,00 | 52 | −1,89 | ||||
| 2025-08-04 | 13F | Creekmur Asset Management LLC | 0 | −100,00 | 0 | |||||
| 2025-07-10 | 13F | Banque de Luxembourg S.A. | 12 793 | 0,00 | 1 441 | 0,00 | ||||
| 2025-05-01 | 13F | Lane & Associates LLC | 4 500 | −2,89 | 507 | −8,83 | ||||
| 2025-07-15 | 13F | Capstone Wealth Management Group LLC | 4 064 | 27,36 | 502 | 39,83 | ||||
| 2025-07-30 | 13F | Caliber Wealth Management, LLC / KS | 6 461 | 0,29 | 799 | 10,07 | ||||
| 2025-08-14 | 13F | Susquehanna International Group, Llp | 0 | −100,00 | 0 | |||||
| 2025-08-11 | 13F | Principal Securities, Inc. | 4 361 | 1,61 | 539 | 8,91 | ||||
| 2025-05-08 | 13F | Arkadios Wealth Advisors | 0 | −100,00 | 0 | |||||
| 2025-08-11 | 13F | Tidemark, LLC | 2 382 | 0,04 | 294 | 9,70 | ||||
| 2025-07-21 | 13F | Empirical Financial Services, LLC d.b.a. Empirical Wealth Management | 2 500 | 0,00 | 309 | 9,96 | ||||
| 2025-07-10 | 13F | Sovran Advisors, LLC | 46 046 | 92,19 | 5 782 | 129,72 | ||||
| 2025-08-14 | 13F | Quantinno Capital Management LP | 3 310 | −3,10 | 409 | 6,51 | ||||
| 2025-07-17 | 13F | Investment Research & Advisory Group, Inc. | 50 | 0,00 | 6 | 20,00 | ||||
| 2025-08-05 | 13F | American Institute for Advanced Investment Management, LLP | 2 900 | 0,00 | 358 | 9,82 | ||||
| 2025-07-21 | 13F | Mendota Financial Group, LLC | 512 | 0,00 | 63 | 10,53 | ||||
| 2025-08-14 | 13F/A | Barclays Plc | 336 | 0,00 | 0 | |||||
| 2025-07-24 | 13F | Ronald Blue Trust, Inc. | 1 | 0,00 | 0 | |||||
| 2025-08-08 | 13F | Creative Planning | 14 464 | 32,66 | 1 788 | 45,52 | ||||
| 2025-08-14 | 13F | Comerica Bank | 1 324 | 0,00 | 164 | 9,40 | ||||
| 2025-09-04 | 13F/A | Advisor Group Holdings, Inc. | 45 702 | 23,95 | 5 651 | 35,98 | ||||
| 2025-08-14 | 13F | Federation des caisses Desjardins du Quebec | 5 145 | −7,30 | 636 | 1,60 | ||||
| 2025-08-11 | 13F | TD Waterhouse Canada Inc. | 350 | 0,00 | 44 | 10,26 | ||||
| 2025-08-06 | 13F | Prospera Financial Services Inc | 3 075 | −2,63 | 380 | 7,04 | ||||
| 2025-08-15 | 13F | Morgan Stanley | 313 723 | −1,02 | 38 776 | 8,58 | ||||
| 2025-08-18 | 13F | Tyler-Stone Wealth Management | 2 655 | −2,07 | 328 | 7,54 | ||||
| 2025-07-16 | 13F | Novem Group | 1 858 | 0,32 | 230 | 10,10 | ||||
| 2025-07-23 | 13F | BankPlus Trust Department | 10 947 | −3,04 | 1 353 | 6,45 | ||||
| 2025-07-25 | 13F | Lion Street Advisors, LLC | 1 675 | 207 | ||||||
| 2025-07-10 | 13F | NorthCrest Asset Manangement, LLC | 13 197 | 1,70 | 1 665 | 13,89 | ||||
| 2025-08-06 | 13F | Stokes Family Office, LLC | 3 805 | 0,00 | 470 | 9,81 | ||||
| 2025-08-08 | 13F | Thoroughbred Financial Services, Llc | 32 978 | 61,30 | 4 | 100,00 | ||||
| 2025-08-14 | 13F | UBS Group AG | 123 355 | 14,17 | 15 247 | 25,24 | ||||
| 2025-07-07 | 13F | First Community Trust Na | 110 | 0,00 | 14 | 8,33 | ||||
| 2025-08-12 | 13F | CIBC Private Wealth Group, LLC | 2 656 | 0,00 | 328 | 25,67 | ||||
| 2025-07-08 | 13F | Nbc Securities, Inc. | 2 171 | 0,00 | 0 | |||||
| 2025-08-08 | 13F | Larson Financial Group LLC | 300 | 0,00 | 37 | 12,12 | ||||
| 2025-08-08 | 13F | Gts Securities Llc | 4 097 | 506 | ||||||
| 2025-08-14 | 13F | GWM Advisors LLC | 28 115 | 16,35 | 3 475 | 27,63 | ||||
| 2025-05-15 | 13F | National Wealth Management Group, LLC | 0 | −100,00 | 0 | |||||
| 2025-08-06 | 13F | Ethos Financial Group, LLC | 3 149 | 0,00 | 389 | 9,89 | ||||
| 2025-07-18 | 13F | Trust Co Of Vermont | 1 751 | 0,00 | 216 | 9,64 | ||||
| 2025-08-14 | 13F | Clark Capital Management Group, Inc. | 1 842 | 0,00 | 228 | 9,66 | ||||
| 2025-08-07 | 13F | Curtis Advisory Group, LLC | 78 201 | 0,57 | 9 666 | 10,33 | ||||
| 2025-08-05 | 13F | Tsfg, Llc | 7 002 | 0,01 | 1 | |||||
| 2025-08-07 | 13F | PFG Advisors | 4 250 | 0,00 | 525 | 9,83 | ||||
| 2025-07-29 | 13F | Private Trust Co Na | 1 101 | 0,00 | 136 | 9,68 | ||||
| 2025-08-13 | 13F | Luminist Capital LLC | 521 | 0,00 | 65 | 12,07 | ||||
| 2025-07-07 | 13F | Bangor Savings Bank | 765 | 95 | ||||||
| 2025-08-12 | 13F | Cornerstone Wealth Management, LLC | 12 661 | 7,78 | 1 565 | 18,22 | ||||
| 2025-08-14 | 13F | Mercer Global Advisors Inc /adv | 3 373 | −1,00 | 417 | 8,62 | ||||
| 2025-08-12 | 13F | Steward Partners Investment Advisory, Llc | 21 148 | 16,67 | 2 614 | 27,96 | ||||
| 2025-07-28 | 13F | Triton Wealth Management, PLLC | 8 267 | 227,02 | 1 048 | 247,02 | ||||
| 2025-08-07 | 13F | Cahill Financial Advisors Inc | 48 753 | 0,18 | 6 026 | 9,91 | ||||
| 2025-08-14 | 13F | Warren Averett Asset Management, LLC | 45 256 | −1,12 | 5 594 | 8,48 | ||||
| 2025-07-31 | 13F | Carnegie Capital Asset Management, LLC | 15 232 | 0,73 | 1 883 | 24,47 | ||||
| 2025-08-13 | 13F | Jones Financial Companies Lllp | 15 782 | 33,76 | 1 944 | 47,09 | ||||
| 2025-08-13 | 13F | Gator Capital Management, LLC | 8 156 | 0,00 | 1 008 | 9,80 | ||||
| 2025-08-19 | 13F | Asset Dedication, LLC | 3 982 | 0,00 | 492 | 9,82 | ||||
| 2025-08-06 | 13F | First Horizon Advisors, Inc. | 193 | 24 | ||||||
| 2025-07-21 | 13F | Creative Capital Management Investments LLC | 288 | 0,00 | 36 | 9,38 | ||||
| 2025-08-12 | 13F | Calton & Associates, Inc. | 6 525 | −0,55 | 806 | 9,07 | ||||
| 2025-08-06 | 13F | Savant Capital, LLC | 1 709 | 211 | ||||||
| 2025-07-17 | 13F | Sound Income Strategies, LLC | 813 | 0,00 | 100 | 9,89 | ||||
| 2025-07-16 | 13F | RWM Asset Management, LLC | 9 092 | −2,39 | 1 124 | 7,05 | ||||
| 2025-07-21 | 13F | DHJJ Financial Advisors, Ltd. | 4 | 0,00 | 0 | |||||
| 2025-08-27 | 13F/A | Brinker Capital Investments, LLC | 1 695 | 209 | ||||||
| 2025-07-28 | 13F | Smart Portfolios, LLC | 18 573 | −2,89 | 2 296 | 6,55 | ||||
| 2025-08-08 | 13F | Avantax Advisory Services, Inc. | 6 623 | 28,25 | 819 | 40,79 | ||||
| 2025-07-23 | 13F | Avantra Family Wealth, Inc. | 3 065 | −1,70 | 379 | 7,69 | ||||
| 2025-07-18 | 13F | Truist Financial Corp | 66 750 | −7,71 | 8 250 | 1,25 | ||||
| 2025-08-15 | 13F | WFA of San Diego, LLC | 32 | 0,00 | 4 | 0,00 | ||||
| 2025-08-13 | 13F | Measured Wealth Private Client Group, LLC | 2 691 | 0,00 | 333 | 9,57 | ||||
| 2025-07-29 | 13F | Koshinski Asset Management, Inc. | 61 360 | 5,49 | 7 584 | 15,73 | ||||
| 2025-08-14 | 13F | AllSquare Wealth Management LLC | 7 991 | −1,10 | 988 | 8,46 | ||||
| 2025-08-14 | 13F | Integrated Wealth Concepts LLC | 5 339 | 28,71 | 660 | 41,11 | ||||
| 2025-07-14 | 13F | S.A. Mason LLC | 6 841 | 0,00 | 846 | 9,74 | ||||
| 2025-08-11 | 13F | Regal Investment Advisors LLC | 3 168 | 10,23 | 392 | 21,05 | ||||
| 2025-05-02 | 13F | Hudock, Inc. | 0 | −100,00 | 0 | |||||
| 2025-08-15 | 13F | Tower Research Capital LLC (TRC) | 0 | −100,00 | 0 | |||||
| 2025-08-06 | 13F | Atlantic Union Bankshares Corp | 1 534 | 190 | ||||||
| 2025-04-29 | 13F | Lee Danner & Bass Inc | 0 | −100,00 | 0 | |||||
| 2025-08-06 | 13F | Aspect Partners, LLC | 2 098 | 0,33 | 259 | 10,21 | ||||
| 2025-08-04 | 13F | Assetmark, Inc | 488 | 72,44 | 60 | 93,55 | ||||
| 2025-07-30 | 13F | Pacific Sun Financial Corp | 15 486 | 1,25 | 1 914 | 11,09 | ||||
| 2025-08-13 | 13F | Summit Financial, LLC | 8 622 | 1 066 | ||||||
| 2025-08-12 | 13F | BlackRock, Inc. | 620 | 24,00 | 77 | 35,71 | ||||
| 2025-07-10 | 13F | Wealth Enhancement Advisory Services, Llc | 40 663 | 3,34 | 5 129 | 15,68 | ||||
| 2025-07-10 | 13F | Kozak & Associates, Inc. | 60 | 1,69 | 7 | 16,67 | ||||
| 2025-07-15 | 13F | BigSur Wealth Management LLC | 4 900 | 0,00 | 606 | 9,60 | ||||
| 2025-08-14 | 13F | Qube Research & Technologies Ltd | 146 | 0,00 | 18 | 12,50 | ||||
| 2025-08-07 | 13F | Addison Advisors LLC | 264 | 0,00 | 33 | 10,34 | ||||
| 2025-07-29 | 13F | Dale Q Rice Investment Management Ltd | 0 | −100,00 | 0 | |||||
| 2025-08-08 | 13F | Capital Investment Advisory Services, LLC | 5 606 | −2,04 | 693 | 7,45 | ||||
| 2025-05-12 | 13F | Sandy Spring Bank | 1 534 | 0,00 | 173 | −2,27 | ||||
| 2025-04-28 | 13F | D.a. Davidson & Co. | 0 | −100,00 | 0 | |||||
| 2025-05-01 | 13F | Financial Security Advisor, Inc. | 0 | −100,00 | 0 | |||||
| 2025-05-02 | 13F | Leelyn Smith, LLC | 0 | −100,00 | 0 | |||||
| 2025-07-22 | 13F | Gsa Capital Partners Llp | 0 | −100,00 | 0 | |||||
| 2025-08-04 | 13F | Creative Financial Designs Inc /adv | 758 | 0,13 | 94 | 9,41 | ||||
| 2025-07-25 | 13F | 1858 Wealth Management, Llc | 2 295 | 0,00 | 284 | 9,69 | ||||
| 2025-07-02 | 13F | Capital Market Strategies LLC | 2 976 | 0,00 | 368 | 9,55 | ||||
| 2025-08-14 | 13F | Kovitz Investment Group Partners, LLC | 14 305 | −0,08 | 1 768 | 9,68 | ||||
| 2025-08-04 | 13F | Flagship Harbor Advisors, Llc | 19 011 | −4,78 | 2 350 | 4,45 | ||||
| 2025-08-13 | 13F | Lido Advisors, LLC | 0 | −100,00 | 0 | |||||
| 2025-07-22 | 13F | Belpointe Asset Management LLC | 9 410 | −0,64 | 1 163 | 9,00 | ||||
| 2025-05-02 | 13F | Private Wealth Management Group, LLC | 0 | −100,00 | 0 | |||||
| 2025-08-13 | 13F | Millstone Evans Group, LLC | 420 | 0,00 | 52 | 8,51 | ||||
| 2025-05-14 | 13F | One Capital Management, LLC | 0 | −100,00 | 0 | |||||
| 2025-07-30 | 13F | Wbh Advisory Inc | 3 189 | 0,00 | 394 | 9,75 | ||||
| 2025-08-11 | 13F | Private Advisor Group, LLC | 30 072 | 1,41 | 3 717 | 11,26 | ||||
| 2025-08-08 | 13F | Foundations Investment Advisors, LLC | 3 232 | 399 | ||||||
| 2025-08-14 | 13F | Modern Wealth Management, LLC | 3 487 | −7,53 | 431 | 1,65 | ||||
| 2025-07-15 | 13F | Optima Capital Llc | 4 941 | 0,61 | 611 | 10,31 | ||||
| 2025-08-06 | 13F | AE Wealth Management LLC | 16 | 2 | ||||||
| 2025-07-14 | 13F | AdvisorNet Financial, Inc | 37 | 0,00 | 5 | 0,00 | ||||
| 2025-07-30 | 13F | Whittier Trust Co Of Nevada Inc | 9 600 | 0,00 | 1 187 | 9,71 | ||||
| 2025-08-12 | 13F | Global Retirement Partners, LLC | 567 | 0,00 | 70 | 7,69 | ||||
| 2025-08-05 | 13F | Mission Wealth Management, Lp | 2 000 | 0,00 | 247 | 9,78 | ||||
| 2025-08-18 | 13F | Geneos Wealth Management Inc. | 1 000 | 0,00 | 124 | 9,82 | ||||
| 2025-07-30 | 13F | Whittier Trust Co | 565 | 0,36 | 70 | 9,52 | ||||
| 2025-05-06 | 13F | Wedbush Securities Inc | 0 | −100,00 | 0 | |||||
| 2025-07-21 | 13F | Crews Bank & Trust | 400 | 0,00 | 49 | 8,89 | ||||
| 2025-08-14 | 13F | Jane Street Group, Llc | 2 292 | −38,09 | 283 | −32,13 | ||||
| 2025-07-28 | 13F | Holistic Planning, LLC | 10 589 | 3,23 | 1 309 | 13,25 | ||||
| 2025-08-05 | 13F | Sensible Money, LLC | 4 019 | 0,00 | 497 | 9,73 | ||||
| 2025-08-12 | 13F | Wealthbridge Capital Management, Llc | 8 706 | 16,02 | 1 076 | 27,34 | ||||
| 2025-07-31 | 13F | Cambridge Investment Research Advisors, Inc. | 68 399 | 55,85 | 8 | 100,00 | ||||
| 2025-08-06 | 13F | Hallmark Capital Management Inc | 0 | −100,00 | 0 | |||||
| 2025-07-31 | 13F | Resonant Capital Advisors, LLC | 63 960 | 0,00 | 7 905 | 9,70 | ||||
| 2025-05-16 | 13F | Coppell Advisory Solutions LLC | 0 | −100,00 | 0 | −100,00 | ||||
| 2025-07-09 | 13F | Key Client Fiduciary Advisors, LLC | 2 798 | 46,11 | 346 | 60,47 | ||||
| 2025-07-25 | 13F | Hazlett, Burt & Watson, Inc. | 6 277 | 2 441,30 | 1 | |||||
| 2025-07-09 | 13F | Aaron Wealth Advisors LLC | 2 238 | 277 | ||||||
| 2025-07-15 | 13F | Fifth Third Bancorp | 750 | 0,00 | 93 | 9,52 | ||||
| 2025-08-08 | 13F | Campbell Deegan Wealth Management, LLC | 4 366 | 0,28 | 540 | 10,00 | ||||
| 2025-07-15 | 13F | Main Street Group, LTD | 361 | 0,00 | 45 | 10,00 | ||||
| 2025-08-12 | 13F | Financial Advocates Investment Management | 2 790 | −15,20 | 345 | −7,03 | ||||
| 2025-08-06 | 13F | Commonwealth Equity Services, Llc | 59 079 | 0,98 | 7 | 16,67 | ||||
| 2025-08-14 | 13F | Wells Fargo & Company/mn | 314 076 | 72,46 | 38 820 | 89,20 | ||||
| 2025-08-05 | 13F | Bank of New York Mellon Corp | 24 274 | 0,00 | 3 000 | 9,73 | ||||
| 2025-08-14 | 13F | Financial Engines Advisors L.L.C. | 2 908 | 0,00 | 359 | 9,45 | ||||
| 2025-07-08 | 13F | Parallel Advisors, LLC | 1 422 | 0,00 | 176 | 9,38 | ||||
| 2025-08-13 | 13F | Scotia Capital Inc. | 15 177 | 0,02 | 1 876 | 9,71 | ||||
| 2025-08-14 | 13F | Bnp Paribas Arbitrage, Sa | 30 103 | 3 721 | ||||||
| 2025-08-14 | 13F | Guardian Wealth Advisors, Llc / Nc | 100 | 0,00 | 12 | 9,09 | ||||
| 2025-08-15 | 13F | Northeast Financial Consultants Inc | 7 100 | 0,00 | 878 | 9,76 | ||||
| 2025-07-29 | 13F | Chicago Partners Investment Group LLC | 4 150 | 12,16 | 531 | 27,10 | ||||
| 2025-07-07 | 13F | Park Edge Advisors, LLC | 16 444 | 171,44 | 2 032 | 197,95 | ||||
| 2025-07-24 | 13F | Costello Asset Management, INC | 216 | 77,05 | 27 | 100,00 | ||||
| 2025-08-12 | 13F | Del-Sette Capital Management, LLC | 6 550 | 810 | ||||||
| 2025-07-16 | 13F | Essex Financial Services, Inc. | 16 520 | −0,33 | 2 042 | 9,32 | ||||
| 2025-07-07 | 13F | Nova Wealth Management, Inc. | 36 | 4 | ||||||
| 2025-08-12 | 13F | Argent Trust Co | 9 412 | 0,00 | 1 163 | 9,72 | ||||
| 2025-08-14 | 13F | Glen Eagle Advisors, LLC | 75 | 0,00 | 9 | 12,50 | ||||
| 2025-08-14 | 13F | Fiduciary Trust Co | 1 654 | 204 | ||||||
| 2025-05-12 | 13F | Kohmann Bosshard Financial Services, LLC | 0 | −100,00 | 0 | |||||
| 2025-08-13 | 13F | Level Four Advisory Services, Llc | 1 883 | 0,00 | 233 | 9,43 | ||||
| 2025-05-09 | 13F | GeoWealth Management, LLC | 0 | −100,00 | 0 | |||||
| 2025-07-17 | 13F | Tempus Wealth Planning, LLC | 12 524 | 0,00 | 1 548 | 9,72 | ||||
| 2025-08-04 | 13F | IFG Advisory, LLC | 12 673 | 0,02 | 1 566 | 9,74 | ||||
| 2025-07-29 | 13F | Salomon & Ludwin, LLC | 484 | 0,00 | 61 | 11,11 | ||||
| 2025-07-29 | 13F | Stratos Wealth Partners, LTD. | 6 182 | −6,91 | 764 | 2,14 | ||||
| 2025-08-05 | 13F | Bank Of Montreal /can/ | 11 606 | 12,92 | 1 435 | 23,94 | ||||
| 2025-04-21 | 13F | PSI Advisors, LLC | 0 | −100,00 | 0 | |||||
| 2025-08-06 | 13F | True Wealth Design, LLC | 1 084 | 0,00 | 134 | 9,02 | ||||
| 2025-08-01 | 13F | Banco Santander, S.A. | 2 554 | 0,00 | 316 | 9,76 | ||||
| 2025-07-24 | 13F | Us Bancorp \de\ | 2 253 | 0,00 | 278 | 9,88 | ||||
| 2025-08-14 | 13F | Fmr Llc | 40 676 | −4,64 | 5 028 | 4,62 | ||||
| 2025-08-05 | 13F | GPS Wealth Strategies Group, LLC | 431 | 0,23 | 53 | 10,42 | ||||
| 2025-08-19 | 13F | Advisory Services Network, LLC | 2 259 | 282 | ||||||
| 2025-08-07 | 13F | Allworth Financial LP | 2 444 | 0,16 | 302 | 13,96 | ||||
| 2025-07-11 | 13F | Grove Bank & Trust | 300 | 0,00 | 37 | 12,12 | ||||
| 2025-07-29 | 13F | Kelman-Lazarov, Inc. | 1 984 | 0,00 | 245 | 9,87 | ||||
| 2025-08-14 | 13F | Mariner, LLC | 83 316 | 0,82 | 10 298 | 10,60 | ||||
| 2025-05-13 | 13F | Petix & Botte Co | 0 | −100,00 | 0 | −100,00 | ||||
| 2025-08-13 | 13F | Independent Family Office, LLC | 8 414 | 0,00 | 1 040 | 9,71 | ||||
| 2025-08-14 | 13F | Goldman Sachs Group Inc | 5 403 | 668 | ||||||
| 2025-08-05 | 13F | Dunhill Financial, LLC | 1 005 | 0,00 | 124 | 9,73 | ||||
| 2025-07-18 | 13F | Pure Financial Advisors, Inc. | 3 083 | 12,52 | 381 | 23,70 | ||||
| 2025-08-07 | 13F | Montag A & Associates Inc | 0 | −100,00 | 0 | |||||
| 2025-08-12 | 13F | LPL Financial LLC | 388 926 | −0,86 | 48 071 | 8,76 | ||||
| 2025-08-14 | 13F | Royal Bank Of Canada | 44 643 | 6,19 | 5 518 | 16,49 | ||||
| 2025-08-12 | 13F | MAI Capital Management | 5 649 | −0,11 | 698 | 9,58 | ||||
| 2025-08-06 | 13F | North Capital, Inc. | 81 | 0,00 | 10 | 11,11 | ||||
| 2025-08-14 | 13F | Ancora Advisors, LLC | 6 932 | 2,97 | 857 | 12,93 | ||||
| 2025-07-24 | 13F | Bernard Wealth Management Corp. | 130 | 0,00 | 16 | 14,29 | ||||
| 2025-07-28 | 13F | Axxcess Wealth Management, Llc | 1 829 | −1,88 | 226 | 7,62 | ||||
| 2025-07-24 | 13F | Capital Advisors, Ltd. LLC | 3 788 | 19,87 | 0 | |||||
| 2025-08-12 | 13F | Tradition Wealth Management, LLC | 9 253 | −0,02 | 1 144 | 9,69 | ||||
| 2025-08-14 | 13F | Ameriprise Financial Inc | 40 798 | −21,79 | 5 043 | −14,21 | ||||
| 2025-08-14 | 13F | Raymond James Financial Inc | 220 029 | −18,06 | 27 196 | −10,11 | ||||
| 2025-08-14 | 13F | CIBC World Markets Inc. | 7 562 | 7,08 | 935 | 17,48 | ||||
| 2025-07-22 | 13F | Ergawealth Advisors, Inc. | 4 003 | 11,44 | 495 | 22,28 | ||||
| 2025-08-14 | 13F | Citadel Advisors Llc | 1 647 | −87,35 | 204 | −86,15 | ||||
| 2025-07-30 | 13F | Roman Butler Fullerton & Co | 9 191 | 0,04 | 1 171 | 21,37 | ||||
| 2025-07-16 | 13F | Independent Wealth Network Inc. | 5 077 | −4,14 | 628 | 5,20 | ||||
| 2025-08-14 | 13F | Mml Investors Services, Llc | 9 853 | 2,81 | 1 | 0,00 | ||||
| 2025-08-14 | 13F | Stifel Financial Corp | 18 323 | −1,01 | 2 265 | 8,59 | ||||
| 2025-08-14 | 13F | Citadel Advisors Llc | Call | 4 600 | −48,89 | 569 | −43,93 | |||
| 2025-07-28 | 13F | Harbour Investments, Inc. | 394 | −61,03 | 49 | −57,52 | ||||
| 2025-07-23 | 13F | H&H Retirement Design & Management INC | 12 270 | 7,60 | 1 536 | 31,08 | ||||
| 2025-08-05 | 13F | Huntington National Bank | 52 | 8,51 | ||||||
| 2025-08-13 | 13F | JBR Co Financial Management Inc | 4 463 | −3,06 | 552 | 6,37 | ||||
| 2025-04-23 | 13F | Valmark Advisers, Inc. | 0 | −100,00 | 0 | |||||
| 2025-07-30 | 13F | Sentry LLC | 1 825 | 0,00 | 226 | 9,76 | ||||
| 2025-08-13 | 13F | Russell Investments Group, Ltd. | 291 | 0,00 | 36 | 9,38 | ||||
| 2025-08-05 | 13F | Tiaa Trust, National Association | 2 841 | −1,93 | 351 | 7,67 | ||||
| 2025-08-13 | 13F | Legacy Capital Wealth Partners, LLC | 65 461 | −6,00 | 7 451 | 2,60 | ||||
| 2025-07-17 | 13F | Janney Montgomery Scott LLC | 4 991 | −0,34 | 1 | |||||
| 2025-07-09 | 13F | Breakwater Capital Group | 20 762 | 16,35 | 2 566 | 27,66 |