Grundläggande statistik
| Institutionella ägare | 151 total, 150 long only, 0 short only, 1 long/short - change of −0,66% MRQ |
| Genomsnittlig portföljallokering | 0.1948 % - change of −10,91% MRQ |
| Institutionella aktier (lång) | 11 944 231 (ex 13D/G) - change of −0,06MM shares −0,48% MRQ |
| Institutionellt värde (lång) | $ 327 556 USD ($1000) |
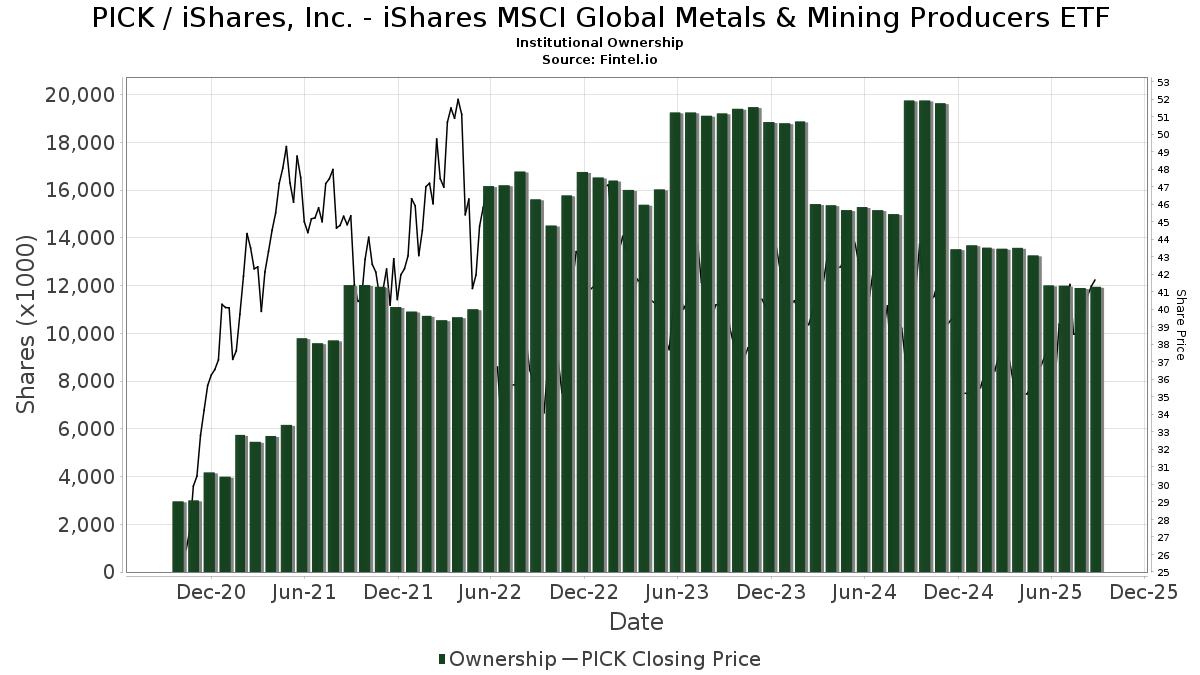
Institutionellt ägande och aktieägare
iShares, Inc. - iShares MSCI Global Metals & Mining Producers ETF (US:PICK) har 151 Institutionella ägare och aktieägare som har lämnat in 13D/G- eller 13F-formulär till Securities Exchange Commission (SEC). Dessa institut innehar totalt 11,944,231 aktier. Största aktieägare inkluderar Fisher Asset Management, LLC, Municipal Employees' Retirement System of Michigan, Greenline Partners, LLC, Bank Of America Corp /de/, Raymond James Financial Inc, Morgan Stanley, RAA - SMI 3Fourteen Real Asset Allocation ETF SMI 3Fourteen REAL Asset Allocation ETF, Jane Street Group, Llc, Goldman Sachs Group Inc, and AMTAX - AB All Market Real Return Portfolio Class A .
iShares, Inc. - iShares MSCI Global Metals & Mining Producers ETF (BATS:PICK) Institutionell ägarstruktur visar institutioners och fonders nuvarande positioner i företaget, samt de senaste förändringarna i positionernas storlek. Större aktieägare kan vara enskilda investerare, fonder, hedgefonder eller institutioner. Bilaga 13D visar att investeraren äger (eller ägde) mer än 5% av företaget och avser (eller avsåg) att aktivt eftersträva en förändring av affärsstrategin. Schedule 13G indikerar en passiv investering på över 5%.
The share price as of September 10, 2025 is 41,67 / share. Previously, on September 11, 2024, the share price was 36,93 / share. This represents an increase of 12,84% over that period.
Fondsentimentets poäng
Fondsentimentet poängen(fka Ägarackumulation-poäng) visar vilka aktier som är mest köpta av fonder. Det är resultatet av en sofistikerad kvantitativ flerfaktormodell som identifierar företag med de högsta nivåerna av institutionell ackumulering. Poängsättningsmodellen använder en kombination av den totala ökningen av redovisade ägare, förändringarna i portföljallokeringarna för dessa ägare och andra mått. Siffran sträcker sig från 0 till 100, där högre siffror indikerar en högre nivå av ackumulering i förhållande till sina konkurrenter, och 50 är genomsnittet.
Uppdateringsfrekvens: Dagligen
Se Ownership Explorer, som innehåller en lista över de högst rankade företagen.
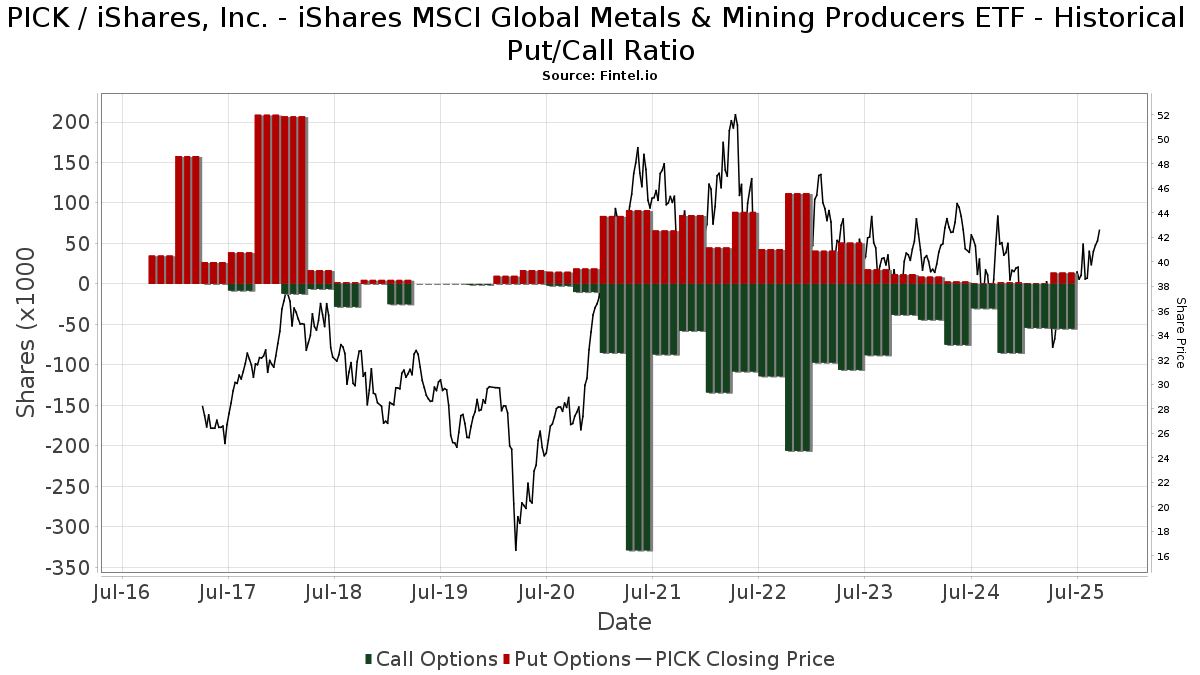
Institutionell sälj/köp-kvot
Förutom att rapportera vanliga eget kapital- och skuldemissioner måste institutioner med mer än 100MM tillgångar under förvaltning också avslöja sina innehav av sälj- och köpoptioner. Eftersom säljoptioner i allmänhet indikerar ett negativt sentiment och köpoptioner indikerar ett positivt sentiment, kan vi få en uppfattning om det övergripande institutionella sentimentet genom att plotta förhållandet mellan säljoptioner och köpoptioner. Diagrammet till höger visar det historiska förhållandet mellan sälj- och köpoptioner för detta instrument.
Genom att använda sälj/köp-kvoten som en indikator på aktieägarnas sentiment undviker man en av de största bristerna med att använda det totala institutionella ägandet, nämligen att en betydande del av de förvaltade tillgångarna investeras passivt för att följa index. Passivt förvaltade fonder köper vanligtvis inte optioner, så indikatorn för sälj/köp-kvoten ger en bättre bild av stämningen i aktivt förvaltade fonder.
13F- och NPORT-arkiveringar
Detaljer om 13F-arkiveringar är gratis. Detaljer om NP-arkiveringar kräver ett premiummedlemskap. Gröna rader indikerar nya positioner. Röda rader indikerar stängda positioner. Klicka på länk symbolen för att se hela transaktionshistoriken.
Uppgradera
för att låsa upp premiumdata och exportera till Excel ![]() .
.
| Fil Datum | Källa | Investerare | Typ | Genomsnittligt pris (beräknat) |
Aktier | Δ Aktier (%) |
Rapporterat värde (1000 USD) |
Δ Värde (%) |
Portföljallokering (%) |
|
|---|---|---|---|---|---|---|---|---|---|---|
| 2025-08-14 | 13F | Principia Wealth Advisory, LLC | 3 280 | 123 | ||||||
| 2025-08-08 | 13F | Emerald Investment Partners, Llc | 129 | 5 | ||||||
| 2025-08-06 | 13F | Rialto Wealth Management, LLC | 669 | 0,00 | 25 | 4,17 | ||||
| 2025-08-12 | 13F | MAI Capital Management | 313 | 0,00 | 12 | 0,00 | ||||
| 2025-08-13 | 13F | Tls Advisors Llc | 100 994 | −49,38 | 4 | −57,14 | ||||
| 2025-07-21 | 13F | Synergy Financial Management, LLC | 5 549 | 209 | ||||||
| 2025-08-14 | 13F | CoreCap Advisors, LLC | 55 455 | −34,53 | 2 085 | −31,39 | ||||
| 2025-07-14 | 13F | U.S. Capital Wealth Advisors, LLC | 27 936 | −12,59 | 1 050 | −8,38 | ||||
| 2025-08-14 | 13F | Financial Advisory Service, Inc. | 1 649 | 1,41 | 62 | 5,17 | ||||
| 2025-08-13 | 13F | Northwestern Mutual Wealth Management Co | 2 560 | −73,85 | 96 | −72,65 | ||||
| 2025-07-15 | 13F | Fifth Third Bancorp | 250 | 0,00 | 9 | 12,50 | ||||
| 2025-07-14 | 13F | Opal Wealth Advisors, LLC | 841 | 32 | ||||||
| 2025-07-28 | 13F | Axxcess Wealth Management, Llc | 5 328 | 200 | ||||||
| 2025-08-11 | 13F | Strategic Wealth Partners, Ltd. | 360 | 14 | ||||||
| 2025-08-14 | 13F | Fmr Llc | 623 | −46,57 | 23 | −43,90 | ||||
| 2025-05-14 | 13F | Lionshead Wealth Management, LLC | 0 | −100,00 | 0 | |||||
| 2025-04-28 | 13F | Pinnacle Financial Partners Inc | 2 571 | 0,00 | 90 | −19,82 | ||||
| 2025-07-18 | 13F | Union Bancaire Privee, UBP SA | 5 347 | 0,00 | 202 | 4,12 | ||||
| 2025-07-24 | 13F | Ronald Blue Trust, Inc. | 195 | 0,00 | 7 | 16,67 | ||||
| 2025-07-08 | 13F | Parallel Advisors, LLC | 351 | 0,00 | 13 | 8,33 | ||||
| 2025-08-14 | 13F | State Street Corp | 5 600 | −37,78 | 211 | −34,78 | ||||
| 2025-08-13 | 13F | Fort Sheridan Advisors Llc | 9 408 | −2,43 | 354 | 2,32 | ||||
| 2025-08-14 | 13F | Synovus Financial Corp | 65 658 | 0,00 | 2 469 | 4,80 | ||||
| 2025-07-31 | 13F | Wealthfront Advisers Llc | 43 404 | 5,68 | 1 632 | 10,73 | ||||
| 2025-08-08 | 13F | Pnc Financial Services Group, Inc. | 3 006 | 0,00 | 113 | 5,61 | ||||
| 2025-08-14 | 13F | Toroso Investments, LLC | 116 268 | −41,41 | 4 372 | −38,61 | ||||
| 2025-08-14 | 13F | Stamos Capital Partners, L.p. | 41 223 | 50,42 | 1 550 | 57,58 | ||||
| 2025-07-08 | 13F | Webster Bank, N. A. | 318 | 0,00 | 12 | 0,00 | ||||
| 2025-08-12 | 13F | LPL Financial LLC | 92 203 | −0,08 | 3 467 | 4,71 | ||||
| 2025-08-13 | 13F | Quadrature Capital Ltd | 0 | −100,00 | 0 | |||||
| 2025-08-14 | 13F | GWM Advisors LLC | 433 | 0,93 | 16 | 6,67 | ||||
| 2025-08-08 | 13F | Hartland & Co., LLC | 0 | −100,00 | 0 | |||||
| 2025-08-11 | 13F | HighTower Advisors, LLC | 31 940 | 29,43 | 1 201 | 35,59 | ||||
| 2025-08-11 | 13F | Aptus Capital Advisors, LLC | 357 | 37,31 | 13 | 44,44 | ||||
| 2025-08-12 | 13F | TCTC Holdings, LLC | 2 825 | 0,00 | 106 | 4,95 | ||||
| 2025-07-23 | 13F | Meitav Dash Investments Ltd | 7 692 | 0,00 | 289 | 5,09 | ||||
| 2025-08-12 | 13F | Choate Investment Advisors | 2 378 | 89 | ||||||
| 2025-08-11 | 13F | Rothschild Investment Llc | 0 | −100,00 | 0 | |||||
| 2025-07-03 | 13F | JBGlobal.com LLC | 0 | −100,00 | 0 | |||||
| 2025-07-25 | 13F | Retirement Planning Group, Llc / Ny | 15 690 | −8,09 | 590 | −3,76 | ||||
| 2025-08-14 | 13F | Hrt Financial Lp | 6 763 | 0 | ||||||
| 2025-05-05 | 13F | Lindbrook Capital, Llc | 0 | −100,00 | 0 | |||||
| 2025-05-16 | 13F/A | Kestra Investment Management, LLC | 0 | −100,00 | 0 | |||||
| 2025-07-22 | 13F | Valley National Advisers Inc | 155 | −52,74 | 0 | |||||
| 2025-04-22 | 13F | Verde Servicos Internacionais S.A. | 0 | −100,00 | 0 | |||||
| 2025-08-12 | 13F | Founders Financial Alliance, LLC | 50 | −16,67 | 2 | −50,00 | ||||
| 2025-07-25 | 13F | Northwest Capital Management Inc | 459 | 0,00 | 17 | 6,25 | ||||
| 2025-08-12 | 13F | O'shaughnessy Asset Management, Llc | 1 | −96,97 | 0 | −100,00 | ||||
| 2025-08-14 | 13F | D. E. Shaw & Co., Inc. | 9 766 | −29,53 | 367 | −26,16 | ||||
| 2025-07-14 | 13F | Abound Wealth Management | 1 152 | 1,95 | 43 | 7,50 | ||||
| 2025-08-14 | 13F | Raymond James Financial Inc | 283 792 | 2,54 | 10 671 | 7,45 | ||||
| 2025-08-12 | 13F | Steward Partners Investment Advisory, Llc | 5 943 | 0,85 | 223 | 5,69 | ||||
| 2025-07-25 | 13F | Stonehage Fleming Financial Services Holdings Ltd | 0 | −100,00 | 0 | |||||
| 2025-08-11 | 13F | Nomura Asset Management Co Ltd | 15 523 | 0,00 | 584 | 4,86 | ||||
| 2025-08-13 | 13F | Baird Financial Group, Inc. | 12 738 | −47,62 | 479 | −45,18 | ||||
| 2025-03-24 | 13F/A | Wellington Management Group Llp | 0 | −100,00 | 0 | |||||
| 2025-08-12 | 13F | Pathstone Holdings, LLC | 12 295 | 0,00 | 462 | 4,76 | ||||
| 2025-07-14 | 13F | Clear Harbor Asset Management, LLC | 51 348 | 0,65 | 1 931 | 5,46 | ||||
| 2025-07-17 | 13F | Elwood & Goetz Wealth Advisory Group, LLC | 17 496 | 13,89 | 658 | 19,24 | ||||
| 2025-08-14 | 13F | Ameriprise Financial Inc | 87 253 | 3,86 | 3 281 | 8,83 | ||||
| 2025-07-21 | 13F | Ameritas Advisory Services, LLC | 371 | 14 | ||||||
| 2025-08-04 | 13F | Mesirow Financial Investment Management, Inc. | 40 538 | −51,46 | 1 524 | −49,13 | ||||
| 2025-08-07 | 13F | Resolute Advisors LLC | 7 836 | 12,15 | 295 | 17,60 | ||||
| 2025-07-24 | 13F | Us Bancorp \de\ | 11 109 | 7 835,00 | 418 | 8 240,00 | ||||
| 2025-08-14 | 13F | Bnp Paribas Arbitrage, Sa | 17 979 | −28,34 | 676 | −24,89 | ||||
| 2025-07-31 | 13F | Cambridge Investment Research Advisors, Inc. | 14 112 | −69,09 | 1 | −100,00 | ||||
| 2025-05-12 | 13F | Hirtle Callaghan & Co LLC | 0 | −100,00 | 0 | |||||
| 2025-08-08 | 13F | IMA Wealth, Inc. | 13 | 0,00 | 0 | |||||
| 2025-08-08 | 13F | Cetera Investment Advisers | 14 990 | −34,41 | 564 | −31,26 | ||||
| 2025-08-14 | 13F | Susquehanna International Group, Llp | 86 428 | 3 250 | ||||||
| 2025-08-08 | 13F | Gts Securities Llc | 146 052 | 5 492 | ||||||
| 2025-07-29 | 13F | Angeles Wealth Management, Llc | 0 | −100,00 | 0 | |||||
| 2025-08-14 | 13F | Susquehanna International Group, Llp | Call | 6 400 | −49,21 | 241 | −46,90 | |||
| 2025-05-15 | 13F | Two Sigma Securities, Llc | 0 | −100,00 | 0 | |||||
| 2025-08-07 | 13F | Nwam Llc | 0 | −100,00 | 0 | |||||
| 2025-08-14 | 13F | Federation des caisses Desjardins du Quebec | 503 | −34,08 | 19 | −33,33 | ||||
| 2025-07-15 | 13F | Colonial River Wealth Management, LLC | 5 328 | 210 | ||||||
| 2025-08-12 | 13F | Jpmorgan Chase & Co | 6 535 | −3,36 | 246 | 1,24 | ||||
| 2025-08-15 | 13F | CI Private Wealth, LLC | 44 315 | −49,69 | 1 666 | −47,28 | ||||
| 2025-09-04 | 13F/A | Advisor Group Holdings, Inc. | 22 345 | −4,21 | 841 | 0,36 | ||||
| 2025-07-28 | 13F | Harbour Investments, Inc. | 223 | −23,10 | 8 | −20,00 | ||||
| 2025-08-12 | 13F | CIBC Private Wealth Group, LLC | 1 700 | −59,85 | 64 | −50,78 | ||||
| 2025-08-13 | 13F | Northern Trust Corp | 17 285 | 0,00 | 650 | 4,68 | ||||
| 2025-07-18 | 13F | PFG Investments, LLC | 7 034 | 1,34 | 264 | 6,02 | ||||
| 2025-07-31 | 13F | City State Bank | 800 | 0,00 | 30 | 7,14 | ||||
| 2025-08-14 | 13F | Stifel Financial Corp | 25 620 | −16,56 | 963 | −12,53 | ||||
| 2025-08-14 | 13F | Comerica Bank | 1 655 | −28,20 | 62 | −24,39 | ||||
| 2025-08-11 | 13F | Heritage Wealth Advisors | 11 700 | 0,00 | 440 | 4,77 | ||||
| 2025-08-04 | 13F | Savvy Advisors, Inc. | 32 105 | −2,45 | 1 207 | 2,29 | ||||
| 2025-05-08 | 13F | Strategic Advocates LLC | 0 | −100,00 | 0 | |||||
| 2025-08-14 | 13F | Old Mission Capital Llc | 31 093 | −22,64 | 1 169 | −18,93 | ||||
| 2025-07-28 | 13F | BRYN MAWR TRUST Co | 0 | −100,00 | 0 | |||||
| 2025-08-13 | 13F | Continuum Advisory, LLC | 0 | −100,00 | 0 | |||||
| 2025-07-17 | 13F | BFI Infinity Ltd. | 10 342 | 0,00 | 389 | 4,58 | ||||
| 2025-08-14 | 13F | Bank Of America Corp /de/ | 544 102 | 83,58 | 20 458 | 92,38 | ||||
| 2025-05-12 | 13F | Townsquare Capital Llc | 0 | −100,00 | 0 | |||||
| 2025-08-12 | 13F | Insigneo Advisory Services, Llc | 6 840 | 0,59 | 257 | 5,76 | ||||
| 2025-08-13 | 13F | ASB Consultores, LLC | 0 | −100,00 | 0 | |||||
| 2025-08-13 | 13F | Fisher Asset Management, LLC | 3 332 961 | −4,75 | 125 319 | −0,19 | ||||
| 2025-07-25 | 13F | Cwm, Llc | 1 310 | 7,73 | 0 | |||||
| 2025-08-14 | 13F | Citadel Advisors Llc | Call | 41 100 | 183,45 | 1 545 | 197,12 | |||
| 2025-08-14 | 13F | Citadel Advisors Llc | 102 815 | 534,00 | 3 866 | 565,23 | ||||
| 2025-08-14 | 13F | Citadel Advisors Llc | Put | 14 700 | 673,68 | 553 | 711,76 | |||
| 2025-08-01 | 13F | Envestnet Asset Management Inc | 36 684 | 5,28 | 1 379 | 10,32 | ||||
| 2025-08-13 | 13F | Scotia Capital Inc. | 26 921 | −38,87 | 1 012 | −35,95 | ||||
| 2025-07-16 | 13F | ORG Wealth Partners, LLC | 49 | 0,00 | 2 | 0,00 | ||||
| 2025-05-14 | 13F | Barometer Capital Management Inc. | 0 | −100,00 | 0 | |||||
| 2025-07-08 | 13F | Arlington Trust Co LLC | 1 500 | 0,00 | 56 | 5,66 | ||||
| 2025-08-06 | 13F | Black Swift Group, LLC | 8 800 | 0,00 | 331 | 4,76 | ||||
| 2025-05-07 | 13F | Phoenix Holdings Ltd. | 0 | −100,00 | 0 | −100,00 | ||||
| 2025-07-29 | 13F | Stratos Wealth Advisors, LLC | 58 627 | −61,85 | 2 204 | −60,02 | ||||
| 2025-07-25 | 13F | Almanack Investment Partners, LLC. | 144 807 | 8,54 | 5 445 | 13,72 | ||||
| 2025-05-12 | 13F | Simplex Trading, Llc | 0 | −100,00 | 0 | |||||
| 2025-08-29 | NP | GDMA - Gadsden Dynamic Multi-Asset ETF | 98 312 | −21,10 | 3 697 | −17,32 | ||||
| 2025-04-28 | 13F | Clarity Capital Partners LLC | 0 | −100,00 | 0 | |||||
| 2025-08-14 | 13F | Wealth Preservation Advisors, LLC | 53 | 0,00 | 2 | 0,00 | ||||
| 2025-07-31 | 13F | Allied Investment Advisors, LLC | 67 916 | 109,44 | 2 554 | 119,52 | ||||
| 2025-08-08 | 13F | Avantax Advisory Services, Inc. | 19 270 | 47,23 | 725 | 54,37 | ||||
| 2025-05-07 | 13F | Second Half Financial Partners, LLC | 0 | −100,00 | 0 | |||||
| 2025-08-14 | 13F | UBS Group AG | 84 144 | 6,22 | 3 164 | 11,29 | ||||
| 2025-07-17 | 13F | Barry Investment Advisors, LLC | 96 317 | −2,36 | 3 622 | 2,32 | ||||
| 2025-08-01 | 13F | Motco | 200 | 8 | ||||||
| 2025-08-11 | 13F | Empowered Funds, LLC | 98 579 | −20,88 | 3 707 | −17,09 | ||||
| 2025-08-11 | 13F | Principal Securities, Inc. | 803 | −8,12 | 30 | 0,00 | ||||
| 2025-07-25 | 13F | Endowment Wealth Management, Inc. | 11 408 | −0,91 | 429 | 3,63 | ||||
| 2025-07-28 | 13F | Kiker Wealth Management, LLC | 851 | 32 | ||||||
| 2025-08-11 | 13F | Citigroup Inc | 1 | 0,00 | 0 | |||||
| 2025-08-14 | 13F | Daiwa Securities Group Inc. | 20 100 | 0,00 | 1 | |||||
| 2025-08-04 | 13F | Municipal Employees' Retirement System of Michigan | 3 032 992 | 0,00 | 114 | 5,56 | ||||
| 2025-08-13 | 13F | Schroder Investment Management Group | 0 | −100,00 | 0 | |||||
| 2025-07-11 | 13F | Farther Finance Advisors, LLC | 98 | 0,00 | 4 | 0,00 | ||||
| 2025-08-12 | 13F | Trans-Canada Capital Inc. | 90 250 | 0,00 | 3 393 | 4,79 | ||||
| 2025-07-24 | 13F | IFP Advisors, Inc | 600 | 0,00 | 23 | 4,76 | ||||
| 2025-07-07 | 13F | Thurston, Springer, Miller, Herd & Titak, Inc. | 210 | 0,00 | 8 | 0,00 | ||||
| 2025-08-06 | 13F | AE Wealth Management LLC | 1 957 | 6,30 | 74 | 10,61 | ||||
| 2025-08-08 | 13F | Family Firm, Inc. | 37 064 | 7,62 | 1 394 | 12,79 | ||||
| 2025-08-12 | 13F | Howe & Rusling Inc | 106 | 0,00 | 4 | 0,00 | ||||
| 2025-07-18 | 13F | Parsons Capital Management Inc/ri | 7 840 | 0,00 | 295 | 4,63 | ||||
| 2025-07-14 | 13F | Sowell Financial Services LLC | 10 811 | 0,68 | 406 | 5,45 | ||||
| 2025-07-17 | 13F | Smith Anglin Financial, LLC | 0 | −100,00 | 0 | |||||
| 2025-08-14 | 13F | CIBC World Markets Inc. | 33 827 | 248,80 | 1 272 | 266,28 | ||||
| 2025-08-06 | 13F | Commonwealth Equity Services, Llc | 21 851 | −21,84 | 1 | −100,00 | ||||
| 2025-08-14 | 13F | Goldman Sachs Group Inc | 218 703 | −19,78 | 8 223 | −15,94 | ||||
| 2025-08-15 | 13F | Tower Research Capital LLC (TRC) | 149 | 413,79 | 6 | 400,00 | ||||
| 2025-03-27 | NP | AMTAX - AB All Market Real Return Portfolio Class A | 168 830 | 0,00 | 5 988 | −11,63 | ||||
| 2025-05-07 | 13F | Evermay Wealth Management Llc | 0 | −100,00 | 0 | −100,00 | ||||
| 2025-07-10 | 13F | Wealth Enhancement Advisory Services, Llc | 7 428 | −22,59 | 291 | −15,70 | ||||
| 2025-08-14 | 13F | Jane Street Group, Llc | Call | 0 | −100,00 | 0 | ||||
| 2025-07-31 | 13F | Oppenheimer & Co Inc | 17 393 | 654 | ||||||
| 2025-08-11 | 13F | Bedell Frazier Investment Counseling, LLC | 76 157 | 2 864 | ||||||
| 2025-08-18 | 13F/A | National Bank Of Canada /fi/ | 950 | −3,26 | 36 | 0,00 | ||||
| 2025-08-06 | 13F | Prospera Financial Services Inc | 0 | −100,00 | 0 | |||||
| 2025-04-30 | 13F | Banque Pictet & Cie Sa | 0 | −100,00 | 0 | |||||
| 2025-07-08 | 13F | Nbc Securities, Inc. | 0 | −100,00 | 0 | |||||
| 2025-07-23 | 13F | Vontobel Holding Ltd. | 30 750 | 0,00 | 1 156 | 4,81 | ||||
| 2025-08-11 | 13F | CBIZ Investment Advisory Services, LLC | 246 | 1,65 | 9 | 12,50 | ||||
| 2025-08-13 | 13F | Greenwich Wealth Management LLC | 17 219 | −0,43 | 1 | |||||
| 2025-04-10 | 13F | SMI Advisory Services, LLC | 0 | −100,00 | 0 | |||||
| 2025-07-17 | 13F | Vermillion Wealth Management, Inc. | 15 770 | 13,10 | 593 | 18,40 | ||||
| 2025-07-09 | 13F | Breakwater Capital Group | 0 | −100,00 | 0 | |||||
| 2025-08-14 | 13F | Glenmede Investment Management, LP | 2 524 | 95 | ||||||
| 2025-08-14 | 13F | Mml Investors Services, Llc | 8 355 | 2,72 | 0 | |||||
| 2025-04-29 | 13F | Capital Investment Advisory Services, LLC | 0 | −100,00 | 0 | |||||
| 2025-08-13 | 13F | Argyle Capital Partners, LLC | 9 838 | 13,30 | 370 | 18,65 | ||||
| 2025-08-13 | 13F | Ted Buchan & Co | 6 680 | −13,58 | 251 | −9,39 | ||||
| 2025-08-14 | 13F/A | Rockefeller Capital Management L.P. | 30 257 | −29,97 | 1 138 | −26,65 | ||||
| 2025-07-16 | 13F | Essex Financial Services, Inc. | 10 455 | −75,38 | 393 | −74,20 | ||||
| 2025-08-14 | 13F | Royal Bank Of Canada | 125 471 | 1 088,51 | 4 718 | 1 144,85 | ||||
| 2025-08-13 | 13F | Transce3nd, LLC | 23 | 360,00 | 1 | |||||
| 2025-05-14 | 13F | Renaissance Technologies Llc | 0 | −100,00 | 0 | |||||
| 2025-07-18 | 13F | Truist Financial Corp | 19 460 | 4,53 | 732 | 9,60 | ||||
| 2025-08-12 | 13F | Running Point Capital Advisors, LLC | 0 | −100,00 | 0 | |||||
| 2025-08-12 | 13F | Proequities, Inc. | 0 | 0 | ||||||
| 2025-08-05 | 13F | Bank Of Montreal /can/ | 11 645 | 2,79 | 438 | 7,64 | ||||
| 2025-05-15 | 13F | Alliancebernstein L.p. | 0 | −100,00 | 0 | −100,00 | ||||
| 2025-07-24 | 13F | Comprehensive Money Management Services LLC | 21 902 | −4,04 | 824 | 0,61 | ||||
| 2025-06-30 | NP | SMILX - SMI 50/40/10 Fund | 2 890 | −55,74 | 102 | −61,45 | ||||
| 2025-07-24 | 13F | Stonebridge Financial Group, LLC | 0 | −100,00 | 0 | |||||
| 2025-08-29 | NP | RAA - SMI 3Fourteen Real Asset Allocation ETF SMI 3Fourteen REAL Asset Allocation ETF | 263 601 | 22,94 | 9 911 | 28,85 | ||||
| 2025-05-15 | 13F | Glenmede Trust Co Na | 1 129 | 0,00 | 41 | 2,56 | ||||
| 2025-08-08 | 13F | Creative Planning | 15 263 | 10,49 | 574 | 15,76 | ||||
| 2025-08-13 | 13F | Jones Financial Companies Lllp | 4 089 | −9,33 | 155 | −6,10 | ||||
| 2025-08-18 | 13F | Wolverine Trading, Llc | Call | 8 200 | 310 | |||||
| 2025-08-14 | 13F | Jane Street Group, Llc | 262 488 | 73,40 | 9 870 | 81,72 | ||||
| 2025-07-21 | 13F | J. Safra Sarasin Holding AG | 6 000 | 0,00 | 226 | 4,65 | ||||
| 2025-04-28 | 13F | Fedenia Advisers LLC | 0 | −100,00 | 0 | |||||
| 2025-08-14 | 13F | Wells Fargo & Company/mn | 22 951 | −44,23 | 863 | −41,60 | ||||
| 2025-06-30 | NP | SMIDX - SMI Dynamic Allocation Fund | 7 690 | −25,27 | 270 | −25,82 | ||||
| 2025-08-07 | 13F | Allworth Financial LP | 97 | −70,78 | 4 | −72,73 | ||||
| 2025-07-30 | 13F | Whittier Trust Co Of Nevada Inc | 110 | 0,00 | 4 | 33,33 | ||||
| 2025-05-12 | 13F | Kohmann Bosshard Financial Services, LLC | 0 | −100,00 | 0 | |||||
| 2025-08-14 | 13F | Erste Asset Management GmbH | 2 000 | 0,00 | 75 | 5,63 | ||||
| 2025-07-16 | 13F | Strategic Investment Solutions, Inc. /IL | 0 | −100,00 | 0 | |||||
| 2025-05-09 | 13F/A | Oversea-Chinese Banking CORP Ltd | 0 | −100,00 | 0 | −100,00 | ||||
| 2025-08-14 | 13F | Greenline Partners, LLC | 555 538 | 147,29 | 20 888 | 159,16 | ||||
| 2025-08-11 | 13F | TD Waterhouse Canada Inc. | 629 | −8,31 | 24 | −4,17 | ||||
| 2025-08-15 | 13F | Morgan Stanley | 283 027 | −1,81 | 10 642 | 2,89 |