Grundläggande statistik
| Institutionella ägare | 131 total, 131 long only, 0 short only, 0 long/short - change of −3,68% MRQ |
| Genomsnittlig portföljallokering | 0.1319 % - change of −34,88% MRQ |
| Institutionella aktier (lång) | 22 380 155 (ex 13D/G) - change of −3,31MM shares −12,87% MRQ |
| Institutionellt värde (lång) | $ 241 950 USD ($1000) |
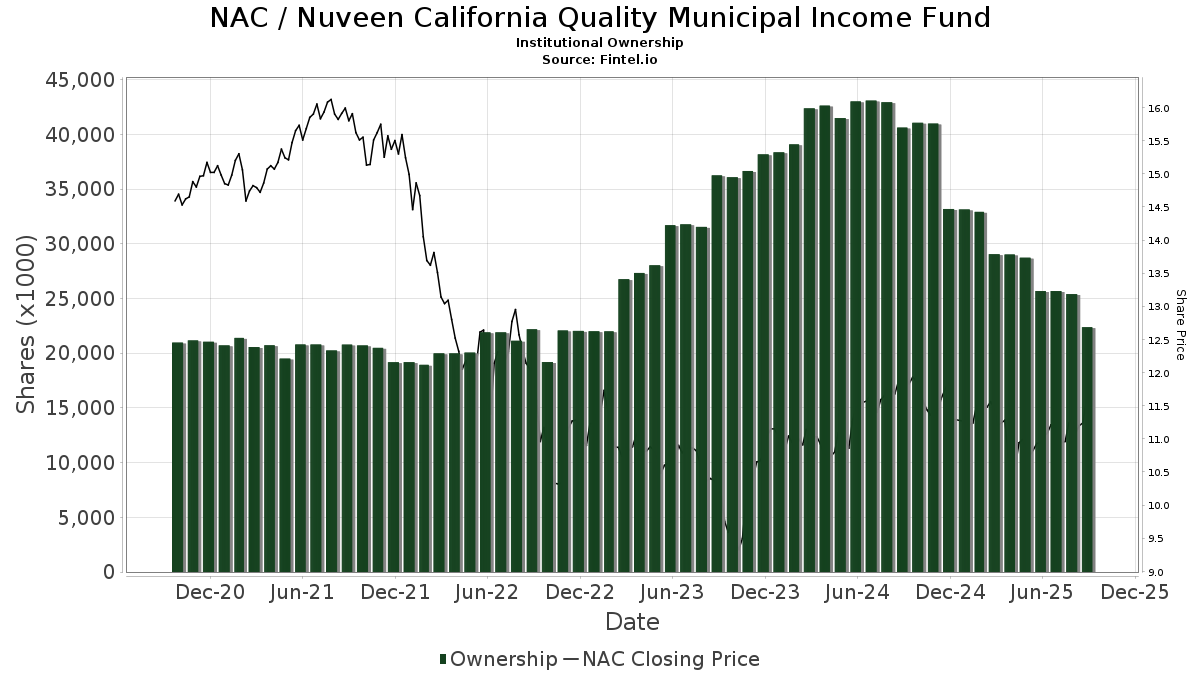
Institutionellt ägande och aktieägare
Nuveen California Quality Municipal Income Fund (US:NAC) har 131 Institutionella ägare och aktieägare som har lämnat in 13D/G- eller 13F-formulär till Securities Exchange Commission (SEC). Dessa institut innehar totalt 22,380,155 aktier. Största aktieägare inkluderar Morgan Stanley, Mackay Shields Llc, Guggenheim Capital Llc, UBS Group AG, Wells Fargo & Company/mn, Rockefeller Capital Management L.P., Advisors Asset Management, Inc., RNDLX - RiverNorth/DoubleLine Strategic Income Fund Class R, Mariner, LLC, and Bank Of America Corp /de/ .
Nuveen California Quality Municipal Income Fund (NYSE:NAC) Institutionell ägarstruktur visar institutioners och fonders nuvarande positioner i företaget, samt de senaste förändringarna i positionernas storlek. Större aktieägare kan vara enskilda investerare, fonder, hedgefonder eller institutioner. Bilaga 13D visar att investeraren äger (eller ägde) mer än 5% av företaget och avser (eller avsåg) att aktivt eftersträva en förändring av affärsstrategin. Schedule 13G indikerar en passiv investering på över 5%.
The share price as of September 15, 2025 is 11,47 / share. Previously, on September 16, 2024, the share price was 11,89 / share. This represents a decline of 3,53% over that period.
Fondsentimentets poäng
Fondsentimentet poängen(fka Ägarackumulation-poäng) visar vilka aktier som är mest köpta av fonder. Det är resultatet av en sofistikerad kvantitativ flerfaktormodell som identifierar företag med de högsta nivåerna av institutionell ackumulering. Poängsättningsmodellen använder en kombination av den totala ökningen av redovisade ägare, förändringarna i portföljallokeringarna för dessa ägare och andra mått. Siffran sträcker sig från 0 till 100, där högre siffror indikerar en högre nivå av ackumulering i förhållande till sina konkurrenter, och 50 är genomsnittet.
Uppdateringsfrekvens: Dagligen
Se Ownership Explorer, som innehåller en lista över de högst rankade företagen.
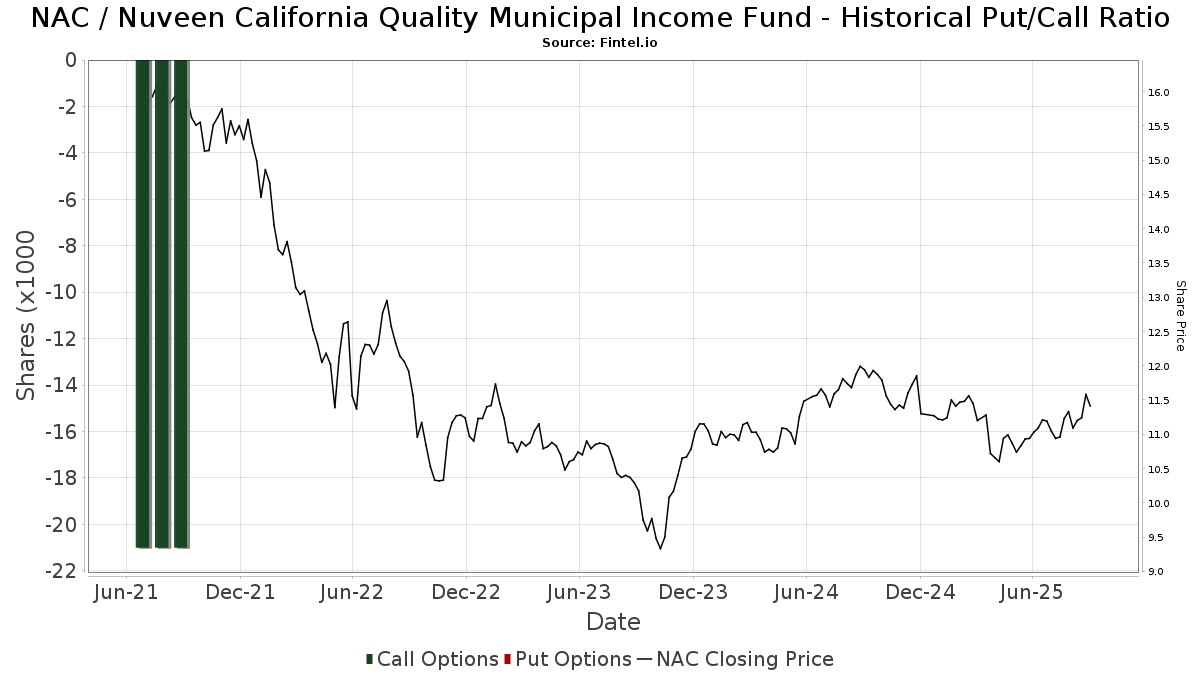
Institutionell sälj/köp-kvot
Förutom att rapportera vanliga eget kapital- och skuldemissioner måste institutioner med mer än 100MM tillgångar under förvaltning också avslöja sina innehav av sälj- och köpoptioner. Eftersom säljoptioner i allmänhet indikerar ett negativt sentiment och köpoptioner indikerar ett positivt sentiment, kan vi få en uppfattning om det övergripande institutionella sentimentet genom att plotta förhållandet mellan säljoptioner och köpoptioner. Diagrammet till höger visar det historiska förhållandet mellan sälj- och köpoptioner för detta instrument.
Genom att använda sälj/köp-kvoten som en indikator på aktieägarnas sentiment undviker man en av de största bristerna med att använda det totala institutionella ägandet, nämligen att en betydande del av de förvaltade tillgångarna investeras passivt för att följa index. Passivt förvaltade fonder köper vanligtvis inte optioner, så indikatorn för sälj/köp-kvoten ger en bättre bild av stämningen i aktivt förvaltade fonder.
13F- och NPORT-arkiveringar
Detaljer om 13F-arkiveringar är gratis. Detaljer om NP-arkiveringar kräver ett premiummedlemskap. Gröna rader indikerar nya positioner. Röda rader indikerar stängda positioner. Klicka på länk symbolen för att se hela transaktionshistoriken.
Uppgradera
för att låsa upp premiumdata och exportera till Excel ![]() .
.
| Fil Datum | Källa | Investerare | Typ | Genomsnittligt pris (beräknat) |
Aktier | Δ Aktier (%) |
Rapporterat värde (1000 USD) |
Δ Värde (%) |
Portföljallokering (%) |
|
|---|---|---|---|---|---|---|---|---|---|---|
| 2025-07-25 | 13F | Atria Wealth Solutions, Inc. | 0 | −100,00 | 0 | |||||
| 2025-08-14 | 13F | GWM Advisors LLC | 106 671 | 52,24 | 1 192 | 51,33 | ||||
| 2025-06-24 | NP | MMHVX - MainStay MacKay High Yield Municipal Bond Fund Investor Class | 387 003 | 0,00 | 4 234 | −3,62 | ||||
| 2025-07-16 | 13F | Dakota Wealth Management | 0 | −100,00 | 0 | |||||
| 2025-07-29 | 13F | International Assets Investment Management, Llc | 42 600 | 13,30 | 476 | 12,56 | ||||
| 2025-07-14 | 13F | Sowell Financial Services LLC | 31 000 | 0,28 | 346 | −0,29 | ||||
| 2025-08-07 | 13F | Allworth Financial LP | 155 519 | 0,19 | 1 737 | 4,51 | ||||
| 2025-07-16 | 13F | New Insight Wealth Advisors | 41 135 | −31,34 | 459 | −31,80 | ||||
| 2025-05-08 | 13F | XTX Topco Ltd | 0 | −100,00 | 0 | |||||
| 2025-07-23 | 13F | Prime Capital Investment Advisors, LLC | 65 357 | −11,40 | 730 | −11,94 | ||||
| 2025-08-05 | 13F | Pacific Wealth Strategies Group, Inc. | 61 310 | −18,31 | 675 | −19,93 | ||||
| 2025-08-11 | 13F | HighTower Advisors, LLC | 48 490 | 1,17 | 542 | 0,56 | ||||
| 2025-08-13 | 13F | Cerity Partners LLC | 48 541 | −2,65 | 542 | −3,21 | ||||
| 2025-08-14 | 13F | Comerica Bank | 47 | −99,11 | 1 | −100,00 | ||||
| 2025-08-07 | 13F | Atala Financial Inc | 108 930 | −22,69 | 1 217 | −23,18 | ||||
| 2025-07-15 | 13F | Bfsg, Llc | 600 | 20,00 | 7 | 20,00 | ||||
| 2025-08-04 | 13F | Mesirow Financial Investment Management, Inc. | 13 556 | 19,68 | 151 | 18,90 | ||||
| 2025-07-30 | 13F | Sanders Morris Harris Llc | 0 | −100,00 | 0 | |||||
| 2025-08-12 | 13F | CIBC Private Wealth Group, LLC | 10 000 | 0,00 | 112 | 4,72 | ||||
| 2025-08-14 | 13F | LM Advisors LLC | 320 013 | −5,30 | 4 | 0,00 | ||||
| 2025-07-08 | 13F | Strategic Advocates LLC | 10 400 | 0,00 | 116 | 0,00 | ||||
| 2025-07-15 | 13F | Mather Group, Llc. | 0 | −100,00 | 0 | |||||
| 2025-07-24 | 13F | IFP Advisors, Inc | 875 | 1,98 | 10 | 0,00 | ||||
| 2025-08-15 | 13F | WFA of San Diego, LLC | 450 | 5 | ||||||
| 2025-08-12 | 13F | Change Path, LLC | 13 544 | 25,36 | 151 | 24,79 | ||||
| 2025-08-12 | 13F | Advisors Asset Management, Inc. | 741 485 | 15,14 | 8 282 | 14,42 | ||||
| 2025-07-18 | 13F | Bartlett & Co. Wealth Management Llc | 40 750 | 0,00 | 458 | −0,43 | ||||
| 2025-08-12 | 13F | MAI Capital Management | 8 900 | 0,00 | 99 | −1,00 | ||||
| 2025-08-14 | 13F | Gerber Kawasaki Wealth & Investment Management | 15 987 | 179 | ||||||
| 2025-05-30 | NP | RiverNorth Flexible Municipal Income Fund II, Inc. | 284 138 | −34,14 | 3 194 | −34,44 | ||||
| 2025-08-14 | 13F | Apriem Advisors | 42 320 | −3,42 | 473 | −4,07 | ||||
| 2025-07-18 | 13F | SOA Wealth Advisors, LLC. | 951 | 1,93 | 11 | 0,00 | ||||
| 2025-08-14 | 13F | Rivernorth Capital Management, Llc | 0 | −100,00 | 0 | |||||
| 2025-08-14 | 13F | EP Wealth Advisors, Inc. | 27 382 | 134,68 | 306 | 132,82 | ||||
| 2025-08-15 | 13F | Morgan Stanley | 3 406 674 | 4,08 | 38 053 | 3,43 | ||||
| 2025-08-08 | 13F | Creative Planning | 19 128 | −72,17 | 214 | −72,41 | ||||
| 2025-07-09 | 13F | Fermata Advisors, LLC | 10 900 | 0,00 | 122 | −0,82 | ||||
| 2025-07-24 | 13F | Us Bancorp \de\ | 4 400 | 0,00 | 49 | 0,00 | ||||
| 2025-08-11 | 13F | Oder Investment Management, LLC | 56 859 | 12,83 | 635 | 12,19 | ||||
| 2025-08-14 | 13F | Bank Of America Corp /de/ | 494 618 | 8,26 | 5 525 | 7,58 | ||||
| 2025-08-14 | 13F | UBS Group AG | 1 573 703 | −16,43 | 17 578 | −16,95 | ||||
| 2025-04-28 | 13F | Weaver Consulting Group | 0 | −100,00 | 0 | |||||
| 2025-08-14 | 13F | Mariner, LLC | 551 348 | 4,60 | 6 159 | 3,95 | ||||
| 2025-06-12 | 13F/A | Deutsche Bank Ag\ | 0 | −100,00 | 0 | |||||
| 2025-08-07 | 13F | Nwam Llc | 43 139 | 0,00 | 482 | −0,62 | ||||
| 2025-05-14 | 13F | Caitlin John, LLC | 0 | −100,00 | 0 | |||||
| 2025-08-15 | 13F | Kestra Advisory Services, LLC | 11 321 | 126 | ||||||
| 2025-05-30 | NP | RiverNorth Managed Duration Municipal Income Fund II, Inc. | 181 877 | −8,52 | 2 044 | −8,91 | ||||
| 2025-07-15 | 13F | EWG Elevate Inc. | 12 100 | 135 | ||||||
| 2025-08-11 | 13F | Core Wealth Partners LLC | 33 499 | 0,00 | 374 | −0,53 | ||||
| 2025-07-08 | 13F | Parallel Advisors, LLC | 13 831 | 0,00 | 154 | −0,65 | ||||
| 2025-08-13 | 13F | Fisher Asset Management, LLC | 0 | −100,00 | 0 | |||||
| 2025-07-28 | 13F | Mutual Advisors, LLC | 62 950 | 2,96 | 689 | 4,39 | ||||
| 2025-07-07 | 13F | RB Capital Management, LLC | 15 785 | 1,64 | 176 | 1,15 | ||||
| 2025-08-06 | 13F | Prospera Financial Services Inc | 35 000 | 391 | ||||||
| 2025-08-12 | 13F | Proequities, Inc. | 0 | 0 | ||||||
| 2025-07-18 | 13F | Pure Financial Advisors, Inc. | 18 195 | 0,00 | 203 | −0,49 | ||||
| 2025-08-14 | 13F | Ameriprise Financial Inc | 118 150 | 3,87 | 1 320 | 2,89 | ||||
| 2025-06-24 | NP | MainStay MacKay Municipal Income Opportunities Fund | 75 000 | 0,00 | 820 | −3,64 | ||||
| 2025-07-18 | 13F | PFG Investments, LLC | 191 148 | −0,40 | 2 135 | −1,02 | ||||
| 2025-08-14 | 13F | Raymond James Financial Inc | 148 317 | −1,82 | 1 657 | −2,42 | ||||
| 2025-08-14 | 13F | Integrated Wealth Concepts LLC | 35 626 | 0,00 | 398 | −0,75 | ||||
| 2025-08-14 | 13F | Sit Investment Associates Inc | 173 252 | −27,64 | 2 | −50,00 | ||||
| 2025-08-27 | NP | RMMBX - Aspiriant Risk-Managed Municipal Bond Fund | 20 085 | 0,00 | 224 | −0,44 | ||||
| 2025-08-27 | 13F | Barnes Wealth Management Group, Inc | 14 953 | 0,00 | 167 | −0,60 | ||||
| 2025-07-31 | 13F | Cambridge Investment Research Advisors, Inc. | 19 789 | 0 | ||||||
| 2025-05-14 | 13F | Landscape Capital Management, L.l.c. | 0 | −100,00 | 0 | |||||
| 2025-08-14 | 13F | Royal Bank Of Canada | 127 194 | 1,65 | 1 421 | 1,00 | ||||
| 2025-08-14 | 13F | Jane Street Group, Llc | 50 896 | 90,52 | 569 | 89,33 | ||||
| 2025-07-21 | 13F | Ameriflex Group, Inc. | 1 400 | 0,00 | 16 | 0,00 | ||||
| 2025-08-18 | 13F | Hollencrest Capital Management | 55 063 | 0,00 | 615 | −0,49 | ||||
| 2025-08-14 | 13F | Susquehanna International Group, Llp | 27 259 | −21,43 | 304 | −21,85 | ||||
| 2025-08-29 | NP | PIMCO Flexible Municipal Income Fund | 401 979 | 0,00 | 4 490 | −0,62 | ||||
| 2025-08-08 | 13F/A | Ignite Planners, LLC | 323 400 | 4,18 | 3 554 | 4,47 | ||||
| 2025-08-08 | 13F | Cetera Investment Advisers | 52 309 | −17,45 | 584 | −17,98 | ||||
| 2025-08-08 | 13F | Everett Harris & Co /ca/ | 46 000 | 0,00 | 514 | −0,77 | ||||
| 2025-05-29 | NP | RYMSX - Guggenheim Multi-Hedge Strategies Fund Class P | 260 | −45,03 | 3 | −60,00 | ||||
| 2025-08-14 | 13F | Robinson Capital Management, Llc | 122 707 | −84,23 | 1 371 | −84,33 | ||||
| 2025-08-12 | 13F | Virtu Financial LLC | 11 115 | −3,31 | 0 | |||||
| 2025-08-12 | 13F | LPL Financial LLC | 434 012 | 19,76 | 4 848 | 19,00 | ||||
| 2025-07-17 | 13F | Melfa Wealth Management, Llc | 49 816 | −7,00 | 556 | −7,64 | ||||
| 2025-08-07 | 13F | Evoke Wealth, Llc | 249 824 | 3,93 | 2 809 | 3,27 | ||||
| 2025-05-15 | 13F | Whitebox Advisors Llc | 0 | −100,00 | 0 | |||||
| 2025-07-25 | 13F | RHS Financial, LLC | 46 560 | −6,84 | 520 | −7,31 | ||||
| 2025-08-12 | 13F | J.w. Cole Advisors, Inc. | 21 541 | 0,00 | 241 | −0,83 | ||||
| 2025-07-30 | 13F | Whittier Trust Co Of Nevada Inc | 3 550 | 0,00 | 40 | 0,00 | ||||
| 2025-08-06 | 13F | Wedbush Securities Inc | 86 319 | 2,74 | 1 | |||||
| 2025-08-15 | 13F | Tower Research Capital LLC (TRC) | 0 | −100,00 | 0 | |||||
| 2025-08-08 | 13F | Pnc Financial Services Group, Inc. | 73 963 | 24,04 | 826 | 23,28 | ||||
| 2025-08-14 | 13F | Karpus Management, Inc. | 0 | −100,00 | 0 | |||||
| 2025-08-14 | 13F | Smartleaf Asset Management LLC | 1 240 | 14 | ||||||
| 2025-07-30 | 13F | Whittier Trust Co | 93 821 | −13,04 | 1 048 | −13,61 | ||||
| 2025-05-15 | 13F | Nomura Holdings Inc | 0 | −100,00 | 0 | |||||
| 2025-08-07 | 13F | Kestra Private Wealth Services, Llc | 51 056 | 1,43 | 570 | 0,88 | ||||
| 2025-05-30 | NP | RiverNorth Flexible Municipal Income Fund, Inc. | 51 115 | 0,00 | 575 | −0,52 | ||||
| 2025-08-14 | 13F | Snowden Capital Advisors LLC | 20 526 | −14,55 | 231 | −15,13 | ||||
| 2025-08-14 | 13F | First Foundation Advisors | 68 102 | 0,00 | 761 | −0,65 | ||||
| 2025-07-10 | 13F | Wealth Enhancement Advisory Services, Llc | 0 | −100,00 | 0 | |||||
| 2025-07-28 | 13F | Allianz Asset Management GmbH | 475 879 | 0,00 | 5 316 | −0,62 | ||||
| 2025-08-12 | 13F | Global Retirement Partners, LLC | 3 685 | 0,00 | 41 | 0,00 | ||||
| 2025-07-28 | 13F | Davidson Trust Co | 148 098 | 0,00 | 1 654 | −0,60 | ||||
| 2025-08-11 | 13F | NewEdge Wealth, LLC | 27 100 | 0,00 | 305 | 0,33 | ||||
| 2025-08-15 | 13F | CI Private Wealth, LLC | 75 437 | 0,00 | 843 | −0,59 | ||||
| 2025-08-06 | 13F | Commonwealth Equity Services, Llc | 70 996 | −3,97 | 1 | |||||
| 2025-08-11 | 13F | Blue Bell Private Wealth Management, Llc | 0 | −100,00 | 0 | |||||
| 2025-09-04 | 13F/A | Advisor Group Holdings, Inc. | 74 291 | 34,63 | 830 | 33,71 | ||||
| 2025-07-23 | 13F | Castle Rock Wealth Management, LLC | 24 375 | 0,00 | 267 | −2,91 | ||||
| 2025-08-11 | 13F | First American Trust, Fsb | 19 000 | 0,00 | 212 | −0,47 | ||||
| 2025-08-11 | 13F | Rothschild Investment Llc | 1 303 | 2,04 | 15 | 0,00 | ||||
| 2025-09-11 | 13F | Silicon Valley Capital Partners | 0 | −100,00 | 0 | |||||
| 2025-07-21 | 13F | Riverview Trust Co | 10 612 | 0,00 | 119 | −0,84 | ||||
| 2025-08-14 | 13F | Ieq Capital, Llc | 13 215 | −7,93 | 148 | −8,70 | ||||
| 2025-05-29 | NP | RYDEX VARIABLE TRUST - Multi-Hedge Strategies Fund Variable Annuity | 339 | 2,42 | 4 | 0,00 | ||||
| 2025-08-14 | 13F/A | Rockefeller Capital Management L.P. | 1 150 167 | 6,27 | 12 847 | 5,61 | ||||
| 2025-05-30 | NP | RNDLX - RiverNorth/DoubleLine Strategic Income Fund Class R | 675 930 | −6,89 | 7 597 | −7,30 | ||||
| 2025-05-30 | NP | RiverNorth Opportunistic Municipal Income Fund, Inc. | 61 266 | −15,49 | 689 | −15,89 | ||||
| 2025-07-25 | 13F | Cwm, Llc | 10 061 | 0,00 | 0 | |||||
| 2025-08-04 | 13F | Bridgewealth Advisory Group, LLC | 38 828 | 434 | ||||||
| 2025-07-21 | 13F | Ameritas Advisory Services, LLC | 17 057 | 0,00 | 191 | −0,52 | ||||
| 2025-08-27 | NP | ROBAX - Robinson Tax Advantaged Income Fund Class A Shares | 122 707 | −84,23 | 1 371 | −84,33 | ||||
| 2025-08-11 | 13F | Perennial Investment Advisors, LLC | 11 012 | 0,00 | 123 | 0,00 | ||||
| 2025-08-11 | 13F | Bell Investment Advisors, Inc | 113 | 1 | ||||||
| 2025-09-09 | 13F | NWF Advisory Services Inc. | 14 520 | 162 | ||||||
| 2025-07-11 | 13F | Farther Finance Advisors, LLC | 21 822 | 0,00 | 244 | −1,22 | ||||
| 2025-08-05 | 13F | Intellectus Partners, LLC | 25 000 | 85,19 | 281 | 83,66 | ||||
| 2025-08-13 | 13F | Guggenheim Capital Llc | 1 810 250 | 12,98 | 20 220 | 12,28 | ||||
| 2025-07-15 | 13F | Regatta Capital Group, Llc | 144 621 | −1,35 | 1 615 | −1,94 | ||||
| 2025-05-15 | 13F | Hrt Financial Lp | 0 | −100,00 | 0 | |||||
| 2025-07-15 | 13F | DKM Wealth Management, Inc. | 142 401 | 0,00 | 1 591 | −0,62 | ||||
| 2025-08-13 | 13F | North Berkeley Wealth Management, LLC | 0 | −100,00 | 0 | |||||
| 2025-08-14 | 13F | Stifel Financial Corp | 75 626 | 5,86 | 845 | 5,24 | ||||
| 2025-08-29 | NP | PIMCO California Flexible Municipal Income Fund | 73 900 | 0,00 | 825 | −0,60 | ||||
| 2025-07-16 | 13F | Perigon Wealth Management, LLC | 15 168 | −8,45 | 169 | −9,14 | ||||
| 2025-08-11 | 13F | Western Wealth Management, LLC | 15 049 | 0,00 | 168 | −0,59 | ||||
| 2025-08-08 | 13F | Avantax Advisory Services, Inc. | 11 987 | −30,93 | 134 | −31,79 | ||||
| 2025-05-15 | 13F | Main Management LLC | 0 | −100,00 | 0 | |||||
| 2025-08-19 | 13F | Newbridge Financial Services Group, Inc. | 2 000 | 22 | ||||||
| 2025-07-21 | 13F | Grassi Investment Management | 15 000 | 0,00 | 0 | |||||
| 2025-05-30 | NP | RiverNorth Managed Duration Municipal Income Fund, Inc. | 125 062 | −13,26 | 1 406 | −13,64 | ||||
| 2025-08-07 | 13F/A | Tortoise Investment Management, LLC | 0 | −100,00 | 0 | −100,00 | ||||
| 2025-07-18 | 13F | Cooper Financial Group | 40 955 | 1,49 | 457 | 0,88 | ||||
| 2025-07-24 | 13F | Mackay Shields Llc | 2 150 869 | −1,56 | 24 025 | −2,17 | ||||
| 2025-07-30 | 13F | D.a. Davidson & Co. | 99 375 | 114,63 | 1 110 | 113,46 | ||||
| 2025-08-14 | 13F | Wells Fargo & Company/mn | 1 288 928 | 11,33 | 14 397 | 10,64 | ||||
| 2025-07-31 | 13F | Oppenheimer & Co Inc | 36 396 | 25,76 | 407 | 24,92 | ||||
| 2025-08-12 | 13F | Choate Investment Advisors | 15 000 | 0,00 | 168 | −0,60 | ||||
| 2025-08-13 | 13F | Van Hulzen Asset Management, LLC | 51 950 | 1,96 | 580 | 1,40 | ||||
| 2025-07-14 | 13F | Southland Equity Partners LLC | 135 540 | 10,16 | 1 514 | 9,48 | ||||
| 2025-08-14 | 13F | Citadel Advisors Llc | 17 654 | 197 | ||||||
| 2025-08-07 | 13F | Resources Investment Advisors, LLC. | 140 068 | 5,43 | 1 565 | 4,76 | ||||
| 2025-08-07 | 13F | Hennion & Walsh Asset Management, Inc. | 347 748 | 8,54 | 3 884 | 7,89 | ||||
| 2025-07-30 | 13F | FNY Investment Advisers, LLC | 2 000 | 0,00 | 0 | |||||
| 2025-07-16 | 13F | MKT Advisors LLC | 23 060 | 0,00 | 259 | 3,20 | ||||
| 2025-05-14 | 13F | Thomas J. Herzfeld Advisors, Inc. | 0 | −100,00 | 0 | |||||
| 2025-05-02 | 13F | Larson Financial Group LLC | 0 | −100,00 | 0 | |||||
| 2025-08-05 | 13F | Rareview Capital LLC | 66 107 | −7,80 | 738 | −8,32 |