Grundläggande statistik
| Institutionella ägare | 152 total, 152 long only, 0 short only, 0 long/short - change of −6,13% MRQ |
| Genomsnittlig portföljallokering | 0.8496 % - change of −0,39% MRQ |
| Institutionella aktier (lång) | 18 186 431 (ex 13D/G) - change of −5,05MM shares −21,72% MRQ |
| Institutionellt värde (lång) | $ 798 290 USD ($1000) |
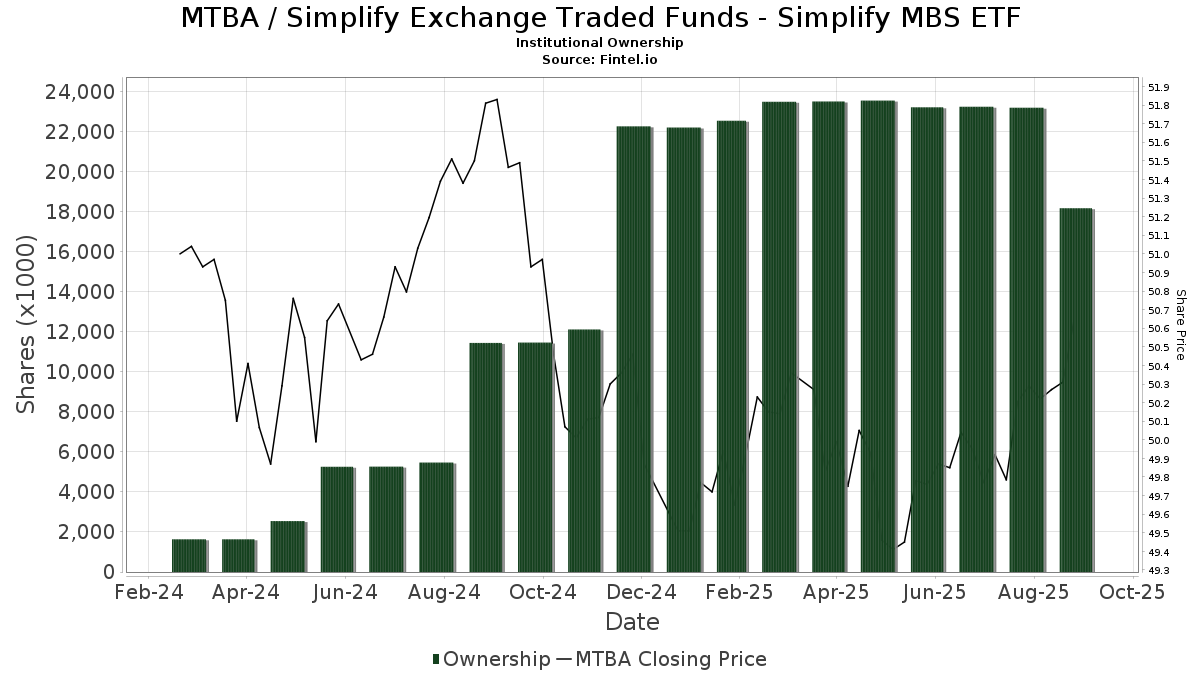
Institutionellt ägande och aktieägare
Simplify Exchange Traded Funds - Simplify MBS ETF (US:MTBA) har 152 Institutionella ägare och aktieägare som har lämnat in 13D/G- eller 13F-formulär till Securities Exchange Commission (SEC). Dessa institut innehar totalt 18,186,431 aktier. Största aktieägare inkluderar Envestnet Asset Management Inc, Wells Fargo & Company/mn, Mml Investors Services, Llc, Evergreen Capital Management Llc, Hilton Capital Management, LLC, Watchman Group, Inc., Knightsbridge Asset Management, Llc, Aprio Wealth Management, LLC, Tortoise Investment Management, LLC, and Ci Investments Inc. .
Simplify Exchange Traded Funds - Simplify MBS ETF (ARCA:MTBA) Institutionell ägarstruktur visar institutioners och fonders nuvarande positioner i företaget, samt de senaste förändringarna i positionernas storlek. Större aktieägare kan vara enskilda investerare, fonder, hedgefonder eller institutioner. Bilaga 13D visar att investeraren äger (eller ägde) mer än 5% av företaget och avser (eller avsåg) att aktivt eftersträva en förändring av affärsstrategin. Schedule 13G indikerar en passiv investering på över 5%.
The share price as of September 11, 2025 is 50,69 / share. Previously, on September 12, 2024, the share price was 51,78 / share. This represents a decline of 2,11% over that period.
Fondsentimentets poäng
Fondsentimentet poängen(fka Ägarackumulation-poäng) visar vilka aktier som är mest köpta av fonder. Det är resultatet av en sofistikerad kvantitativ flerfaktormodell som identifierar företag med de högsta nivåerna av institutionell ackumulering. Poängsättningsmodellen använder en kombination av den totala ökningen av redovisade ägare, förändringarna i portföljallokeringarna för dessa ägare och andra mått. Siffran sträcker sig från 0 till 100, där högre siffror indikerar en högre nivå av ackumulering i förhållande till sina konkurrenter, och 50 är genomsnittet.
Uppdateringsfrekvens: Dagligen
Se Ownership Explorer, som innehåller en lista över de högst rankade företagen.
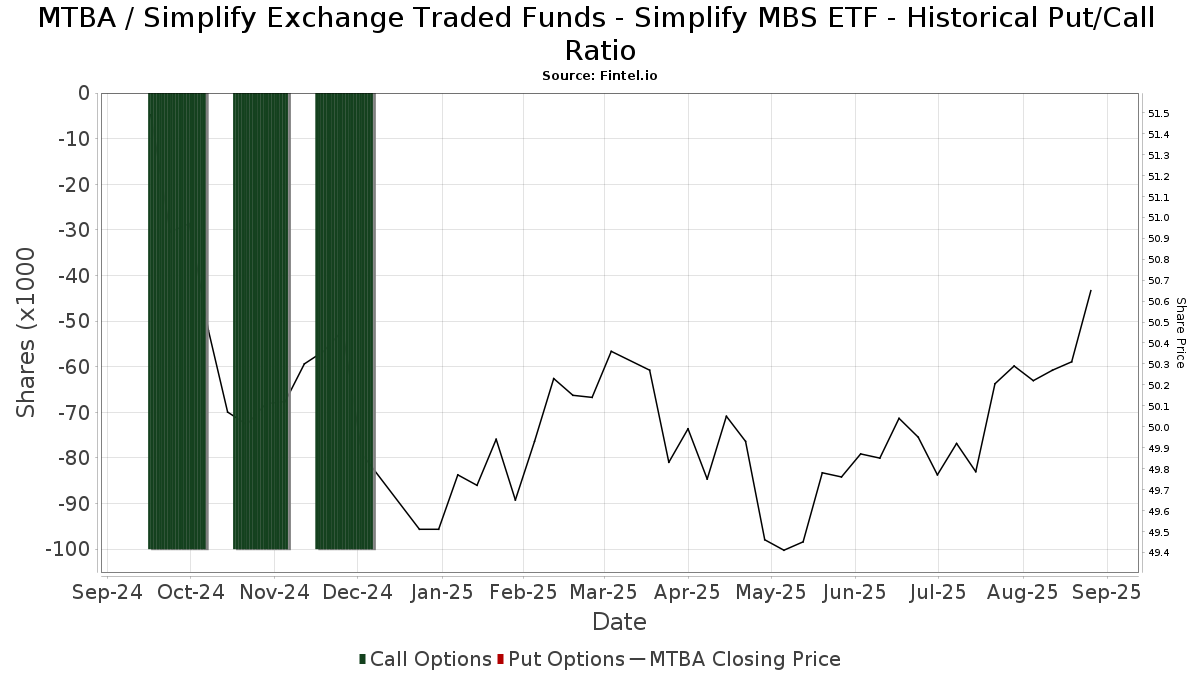
Institutionell sälj/köp-kvot
Förutom att rapportera vanliga eget kapital- och skuldemissioner måste institutioner med mer än 100MM tillgångar under förvaltning också avslöja sina innehav av sälj- och köpoptioner. Eftersom säljoptioner i allmänhet indikerar ett negativt sentiment och köpoptioner indikerar ett positivt sentiment, kan vi få en uppfattning om det övergripande institutionella sentimentet genom att plotta förhållandet mellan säljoptioner och köpoptioner. Diagrammet till höger visar det historiska förhållandet mellan sälj- och köpoptioner för detta instrument.
Genom att använda sälj/köp-kvoten som en indikator på aktieägarnas sentiment undviker man en av de största bristerna med att använda det totala institutionella ägandet, nämligen att en betydande del av de förvaltade tillgångarna investeras passivt för att följa index. Passivt förvaltade fonder köper vanligtvis inte optioner, så indikatorn för sälj/köp-kvoten ger en bättre bild av stämningen i aktivt förvaltade fonder.
13F- och NPORT-arkiveringar
Detaljer om 13F-arkiveringar är gratis. Detaljer om NP-arkiveringar kräver ett premiummedlemskap. Gröna rader indikerar nya positioner. Röda rader indikerar stängda positioner. Klicka på länk symbolen för att se hela transaktionshistoriken.
Uppgradera
för att låsa upp premiumdata och exportera till Excel ![]() .
.
| Fil Datum | Källa | Investerare | Typ | Genomsnittligt pris (beräknat) |
Aktier | Δ Aktier (%) |
Rapporterat värde (1000 USD) |
Δ Värde (%) |
Portföljallokering (%) |
|
|---|---|---|---|---|---|---|---|---|---|---|
| 2025-07-28 | 13F | Hamilton Point Investment Advisors, LLC | 53 | 3 | ||||||
| 2025-08-11 | 13F | WPG Advisers, LLC | 0 | −100,00 | 0 | |||||
| 2025-08-13 | 13F | Kilter Group LLC | 8 | 0 | ||||||
| 2025-07-14 | 13F | Edge Wealth Management LLC | 263 171 | 15,88 | 13 181 | 15,75 | ||||
| 2025-07-16 | 13F | BOS Asset Management, LLC | 14 730 | 0,00 | 738 | −0,14 | ||||
| 2025-08-11 | 13F | Mill Creek Capital Advisors, LLC | 22 990 | −96,88 | 1 152 | −96,89 | ||||
| 2025-04-29 | NP | WTBN - WisdomTree Bianco Total Return Fund | 93 547 | 20,60 | 4 703 | 20,26 | ||||
| 2025-08-14 | 13F | Aprio Wealth Management, LLC | 385 686 | 30,28 | 19 319 | 30,16 | ||||
| 2025-07-10 | 13F | Wealth Enhancement Advisory Services, Llc | 248 545 | −11,28 | 12 412 | −11,63 | ||||
| 2025-08-14 | 13F | Mercer Global Advisors Inc /adv | 4 012 | −53,58 | 201 | −53,81 | ||||
| 2025-07-23 | 13F | Heck Capital Advisors, LLC | 230 380 | 2,96 | 11 540 | 2,85 | ||||
| 2025-08-13 | 13F | Fort Sheridan Advisors Llc | 5 038 | 252 | ||||||
| 2025-07-10 | 13F | Wedmont Private Capital | 5 349 | 0,00 | 267 | 1,14 | ||||
| 2025-08-04 | 13F | Municipal Employees' Retirement System of Michigan | 0 | −100,00 | 0 | |||||
| 2025-08-11 | 13F | Principal Securities, Inc. | 12 071 | 194,20 | 605 | 197,54 | ||||
| 2025-04-23 | 13F | Continuum Advisory, LLC | 0 | −100,00 | 0 | −100,00 | ||||
| 2025-08-14 | 13F | GWM Advisors LLC | 14 775 | −32,33 | 740 | −32,36 | ||||
| 2025-08-05 | 13F | Huntington National Bank | 54 | 29,27 | ||||||
| 2025-08-27 | NP | APPLX - Appleseed Fund Investor Class | 14 500 | 0,00 | 726 | −0,14 | ||||
| 2025-07-16 | 13F | Perigon Wealth Management, LLC | 0 | −100,00 | 0 | |||||
| 2025-07-23 | 13F | Citizens National Bank Trust Department | 20 789 | 32,19 | 1 041 | 32,11 | ||||
| 2025-04-08 | 13F | Rothschild Investment Llc | 0 | −100,00 | 0 | |||||
| 2025-08-26 | NP | LCR - Leuthold Core ETF | 0 | −100,00 | 0 | −100,00 | ||||
| 2025-08-14 | 13F | Cove Street Capital, LLC | 14 600 | 0,00 | 731 | −0,14 | ||||
| 2025-07-17 | 13F | Alpine Bank Wealth Management | 20 748 | −27,64 | 1 039 | −27,70 | ||||
| 2025-08-19 | 13F | Advisory Services Network, LLC | 40 453 | 5,33 | 2 014 | 4,57 | ||||
| 2025-08-06 | 13F | Wedbush Securities Inc | 31 879 | 39,00 | 2 | 0,00 | ||||
| 2025-08-11 | 13F | Morling Financial Advisors, LLC | 295 026 | −1,79 | 14 778 | −1,89 | ||||
| 2025-07-24 | 13F | Endeavor Private Wealth, Inc. | 6 292 | −52,19 | 315 | −52,20 | ||||
| 2025-05-13 | 13F | Aptus Capital Advisors, LLC | 0 | −100,00 | 0 | |||||
| 2025-07-25 | 13F | Cwm, Llc | 114 | 0,00 | 0 | |||||
| 2025-05-15 | 13F | Two Sigma Securities, Llc | 0 | −100,00 | 0 | |||||
| 2025-07-07 | 13F | Thurston, Springer, Miller, Herd & Titak, Inc. | 1 245 | 36,96 | 62 | 37,78 | ||||
| 2025-05-19 | 13F/A | Jane Street Group, Llc | Call | 0 | −100,00 | 0 | −100,00 | |||
| 2025-07-11 | 13F | Farther Finance Advisors, LLC | 1 162 | 59,83 | 58 | 61,11 | ||||
| 2025-08-14 | 13F | Benjamin Edwards Inc | 56 249 | −23,63 | 2 818 | −23,72 | ||||
| 2025-08-14 | 13F | Ancora Advisors, LLC | 17 000 | 0,00 | 852 | −0,12 | ||||
| 2025-07-18 | 13F | Magnolia Private Wealth, LLC | 6 209 | 0,13 | 311 | 0,32 | ||||
| 2025-07-31 | 13F | Whipplewood Advisors, LLC | 0 | −100,00 | 0 | |||||
| 2025-08-04 | 13F | Whalen Wealth Management Inc. | 0 | −100,00 | 0 | |||||
| 2025-08-06 | 13F | Founders Financial Securities Llc | 5 440 | 272 | ||||||
| 2025-07-24 | NP | AIHAX - Horizon Active Income Fund Advisor Class | 265 324 | 182,15 | 13 165 | 178,51 | ||||
| 2025-07-25 | 13F | GFS Advisors, LLC | 5 200 | −77,96 | 260 | −78,02 | ||||
| 2025-08-11 | 13F | Citigroup Inc | 0 | −100,00 | 0 | |||||
| 2025-07-31 | 13F | Cambridge Investment Research Advisors, Inc. | 0 | −100,00 | 0 | |||||
| 2025-08-14 | 13F | Jane Street Group, Llc | 79 541 | 638,89 | 3 984 | 639,15 | ||||
| 2025-08-06 | 13F | Commonwealth Equity Services, Llc | 218 226 | 41,98 | 11 | 42,86 | ||||
| 2025-07-07 | 13F | Ables, Iannone, Moore & Associates, Inc. | 4 301 | 1,18 | 215 | 0,94 | ||||
| 2025-08-26 | NP | GLBIX - Leuthold Global Fund Institutional Class | 3 912 | 0,00 | 196 | −0,51 | ||||
| 2025-08-14 | 13F | Royal Bank Of Canada | 251 163 | 7,28 | 12 580 | 7,16 | ||||
| 2025-08-11 | 13F | First American Trust, Fsb | 147 963 | −9,87 | 7 411 | −9,96 | ||||
| 2025-05-02 | 13F | Dakota Wealth Management | 0 | −100,00 | 0 | |||||
| 2025-08-13 | 13F | Tranquilli Financial Advisor LLC | 13 585 | 680 | ||||||
| 2025-08-12 | 13F | Watchman Group, Inc. | 742 514 | 5,21 | 37 193 | 5,10 | ||||
| 2025-07-09 | 13F | Breakwater Capital Group | 59 069 | 76,38 | 2 959 | 76,18 | ||||
| 2025-07-16 | 13F | Cambridge Advisors Inc. | 16 409 | 3,07 | 822 | 2,88 | ||||
| 2025-07-30 | 13F | Exencial Wealth Advisors, Llc | 0 | −100,00 | 0 | |||||
| 2025-08-07 | 13F | Kestra Private Wealth Services, Llc | 33 784 | −0,85 | 1 692 | −0,94 | ||||
| 2025-07-22 | 13F | Iron Horse Wealth Management, LLC | 0 | −100,00 | 0 | |||||
| 2025-08-08 | 13F | Meridian Wealth Management, LLC | 9 400 | 471 | ||||||
| 2025-07-25 | 13F | Priebe Wealth Holdings LLC | 123 100 | 30,96 | 6 166 | 30,83 | ||||
| 2025-07-18 | 13F | Truist Financial Corp | 64 454 | −52,67 | 3 209 | −53,01 | ||||
| 2025-08-05 | 13F | Simplex Trading, Llc | 428 | 42,67 | 0 | |||||
| 2025-08-14 | 13F | Raymond James Financial Inc | 2 222 | 111 | ||||||
| 2025-04-09 | 13F | RFG Advisory, LLC | 0 | −100,00 | 0 | |||||
| 2025-05-15 | 13F/A | Orion Portfolio Solutions, LLC | 95 919 | 66,51 | 4 809 | 68,03 | ||||
| 2025-07-01 | 13F | First National Bank Sioux Falls | 29 273 | 56,27 | 1 466 | 56,12 | ||||
| 2025-08-12 | 13F | AlphaCore Capital LLC | 0 | −100,00 | 0 | |||||
| 2025-07-22 | 13F | Knights of Columbus Asset Advisors LLC | 7 175 | 0,00 | 359 | 0,00 | ||||
| 2025-07-29 | 13F | Stephens Inc /ar/ | 9 000 | 451 | ||||||
| 2025-05-15 | 13F | Old Mission Capital Llc | 0 | −100,00 | 0 | |||||
| 2025-07-23 | 13F | Venturi Wealth Management, LLC | 15 974 | −2,20 | 800 | −2,20 | ||||
| 2025-08-12 | 13F | J.w. Cole Advisors, Inc. | 55 638 | 2 787 | ||||||
| 2025-08-13 | 13F | Townsquare Capital Llc | 0 | −100,00 | 0 | |||||
| 2025-08-14 | 13F | Sei Investments Co | 0 | −100,00 | 0 | |||||
| 2025-08-08 | 13F | Tortoise Investment Management, LLC | 343 462 | 3,30 | 17 204 | 3,20 | ||||
| 2025-08-01 | 13F | Envestnet Asset Management Inc | 1 976 092 | 2,40 | 98 982 | 2,30 | ||||
| 2025-08-05 | 13F | Bank Of Montreal /can/ | 76 695 | 163,56 | 3 842 | 163,26 | ||||
| 2025-05-12 | 13F | Independent Advisor Alliance | 0 | −100,00 | 0 | |||||
| 2025-07-25 | 13F | Sharp Financial Services, LLC | 7 050 | 56,67 | 353 | 56,89 | ||||
| 2025-08-11 | 13F | Private Advisor Group, LLC | 93 273 | 5,08 | 4 672 | 4,99 | ||||
| 2025-07-16 | 13F | ORG Partners LLC | 0 | −100,00 | 0 | |||||
| 2025-07-16 | 13F | Magnus Financial Group LLC | 4 257 | −0,05 | 213 | 0,00 | ||||
| 2025-07-21 | 13F | Andina Capital Management, LLC | 77 333 | −20,48 | 3 874 | −20,57 | ||||
| 2025-07-28 | 13F | Harbour Investments, Inc. | 65 | 0,00 | 3 | 0,00 | ||||
| 2025-08-15 | 13F | Morgan Stanley | 13 412 | 11,94 | 672 | 11,83 | ||||
| 2025-04-25 | 13F | Almanack Investment Partners, LLC. | 0 | −100,00 | 0 | |||||
| 2025-08-06 | 13F | Ethos Financial Group, LLC | 152 381 | −1,66 | 7 633 | −1,76 | ||||
| 2025-08-15 | 13F | Montag & Caldwell, Llc | 7 611 | 381 | ||||||
| 2025-07-07 | 13F | Investors Research Corp | 886 | 0,00 | 44 | 0,00 | ||||
| 2025-07-18 | 13F | Vigilare Wealth Management | 5 056 | −16,60 | 253 | −16,50 | ||||
| 2025-08-14 | 13F | Hilton Capital Management, LLC | 895 924 | −22,16 | 44 877 | −22,24 | ||||
| 2025-08-05 | 13F | Beckerman Institutional, LLC | 35 580 | 5,79 | 2 | 0,00 | ||||
| 2025-08-06 | 13F | True Wealth Design, LLC | 202 742 | 10 155 | ||||||
| 2025-08-13 | 13F | Advocacy Wealth Management Services, LLC | 170 642 | 8,02 | 8 547 | 7,92 | ||||
| 2025-06-27 | NP | Calamos ETF Trust - Calamos Alternative Nasdaq & Bond ETF | 43 281 | 83,33 | 2 166 | 84,81 | ||||
| 2025-08-12 | 13F | Ci Investments Inc. | 330 515 | 21,76 | 17 | 23,08 | ||||
| 2025-08-12 | 13F | Coldstream Capital Management Inc | 0 | −100,00 | 0 | |||||
| 2025-08-11 | 13F | SFI Advisors, LLC | 4 040 | 202 | ||||||
| 2025-07-01 | 13F | Private Client Services, Llc | 46 846 | −5,14 | 2 347 | −5,25 | ||||
| 2025-08-14 | 13F | Wells Fargo & Company/mn | 1 809 304 | 16,66 | 90 628 | 16,55 | ||||
| 2025-08-12 | 13F | Steward Partners Investment Advisory, Llc | 9 766 | 41,15 | 489 | 41,33 | ||||
| 2025-07-31 | 13F | Longview Financial Advisors, Inc. | 38 976 | 2,22 | 1 952 | 2,15 | ||||
| 2025-08-06 | 13F | AE Wealth Management LLC | 4 175 | −94,32 | 209 | −94,33 | ||||
| 2025-08-13 | 13F | BlackDiamond Wealth Management Inc. | 0 | −100,00 | 0 | |||||
| 2025-05-15 | 13F | Integrated Wealth Concepts LLC | 0 | −100,00 | 0 | |||||
| 2025-08-14 | 13F | Whitebox Advisors Llc | 11 306 | 0,00 | 566 | 0,00 | ||||
| 2025-08-12 | 13F | Global Retirement Partners, LLC | 976 | 49 | ||||||
| 2025-08-19 | 13F | Anchor Investment Management, LLC | 42 213 | 8,55 | 2 114 | 8,47 | ||||
| 2025-07-16 | 13F | ORG Wealth Partners, LLC | 345 | 0,00 | 17 | 0,00 | ||||
| 2025-05-09 | 13F | Pnc Financial Services Group, Inc. | 0 | −100,00 | 0 | |||||
| 2025-08-04 | 13F | Hutchinson Capital Management/ca | 255 224 | 30,19 | 12 784 | 30,06 | ||||
| 2025-08-13 | 13F | Lido Advisors, LLC | 6 678 | −18,85 | 335 | −18,93 | ||||
| 2025-05-14 | 13F | Flow Traders U.s. Llc | 0 | −100,00 | 0 | |||||
| 2025-08-14 | 13F | Mml Investors Services, Llc | 1 508 448 | 5,54 | 76 | 5,63 | ||||
| 2025-08-04 | 13F | Assetmark, Inc | 24 | 1 | ||||||
| 2025-08-12 | 13F | LPL Financial LLC | 292 944 | 200,75 | 14 674 | 200,49 | ||||
| 2025-07-17 | 13F | Sound Income Strategies, LLC | 190 | 0,00 | 10 | 0,00 | ||||
| 2025-08-14 | 13F | Riggs Asset Managment Co. Inc. | 141 | 7 | ||||||
| 2025-08-19 | 13F | Cape Investment Advisory, Inc. | 0 | −100,00 | 0 | |||||
| 2025-07-30 | NP | HCYAX - HILTON TACTICAL INCOME FUND Investor Class | 98 745 | 7,30 | 4 900 | 5,90 | ||||
| 2025-08-06 | 13F | Pekin Hardy Strauss, Inc. | 274 063 | 25,82 | 13 728 | 25,69 | ||||
| 2025-05-08 | 13F | We Are One Seven, LLC | 0 | −100,00 | 0 | |||||
| 2025-08-13 | 13F | Schroder Investment Management Group | 15 329 | 5,94 | 768 | 5,94 | ||||
| 2025-08-14 | 13F | First Manhattan Co | 50 000 | 0,00 | 2 504 | −0,12 | ||||
| 2025-08-11 | 13F | HighTower Advisors, LLC | 19 591 | −9,84 | 981 | −9,92 | ||||
| 2025-08-05 | 13F | Bank of New York Mellon Corp | 265 089 | 13 278 | ||||||
| 2025-08-14 | 13F | Evergreen Capital Management Llc | 1 073 502 | 1,38 | 53 772 | 1,28 | ||||
| 2025-08-07 | 13F | Strategy Asset Managers Llc | 4 554 | 0,84 | 228 | 0,88 | ||||
| 2025-08-11 | 13F | Compass Capital Corp /ma/ /adv | 129 870 | −2,41 | 6 514 | −1,44 | ||||
| 2025-08-12 | 13F | Proequities, Inc. | 0 | 0 | ||||||
| 2025-08-14 | 13F | Wiley Bros.-aintree Capital, Llc | 21 423 | −2,46 | 1 070 | −2,55 | ||||
| 2025-08-06 | 13F | Convergence Financial, LLC | 276 099 | 8,98 | 13 830 | 8,87 | ||||
| 2025-07-22 | 13F | Marks Group Wealth Management, Inc | 0 | −100,00 | 0 | |||||
| 2025-07-08 | 13F | Webster Bank, N. A. | 1 000 | 0,00 | 50 | 0,00 | ||||
| 2025-07-09 | 13F | Massmutual Trust Co Fsb/adv | 0 | −100,00 | 0 | |||||
| 2025-08-14 | 13F | Lhm, Inc. | 0 | −100,00 | 0 | |||||
| 2025-08-13 | 13F | Leuthold Group, Llc | 99 986 | −19,32 | 5 008 | −19,41 | ||||
| 2025-07-16 | 13F | Novem Group | 0 | −100,00 | 0 | |||||
| 2025-07-09 | 13F | Stony Point Wealth Management Inc. | 55 241 | −24,59 | 2 767 | −24,65 | ||||
| 2025-07-23 | 13F | Kingswood Wealth Advisors, Llc | 6 288 | 0,00 | 315 | −0,32 | ||||
| 2025-08-26 | NP | LCORX - Leuthold Core Investment Fund Retail Class | 96 074 | 0,00 | 4 812 | −0,10 | ||||
| 2025-08-07 | 13F | Nwam Llc | 151 982 | −12,23 | 7 566 | −12,85 | ||||
| 2025-07-10 | 13F | Stewardship Advisors, LLC | 0 | −100,00 | 0 | |||||
| 2025-08-14 | 13F | Kovitz Investment Group Partners, LLC | 9 980 | 0,00 | 500 | −0,20 | ||||
| 2025-08-14 | 13F | Comerica Bank | 6 483 | 2,06 | 325 | 1,89 | ||||
| 2025-08-14 | 13F | Bank Of America Corp /de/ | 4 682 | −60,43 | 235 | −60,54 | ||||
| 2025-04-10 | 13F | Smith Anglin Financial, LLC | 0 | −100,00 | 0 | |||||
| 2025-07-30 | 13F | Whittier Trust Co | 4 937 | 0,10 | 247 | 0,00 | ||||
| 2025-05-09 | 13F | Atria Wealth Solutions, Inc. | 0 | −100,00 | 0 | |||||
| 2025-08-06 | 13F | First Horizon Advisors, Inc. | 81 | 4 | ||||||
| 2025-08-14 | 13F | Knightsbridge Asset Management, Llc | 551 375 | −3,51 | 27 618 | −3,61 | ||||
| 2025-08-06 | 13F | Csenge Advisory Group | 0 | −100,00 | 0 | |||||
| 2025-08-12 | 13F | Change Path, LLC | 31 595 | 6,04 | 1 583 | 5,96 | ||||
| 2025-07-08 | 13F | Atlas Brown,Inc. | 5 200 | 23,81 | 260 | 23,81 | ||||
| 2025-07-16 | 13F | Maridea Wealth Management LLC | 4 430 | 222 | ||||||
| 2025-07-22 | 13F | Merit Financial Group, LLC | 0 | −100,00 | 0 | |||||
| 2025-08-11 | 13F | Ironsides Asset Advisors, LLC | 7 251 | 15,17 | 363 | 15,24 | ||||
| 2025-08-04 | 13F | Creative Financial Designs Inc /adv | 3 171 | 81,20 | 159 | 81,61 | ||||
| 2025-08-07 | 13F | Proficio Capital Partners LLC | 264 512 | 1,00 | 13 249 | 0,89 | ||||
| 2025-08-18 | 13F | Geneos Wealth Management Inc. | 30 | −99,89 | 2 | −99,93 | ||||
| 2025-08-27 | 13F/A | Brinker Capital Investments, LLC | 60 922 | −36,49 | 3 052 | −36,56 | ||||
| 2025-07-17 | 13F | K2 Financial Inc. | 0 | −100,00 | 0 | |||||
| 2025-08-08 | 13F | Calamos Advisors LLC | 64 144 | 99,30 | 3 213 | 99,13 | ||||
| 2025-08-14 | 13F | CIBC World Markets Inc. | 10 137 | 12,82 | 508 | 12,67 | ||||
| 2025-08-13 | 13F | Truvestments Capital Llc | 47 | 0,00 | 2 | 0,00 | ||||
| 2025-05-15 | 13F | AlphaQ Advisors LLC | 17 719 | 888 | ||||||
| 2025-07-16 | 13F | Diversified Enterprises, LLC | 0 | −100,00 | 0 | |||||
| 2025-07-29 | 13F | Stratos Wealth Partners, LTD. | 0 | −100,00 | 0 | |||||
| 2025-08-13 | 13F | Smith, Moore & Co. | 19 553 | 7,12 | 979 | 6,99 | ||||
| 2025-08-14 | 13F | Family Management Corp | 199 123 | −3,20 | 9 974 | −3,29 | ||||
| 2025-08-26 | 13F | Nautilus Advisors LLC | 18 781 | −15,88 | 941 | −16,00 | ||||
| 2025-08-13 | 13F | Colonial Trust Co / SC | 1 000 | 0,00 | 50 | 0,00 | ||||
| 2025-09-04 | 13F/A | Advisor Group Holdings, Inc. | 18 113 | 1,93 | 907 | 1,80 | ||||
| 2025-08-07 | 13F | Allworth Financial LP | 523 | 26 | ||||||
| 2025-07-30 | 13F | Patten Group, Inc. | 27 821 | 1 394 | ||||||
| 2025-08-14 | 13F | Goldman Sachs Group Inc | 10 942 | 5,90 | 548 | 5,79 | ||||
| 2025-07-24 | 13F | Us Bancorp \de\ | 393 | 20 | ||||||
| 2025-07-07 | 13F | Park Edge Advisors, LLC | 95 797 | 25,00 | 4 798 | 24,88 | ||||
| 2025-07-14 | 13F | AdvisorNet Financial, Inc | 284 | 0,00 | 14 | 0,00 | ||||
| 2025-07-25 | 13F | Sequoia Financial Advisors, LLC | 11 100 | 0,00 | 556 | −0,18 | ||||
| 2025-07-17 | 13F | Janney Montgomery Scott LLC | 118 332 | −4,15 | 6 | −16,67 | ||||
| 2025-07-08 | 13F | GK Wealth Management LLC | 20 864 | −17,06 | 1 045 | −17,13 | ||||
| 2025-08-12 | 13F | Jpmorgan Chase & Co | 123 717 | 4,73 | 6 197 | 4,61 | ||||
| 2025-07-07 | 13F | Peak Financial Advisors Llc | 281 957 | −23,64 | 14 123 | −23,71 | ||||
| 2025-04-29 | 13F | Brookstone Capital Management | 0 | −100,00 | 0 | |||||
| 2025-08-14 | 13F | Horizon Investments, LLC | 274 362 | 193,30 | 13 674 | 193,06 | ||||
| 2025-08-14 | 13F | L2 Asset Management, LLC | 215 050 | 12,17 | 10 772 | 12,06 | ||||
| 2025-08-14 | 13F | Harmony Asset Management Llc | 32 950 | −2,08 | 1 650 | −2,19 | ||||
| 2025-07-18 | 13F | PFG Investments, LLC | 7 146 | 7,22 | 358 | 6,89 | ||||
| 2025-08-14 | 13F | Citadel Advisors Llc | 9 273 | −85,32 | 464 | −85,35 | ||||
| 2025-07-23 | 13F | Charter Trust Co | 297 952 | 6,85 | 14 924 | 6,74 | ||||
| 2025-07-21 | 13F | Ameritas Advisory Services, LLC | 1 954 | −90,02 | 98 | −90,02 | ||||
| 2025-08-12 | 13F | Bokf, Na | 745 | 0,00 | 37 | 0,00 | ||||
| 2025-07-29 | 13F | Straight Path Wealth Management | 6 440 | −7,47 | 323 | −7,47 | ||||
| 2025-08-12 | 13F | SRS Capital Advisors, Inc. | 1 020 | −4,67 | 51 | −3,77 | ||||
| 2025-07-25 | 13F | Envestnet Portfolio Solutions, Inc. | 80 969 | 122,08 | 4 056 | 121,83 | ||||
| 2025-07-23 | 13F | Narwhal Capital Management | 71 250 | 22,17 | 3 569 | 22,02 | ||||
| 2025-08-07 | 13F | Cahill Financial Advisors Inc | 0 | −100,00 | 0 |