Grundläggande statistik
| Institutionella ägare | 183 total, 183 long only, 0 short only, 0 long/short - change of −3,65% MRQ |
| Genomsnittlig portföljallokering | 0.3313 % - change of −55,09% MRQ |
| Institutionella aktier (lång) | 58 437 185 (ex 13D/G) - change of −1,24MM shares −2,07% MRQ |
| Institutionellt värde (lång) | $ 411 529 USD ($1000) |
Institutionellt ägande och aktieägare
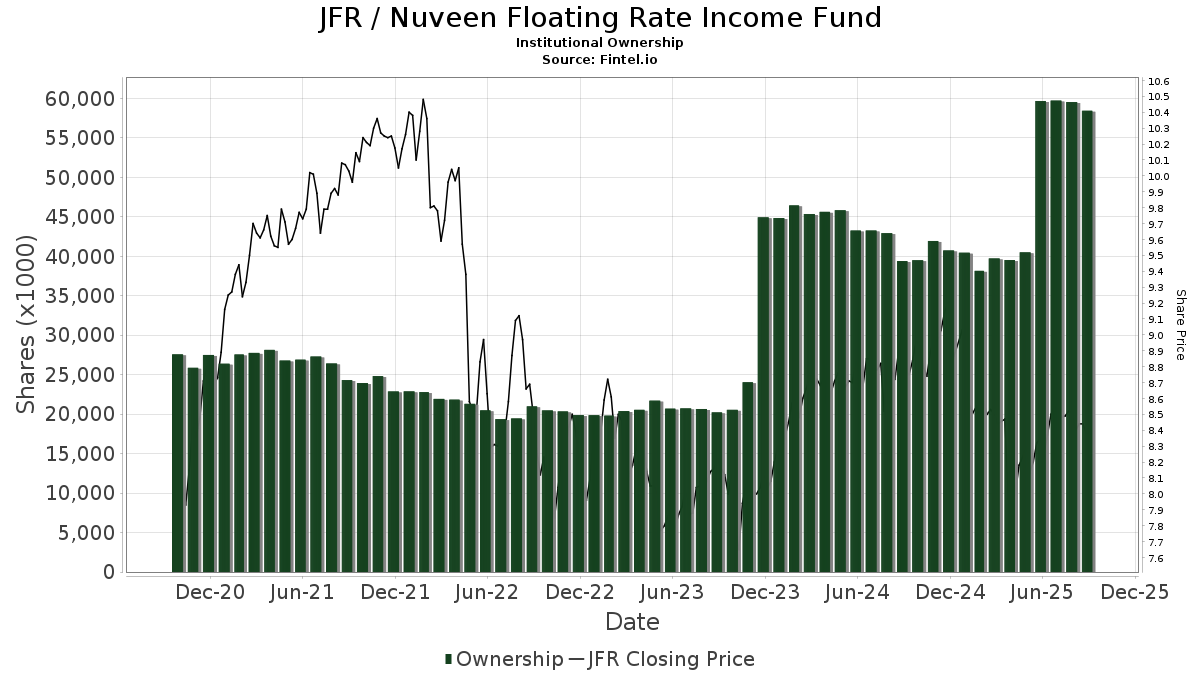
Nuveen Floating Rate Income Fund (US:JFR) har 183 Institutionella ägare och aktieägare som har lämnat in 13D/G- eller 13F-formulär till Securities Exchange Commission (SEC). Dessa institut innehar totalt 58,437,185 aktier. Största aktieägare inkluderar Morgan Stanley, Sit Investment Associates Inc, Mariner Investment Group Llc, Congress Park Capital LLC, LPL Financial LLC, Invesco Ltd., Bank Of America Corp /de/, Guggenheim Capital Llc, Penserra Capital Management LLC, and YYY - Amplify High Income ETF .
Nuveen Floating Rate Income Fund (NYSE:JFR) Institutionell ägarstruktur visar institutioners och fonders nuvarande positioner i företaget, samt de senaste förändringarna i positionernas storlek. Större aktieägare kan vara enskilda investerare, fonder, hedgefonder eller institutioner. Bilaga 13D visar att investeraren äger (eller ägde) mer än 5% av företaget och avser (eller avsåg) att aktivt eftersträva en förändring av affärsstrategin. Schedule 13G indikerar en passiv investering på över 5%.
The share price as of September 12, 2025 is 8,39 / share. Previously, on September 16, 2024, the share price was 8,81 / share. This represents a decline of 4,77% over that period.
Fondsentimentets poäng
Fondsentimentet poängen(fka Ägarackumulation-poäng) visar vilka aktier som är mest köpta av fonder. Det är resultatet av en sofistikerad kvantitativ flerfaktormodell som identifierar företag med de högsta nivåerna av institutionell ackumulering. Poängsättningsmodellen använder en kombination av den totala ökningen av redovisade ägare, förändringarna i portföljallokeringarna för dessa ägare och andra mått. Siffran sträcker sig från 0 till 100, där högre siffror indikerar en högre nivå av ackumulering i förhållande till sina konkurrenter, och 50 är genomsnittet.
Uppdateringsfrekvens: Dagligen
Se Ownership Explorer, som innehåller en lista över de högst rankade företagen.
Institutionell sälj/köp-kvot
Förutom att rapportera vanliga eget kapital- och skuldemissioner måste institutioner med mer än 100MM tillgångar under förvaltning också avslöja sina innehav av sälj- och köpoptioner. Eftersom säljoptioner i allmänhet indikerar ett negativt sentiment och köpoptioner indikerar ett positivt sentiment, kan vi få en uppfattning om det övergripande institutionella sentimentet genom att plotta förhållandet mellan säljoptioner och köpoptioner. Diagrammet till höger visar det historiska förhållandet mellan sälj- och köpoptioner för detta instrument.
Genom att använda sälj/köp-kvoten som en indikator på aktieägarnas sentiment undviker man en av de största bristerna med att använda det totala institutionella ägandet, nämligen att en betydande del av de förvaltade tillgångarna investeras passivt för att följa index. Passivt förvaltade fonder köper vanligtvis inte optioner, så indikatorn för sälj/köp-kvoten ger en bättre bild av stämningen i aktivt förvaltade fonder.

13F- och NPORT-arkiveringar
Detaljer om 13F-arkiveringar är gratis. Detaljer om NP-arkiveringar kräver ett premiummedlemskap. Gröna rader indikerar nya positioner. Röda rader indikerar stängda positioner. Klicka på länk symbolen för att se hela transaktionshistoriken.
Uppgradera
för att låsa upp premiumdata och exportera till Excel ![]() .
.
| Fil Datum | Källa | Investerare | Typ | Genomsnittligt pris (beräknat) |
Aktier | Δ Aktier (%) |
Rapporterat värde (1000 USD) |
Δ Värde (%) |
Portföljallokering (%) |
|
|---|---|---|---|---|---|---|---|---|---|---|
| 2025-04-22 | 13F | Synergy Financial Management, LLC | 0 | −100,00 | 0 | |||||
| 2025-07-15 | 13F | World Equity Group, Inc. | 43 973 | 7,13 | 372 | 7,20 | ||||
| 2025-07-07 | 13F | Thurston, Springer, Miller, Herd & Titak, Inc. | 8 417 | 15,03 | 71 | 16,39 | ||||
| 2025-07-16 | 13F | Signaturefd, Llc | 136 | 3,03 | 1 | 0,00 | ||||
| 2025-07-29 | 13F | International Assets Investment Management, Llc | 282 433 | 11,61 | 2 392 | 11,62 | ||||
| 2025-07-31 | 13F | Gill Capital Partners, Llc | 95 687 | −3,01 | 810 | −2,99 | ||||
| 2025-08-14 | 13F | GWM Advisors LLC | 148 127 | −4,41 | 1 255 | −4,42 | ||||
| 2025-08-14 | 13F | Royal Bank Of Canada | 1 167 755 | 0,20 | 9 890 | 0,20 | ||||
| 2025-04-21 | 13F | Nelson, Van Denburg & Campbell Wealth Management Group, LLC | 0 | −100,00 | 0 | |||||
| 2025-08-13 | 13F | Cerity Partners LLC | 39 826 | −24,61 | 337 | −24,61 | ||||
| 2025-08-12 | 13F | Advisors Asset Management, Inc. | 1 128 692 | 3,23 | 9 560 | 3,24 | ||||
| 2025-08-05 | 13F | Mission Wealth Management, Lp | 32 953 | −4,30 | 279 | −4,12 | ||||
| 2025-07-24 | 13F | Accredited Investor Services, Llc | 26 605 | 0,55 | 225 | 0,45 | ||||
| 2025-08-14 | 13F | Mercer Global Advisors Inc /adv | 94 280 | −55,72 | 799 | −55,74 | ||||
| 2025-08-06 | 13F | Tabor Asset Management, LP | 0 | −100,00 | 0 | −100,00 | ||||
| 2025-08-13 | 13F | Cary Street Partners Financial Llc | 10 432 | 0,00 | 88 | 0,00 | ||||
| 2025-08-13 | 13F | Level Four Advisory Services, Llc | 14 032 | 2,41 | 119 | 1,72 | ||||
| 2025-08-14 | 13F | CF Capital LLC | 60 460 | −28,32 | 510 | −25,04 | ||||
| 2025-08-14 | 13F | UBS Group AG | 984 051 | 7,00 | 8 335 | 7,00 | ||||
| 2025-07-30 | 13F | Cullen/frost Bankers, Inc. | 15 000 | 0,00 | 127 | 0,00 | ||||
| 2025-08-15 | 13F | Kestra Advisory Services, LLC | 71 767 | 146,49 | 608 | 146,75 | ||||
| 2025-07-15 | 13F | Absolute Investment Advisers Llc | 0 | −100,00 | 0 | |||||
| 2025-08-15 | 13F | Captrust Financial Advisors | 18 274 | −22,57 | 155 | −22,61 | ||||
| 2025-07-10 | 13F | Redhawk Wealth Advisors, Inc. | 0 | −100,00 | 0 | |||||
| 2025-07-25 | 13F | Investment Advisory Group, LLC | 18 001 | 0,00 | 152 | 0,00 | ||||
| 2025-08-13 | 13F | StoneX Group Inc. | 13 862 | −43,17 | 117 | −43,20 | ||||
| 2025-08-13 | 13F | Financial & Tax Architects, LLC | 53 034 | 182,74 | 449 | 184,18 | ||||
| 2025-08-12 | 13F | Proequities, Inc. | 0 | 0 | ||||||
| 2025-08-12 | 13F | Steward Partners Investment Advisory, Llc | 57 730 | 0,30 | 489 | 0,21 | ||||
| 2025-07-17 | 13F | Janney Montgomery Scott LLC | 93 438 | 0,56 | 1 | |||||
| 2025-05-12 | 13F | Hantz Financial Services, Inc. | 0 | −100,00 | 0 | |||||
| 2025-07-25 | NP | FCEF - First Trust CEF Income Opportunity ETF This fund is a listed as child fund of First Trust Advisors Lp and if that institution has disclosed ownership in this security, then these positions will not be double counted when calculating total shares and total value | 40 291 | −43,91 | 333 | −49,16 | ||||
| 2025-07-15 | 13F | Kanen Wealth Management LLC | 138 450 | 1 173 | ||||||
| 2025-07-29 | 13F | Burford Brothers, Inc. | 13 070 | 0,00 | 111 | 0,00 | ||||
| 2025-05-20 | 13F/A | Colony Group, LLC | 0 | −100,00 | 0 | −100,00 | ||||
| 2025-08-13 | 13F | Collar Capital Management, LLC | 57 955 | −1,02 | 491 | −1,01 | ||||
| 2025-08-14 | 13F | Jane Street Group, Llc | 63 664 | 51,36 | 539 | 51,40 | ||||
| 2025-08-11 | 13F | TD Waterhouse Canada Inc. | 2 000 | 0,00 | 17 | 0,00 | ||||
| 2025-08-01 | 13F | Envestnet Asset Management Inc | 717 177 | 4,22 | 6 074 | 4,22 | ||||
| 2025-08-28 | NP | YYY - Amplify High Income ETF | 2 065 118 | 2,00 | 17 492 | 1,99 | ||||
| 2025-07-16 | 13F | Mariner Investment Group Llc | 3 959 544 | −17,34 | 33 537 | −17,34 | ||||
| 2025-08-12 | 13F | SRS Capital Advisors, Inc. | 0 | −100,00 | 0 | |||||
| 2025-07-08 | 13F | Nbc Securities, Inc. | 550 | 0,00 | 0 | |||||
| 2025-08-14 | 13F | Coastal Bridge Advisors, LLC | 535 006 | −5,41 | 4 532 | −5,41 | ||||
| 2025-08-14 | 13F | Robinson Capital Management, Llc | 60 480 | 0,00 | 512 | 0,00 | ||||
| 2025-08-12 | 13F | LPL Financial LLC | 2 792 247 | 1,92 | 23 650 | 1,92 | ||||
| 2025-08-12 | 13F | XTX Topco Ltd | 63 998 | 1,74 | 542 | 1,88 | ||||
| 2025-07-17 | 13F | Melfa Wealth Management, Llc | 107 234 | 0,00 | 908 | 0,00 | ||||
| 2025-07-31 | 13F | Cambridge Investment Research Advisors, Inc. | 236 866 | −1,76 | 2 | 0,00 | ||||
| 2025-05-14 | 13F | Natixis | 0 | −100,00 | 0 | |||||
| 2025-08-13 | 13F | Invesco Ltd. | 2 683 125 | 0,77 | 22 726 | 0,77 | ||||
| 2025-08-15 | 13F | Prevail Innovative Wealth Advisors, Llc | 191 938 | 130,09 | 1 626 | 130,17 | ||||
| 2025-08-05 | 13F | Bank Of Montreal /can/ | 191 695 | 10,64 | 1 624 | 10,63 | ||||
| 2025-08-27 | NP | ACEFX - Absolute Strategies Fund Institutional Shares | 0 | −100,00 | 0 | −100,00 | ||||
| 2025-08-12 | 13F | Kimelman & Baird, LLC | 1 823 | 0,00 | 15 | 0,00 | ||||
| 2025-08-07 | 13F | Samalin Investment Counsel, LLC | 0 | −100,00 | 0 | |||||
| 2025-08-05 | 13F | Sigma Planning Corp | 86 889 | −8,33 | 736 | −8,35 | ||||
| 2025-08-12 | 13F | Coldstream Capital Management Inc | 0 | −100,00 | 0 | |||||
| 2025-08-04 | 13F | HBK Sorce Advisory LLC | 30 895 | −9,66 | 262 | −9,69 | ||||
| 2025-08-13 | 13F | First Trust Advisors Lp | 57 247 | 485 | ||||||
| 2025-05-05 | 13F | Lindbrook Capital, Llc | 120 | 0,00 | 1 | 0,00 | ||||
| 2025-06-27 | NP | Calamos ETF Trust - Calamos CEF Income & Arbitrage ETF | 38 180 | 312 | ||||||
| 2025-08-05 | 13F | Bank of New York Mellon Corp | 12 014 | −32,71 | 102 | −33,11 | ||||
| 2025-08-06 | 13F | Commonwealth Equity Services, Llc | 393 471 | −9,69 | 3 | 0,00 | ||||
| 2025-08-13 | 13F | QSV Equity Investors LLC | 16 576 | 0,00 | 140 | 0,00 | ||||
| 2025-08-08 | 13F | Larson Financial Group LLC | 570 | 5 | ||||||
| 2025-08-12 | 13F | Gladstone Institutional Advisory LLC | 78 780 | 1,16 | 667 | 1,21 | ||||
| 2025-04-15 | 13F | Noble Wealth Management PBC | 900 | 8 | ||||||
| 2025-07-30 | 13F | Bogart Wealth, LLC | 1 578 | 0,00 | 13 | 0,00 | ||||
| 2025-07-29 | 13F | Chicago Partners Investment Group LLC | 13 412 | −26,21 | 114 | −24,16 | ||||
| 2025-08-13 | 13F | Virtus Investment Advisers, Inc. | 106 150 | −18,76 | 899 | −18,72 | ||||
| 2025-08-27 | NP | RYDEX VARIABLE TRUST - Multi-Hedge Strategies Fund Variable Annuity | 375 | 3 | ||||||
| 2025-06-25 | NP | VPC - Virtus Private Credit Strategy ETF | 119 355 | 14,88 | 976 | 9,29 | ||||
| 2025-07-10 | 13F | Wealth Enhancement Advisory Services, Llc | 81 774 | 0,09 | 696 | 0,58 | ||||
| 2025-07-21 | 13F | Ameritas Advisory Services, LLC | 17 614 | 0,18 | 149 | −4,49 | ||||
| 2025-08-07 | 13F | New England Private Wealth Advisors LLC | 23 631 | −38,81 | 201 | −38,84 | ||||
| 2025-08-12 | 13F | Bokf, Na | 2 376 | 0,00 | 20 | 0,00 | ||||
| 2025-08-14 | 13F | Bramshill Investments, LLC | 112 075 | 0,83 | 949 | 0,85 | ||||
| 2025-08-13 | 13F | Rsm Us Wealth Management Llc | 160 075 | −10,30 | 1 364 | −10,62 | ||||
| 2025-09-09 | 13F | NWF Advisory Services Inc. | 44 101 | 9,59 | 374 | 9,71 | ||||
| 2025-08-12 | 13F | Park Square Financial Group, LLC | 4 508 | 0,00 | 38 | 0,00 | ||||
| 2025-08-14 | 13F | Bank Of America Corp /de/ | 2 547 116 | 4,19 | 21 574 | 4,19 | ||||
| 2025-08-14 | 13F | Mariner, LLC | 33 160 | −2,46 | 281 | −2,44 | ||||
| 2025-08-13 | 13F | Icon Advisers Inc/co | 385 191 | −36,65 | 3 263 | −36,66 | ||||
| 2025-08-15 | 13F | Tower Research Capital LLC (TRC) | 0 | −100,00 | 0 | |||||
| 2025-07-16 | 13F | St Germain D J Co Inc | 0 | 0 | ||||||
| 2025-08-18 | 13F | Geneos Wealth Management Inc. | 22 139 | 2,75 | 188 | 2,75 | ||||
| 2025-07-24 | 13F | Conning Inc. | 43 050 | 0,00 | 365 | 0,00 | ||||
| 2025-04-29 | 13F | Raleigh Capital Management Inc. | 0 | −100,00 | 0 | −100,00 | ||||
| 2025-08-18 | 13F | Hollencrest Capital Management | 5 963 | 3,09 | 51 | 4,17 | ||||
| 2025-07-30 | 13F | D.a. Davidson & Co. | 22 064 | −20,77 | 187 | −20,85 | ||||
| 2025-08-11 | 13F | Edgemoor Investment Advisors, Inc. | 71 577 | −3,95 | 606 | −3,96 | ||||
| 2025-07-09 | 13F | Westbourne Investments, Inc. | 13 950 | 7,72 | 118 | 8,26 | ||||
| 2025-08-08 | 13F | Avantax Advisory Services, Inc. | 145 407 | 1,28 | 1 232 | 1,23 | ||||
| 2025-07-07 | 13F | Wealth Alliance Advisory Group, LLC | 11 741 | 0,00 | 99 | 0,00 | ||||
| 2025-07-09 | 13F | Byrne Asset Management LLC | 1 666 | 150,15 | 14 | 180,00 | ||||
| 2025-08-14 | 13F | MGB Wealth Management, LLC | 11 349 | −52,11 | 96 | −53,40 | ||||
| 2025-08-26 | 13F/A | Thrivent Financial For Lutherans | 128 855 | 1,65 | 1 | 0,00 | ||||
| 2025-08-11 | 13F | Platform Technology Partners | 14 051 | 0,00 | 119 | 0,00 | ||||
| 2025-06-30 | NP | CVY - Invesco Zacks Multi-Asset Income ETF This fund is a listed as child fund of Invesco Ltd. and if that institution has disclosed ownership in this security, then these positions will not be double counted when calculating total shares and total value | 146 947 | 26,91 | 1 202 | 20,80 | ||||
| 2025-07-22 | 13F | Fortitude Advisory Group L.L.C. | 42 687 | 0,00 | 362 | 6,80 | ||||
| 2025-08-14 | 13F | Boston Private Wealth Llc | 0 | −100,00 | 0 | |||||
| 2025-07-28 | 13F | Harbour Investments, Inc. | 100 898 | 9,93 | 855 | 9,91 | ||||
| 2025-07-31 | 13F | Oppenheimer & Co Inc | 94 945 | −4,39 | 804 | −4,40 | ||||
| 2025-05-05 | 13F | Hazlett, Burt & Watson, Inc. | 0 | −100,00 | 0 | |||||
| 2025-08-05 | 13F | Seelaus Asset Management LLC | 69 041 | 0,27 | 585 | 0,17 | ||||
| 2025-08-08 | 13F | City Of London Investment Management Co Ltd | 35 523 | 17,04 | 301 | 16,73 | ||||
| 2025-08-13 | 13F | Baird Financial Group, Inc. | 612 455 | −0,09 | 5 187 | −0,08 | ||||
| 2025-07-18 | 13F | Truist Financial Corp | 0 | −100,00 | 0 | |||||
| 2025-07-16 | 13F | ORG Partners LLC | 36 485 | −0,46 | 310 | −0,64 | ||||
| 2025-08-06 | 13F | Ethos Financial Group, LLC | 700 086 | −4,43 | 5 930 | −4,43 | ||||
| 2025-07-11 | 13F | Grove Bank & Trust | 20 000 | −60,00 | 169 | −60,05 | ||||
| 2025-08-29 | 13F | Evolution Wealth Management Inc. | 333 | 3 | ||||||
| 2025-08-12 | 13F | Quadcap Wealth Management, LLC | 25 663 | 0,00 | 217 | 0,00 | ||||
| 2025-08-14 | 13F | Wells Fargo & Company/mn | 627 954 | −3,42 | 5 319 | −3,43 | ||||
| 2025-08-11 | 13F | HighTower Advisors, LLC | 28 055 | −9,06 | 238 | −9,20 | ||||
| 2025-08-13 | 13F | GM Advisory Group, Inc. | 11 950 | 0,00 | 101 | 0,00 | ||||
| 2025-08-05 | 13F | Huntington National Bank | 0 | |||||||
| 2025-08-11 | 13F | Elequin Capital Lp | 9 346 | 79 | ||||||
| 2025-08-07 | 13F | Allworth Financial LP | 4 919 | 77,52 | 42 | 86,36 | ||||
| 2025-08-15 | 13F | Morgan Stanley | 7 622 877 | 0,63 | 64 566 | 0,62 | ||||
| 2025-08-05 | 13F | GPS Wealth Strategies Group, LLC | 2 960 | 0,00 | 25 | 0,00 | ||||
| 2025-08-12 | 13F | CIBC Private Wealth Group, LLC | 1 | 0,00 | 0 | |||||
| 2025-08-27 | NP | RBNAX - Robinson Opportunistic Income Fund Class A Shares | 60 000 | 0,00 | 508 | 0,00 | ||||
| 2025-08-06 | 13F | Penserra Capital Management LLC | 2 086 378 | 3,05 | 18 | 0,00 | ||||
| 2025-08-05 | 13F | Shaker Financial Services, LLC | 86 857 | −16,61 | 743 | −16,61 | ||||
| 2025-08-14 | 13F | Wealth Preservation Advisors, LLC | 965 | 0,00 | 8 | 0,00 | ||||
| 2025-08-14 | 13F | Integrated Wealth Concepts LLC | 32 014 | −3,38 | 271 | −3,21 | ||||
| 2025-08-27 | NP | RYMSX - Guggenheim Multi-Hedge Strategies Fund Class P | 223 | 2 | ||||||
| 2025-07-31 | 13F | Glass Jacobson Investment Advisors llc | 0 | −100,00 | 0 | |||||
| 2025-07-29 | 13F | Stratos Wealth Partners, LTD. | 25 050 | 212 | ||||||
| 2025-08-14 | 13F | CoreCap Advisors, LLC | 43 145 | −11,66 | 365 | −11,62 | ||||
| 2025-05-16 | 13F | Coppell Advisory Solutions LLC | 0 | −100,00 | 0 | |||||
| 2025-08-11 | 13F | Nations Financial Group Inc, /ia/ /adv | 23 914 | 4,16 | 203 | 4,12 | ||||
| 2025-08-07 | 13F | Readystate Asset Management Lp | 46 975 | 398 | ||||||
| 2025-08-14 | 13F | Diversify Wealth Management, Llc | 27 201 | 0,00 | 231 | 4,55 | ||||
| 2025-07-18 | 13F | Trilogy Capital Inc. | 14 967 | 0,00 | 127 | 0,00 | ||||
| 2025-08-14 | 13F | Comerica Bank | 16 530 | −56,61 | 140 | −56,52 | ||||
| 2025-05-15 | 13F | Logan Stone Capital, LLC | 0 | −100,00 | 0 | |||||
| 2025-08-05 | 13F | Aviance Capital Partners, LLC | 174 449 | −2,05 | 1 478 | −2,06 | ||||
| 2025-07-24 | 13F | Us Bancorp \de\ | 2 000 | −56,87 | 17 | −58,97 | ||||
| 2025-08-08 | 13F | Calamos Advisors LLC | 38 180 | −8,00 | 323 | −7,98 | ||||
| 2025-08-14 | 13F | Two Sigma Securities, Llc | 0 | −100,00 | 0 | |||||
| 2025-07-14 | 13F | E&G Advisors, LP | 37 619 | −1,57 | 319 | −1,55 | ||||
| 2025-08-04 | 13F | Kovack Advisors, Inc. | 87 579 | 47,25 | 742 | 47,32 | ||||
| 2025-07-25 | 13F | Cwm, Llc | 1 405 | −25,35 | 0 | |||||
| 2025-07-29 | 13F | Koshinski Asset Management, Inc. | 57 257 | 0,00 | 485 | 0,00 | ||||
| 2025-08-11 | 13F | WPG Advisers, LLC | 3 734 | −18,42 | 32 | −18,42 | ||||
| 2025-08-14 | 13F | Sit Investment Associates Inc | 5 988 753 | −8,56 | 51 | −9,09 | ||||
| 2025-05-15 | 13F | Pathstone Holdings, LLC | 0 | −100,00 | 0 | |||||
| 2025-08-14 | 13F | Raymond James Financial Inc | 1 357 250 | −3,94 | 11 496 | −3,94 | ||||
| 2025-08-12 | 13F | Global Retirement Partners, LLC | 1 985 | 5,19 | 17 | 0,00 | ||||
| 2025-08-14 | 13F | Cohen & Steers, Inc. | 853 263 | 0,00 | 7 | 0,00 | ||||
| 2025-08-05 | 13F | Carolinas Wealth Consulting Llc | 0 | −100,00 | 0 | −100,00 | ||||
| 2025-08-04 | 13F | Spire Wealth Management | 46 050 | 338,57 | 390 | 343,18 | ||||
| 2025-07-07 | 13F | Centurion Wealth Management LLC | 23 924 | 0,00 | 203 | −5,16 | ||||
| 2025-08-13 | 13F | Northwestern Mutual Wealth Management Co | 1 688 | 94,02 | 14 | 100,00 | ||||
| 2025-07-10 | 13F | Andrew Hill Investment Advisors, Inc. | 108 134 | −25,37 | 916 | −25,43 | ||||
| 2025-07-24 | 13F | Cyndeo Wealth Partners, LLC | 1 808 320 | 25,23 | 15 316 | 25,23 | ||||
| 2025-08-08 | 13F | Cetera Investment Advisers | 220 059 | 8,41 | 1 864 | 8,38 | ||||
| 2025-08-14 | 13F | Ameriprise Financial Inc | 637 244 | 3,34 | 5 400 | 3,35 | ||||
| 2025-08-13 | 13F | Jones Road Capital Management, L.p. | 0 | −100,00 | 0 | |||||
| 2025-07-24 | 13F | Ronald Blue Trust, Inc. | 540 | 5 | ||||||
| 2025-08-14 | 13F | Quarry LP | 0 | −100,00 | 0 | |||||
| 2025-07-15 | 13F | Sheets Smith Wealth Management | 36 010 | 0,00 | 305 | 0,00 | ||||
| 2025-08-15 | 13F | Binnacle Investments Inc | 3 337 | 0,00 | 28 | 0,00 | ||||
| 2025-08-11 | 13F | Private Advisor Group, LLC | 24 505 | 4,87 | 208 | 5,08 | ||||
| 2025-08-14 | 13F | CoreFirst Bank & Trust | 3 742 | 32 | ||||||
| 2025-08-12 | 13F | Calton & Associates, Inc. | 43 420 | 5,03 | 368 | 4,86 | ||||
| 2025-04-30 | 13F | Parr Mcknight Wealth Management Group, Llc | 0 | −100,00 | 0 | |||||
| 2025-08-13 | 13F | Yakira Capital Management, Inc. | 432 247 | −30,92 | 3 661 | −30,91 | ||||
| 2025-08-12 | 13F | J.w. Cole Advisors, Inc. | 359 399 | 10,63 | 3 044 | 10,65 | ||||
| 2025-05-14 | 13F | Virtus ETF Advisers LLC | 0 | −100,00 | 0 | |||||
| 2025-07-11 | 13F | Congress Park Capital LLC | 2 818 767 | 16,40 | 23 875 | 16,40 | ||||
| 2025-08-08 | 13F | Pnc Financial Services Group, Inc. | 3 518 | −72,34 | 30 | −72,90 | ||||
| 2025-08-04 | 13F | Assetmark, Inc | 62 | −53,03 | 1 | −100,00 | ||||
| 2025-08-20 | NP | LSPAX - LoCorr Spectrum Income Fund Class A | 102 678 | 0,00 | 870 | 0,00 | ||||
| 2025-07-21 | 13F | Ameriflex Group, Inc. | 1 111 | −67,04 | 9 | −67,86 | ||||
| 2025-08-12 | 13F | Landscape Capital Management, L.l.c. | 131 286 | 1 112 | ||||||
| 2025-09-04 | 13F/A | Advisor Group Holdings, Inc. | 253 232 | 5,03 | 2 145 | 5,00 | ||||
| 2025-08-14 | 13F/A | Rockefeller Capital Management L.P. | 979 638 | −0,54 | 8 298 | −0,54 | ||||
| 2025-08-27 | NP | THRIVENT SERIES FUND INC - Thrivent Opportunity Income Plus Portfolio Class A | 1 581 | 0,00 | 13 | 0,00 | ||||
| 2025-08-13 | 13F | Thomas J. Herzfeld Advisors, Inc. | 1 331 047 | 13,48 | 11 274 | 13,48 | ||||
| 2025-07-21 | 13F | Barrett & Company, Inc. | 2 467 | 0,00 | 21 | 0,00 | ||||
| 2025-07-28 | 13F | RFG Advisory, LLC | 384 971 | 0,27 | 3 261 | 0,28 | ||||
| 2025-07-29 | 13F | Stratos Wealth Advisors, LLC | 13 364 | 3,12 | 113 | 3,67 | ||||
| 2025-08-14 | 13F | Ieq Capital, Llc | 10 378 | 0,00 | 88 | 0,00 | ||||
| 2025-07-17 | 13F | GraniteShares Advisors LLC | 310 253 | 6,67 | 2 628 | 6,66 | ||||
| 2025-07-15 | 13F | Shulman DeMeo Asset Management LLC | 21 639 | −0,21 | 183 | 0,00 | ||||
| 2025-08-14 | 13F | Citadel Advisors Llc | 0 | −100,00 | 0 | |||||
| 2025-08-14 | 13F | Mml Investors Services, Llc | 13 568 | −38,34 | 0 | |||||
| 2025-07-30 | NP | HYIN - WisdomTree Alternative Income Fund N/A | 213 295 | 19,24 | 1 764 | 15,61 | ||||
| 2025-08-19 | 13F | Advisory Services Network, LLC | 105 501 | 8,87 | 899 | 9,51 | ||||
| 2025-08-14 | 13F | Wetherby Asset Management Inc | 19 382 | −30,02 | 164 | −33,60 | ||||
| 2025-05-16 | 13F/A | Goldman Sachs Group Inc | 0 | −100,00 | 0 | −100,00 | ||||
| 2025-07-11 | 13F | Farther Finance Advisors, LLC | 15 287 | 0,31 | 129 | 0,00 | ||||
| 2025-07-15 | 13F | RVW Wealth, LLC | 40 349 | 0,00 | 342 | 0,00 | ||||
| 2025-08-25 | NP | IOBAX - ICON FLEXIBLE BOND FUND Investor Class | 490 746 | −19,29 | 4 157 | −19,30 | ||||
| 2025-08-13 | 13F | Guggenheim Capital Llc | 2 089 952 | 4,85 | 17 702 | 4,85 | ||||
| 2025-04-16 | 13F/A | Western Wealth Management, LLC | 0 | −100,00 | 0 | |||||
| 2025-08-14 | 13F | Susquehanna International Group, Llp | 0 | −100,00 | 0 | |||||
| 2025-05-14 | 13F | Snowden Capital Advisors LLC | 0 | −100,00 | 0 | −100,00 | ||||
| 2025-07-25 | 13F | Concurrent Investment Advisors, LLC | 56 021 | 8,43 | 474 | 8,47 | ||||
| 2025-07-28 | NP | PCEF - Invesco CEF Income Composite ETF This fund is a listed as child fund of Invesco Ltd. and if that institution has disclosed ownership in this security, then these positions will not be double counted when calculating total shares and total value | 1 969 482 | 50,50 | 16 288 | 45,91 | ||||
| 2025-08-11 | 13F | Principal Securities, Inc. | 6 216 | 9,49 | 53 | 4,00 | ||||
| 2025-05-12 | 13F | Kane Investment Management, Inc. | 0 | −100,00 | 0 | |||||
| 2025-08-14 | 13F | Stifel Financial Corp | 78 614 | 20,35 | 666 | 20,25 | ||||
| 2025-07-17 | 13F | Camelot Portfolios, LLC | 16 550 | 0,00 | 140 | 0,00 | ||||
| 2025-08-13 | 13F | Summit Financial, LLC | 14 091 | 121 | ||||||
| 2025-06-26 | NP | AAINX - Thrivent Opportunity Income Plus Fund Class A | 4 088 | 0,00 | 33 | −5,71 | ||||
| 2025-07-30 | 13F | FNY Investment Advisers, LLC | 1 200 | 0,00 | 0 | |||||
| 2025-07-14 | 13F | Park Avenue Securities Llc | 17 586 | −0,97 | 0 | |||||
| 2025-07-22 | 13F | Merit Financial Group, LLC | 20 076 | 13,73 | 170 | 14,09 | ||||
| 2025-08-06 | 13F | Wedbush Securities Inc | 27 116 | −36,19 | 0 | |||||
| 2025-07-17 | 13F/A | Capital Investment Advisors, LLC | 259 161 | −2,59 | 2 195 | −2,57 | ||||
| 2025-08-05 | 13F | Next Capital Management LLC | 29 789 | 252 | ||||||
| 2025-08-29 | NP | GraniteShares ETF Trust - GraniteShares HIPS US High Income ETF | 310 253 | 6,67 | 2 628 | 6,66 | ||||
| 2025-04-25 | 13F | Albion Financial Group /ut | 0 | −100,00 | 0 | |||||
| 2025-08-08 | 13F | ProVise Management Group, LLC | 15 194 | 0,00 | 129 | 0,00 | ||||
| 2025-08-12 | 13F | Horizon Kinetics Asset Management Llc | 143 818 | 0,00 | 1 218 | 0,00 |