Grundläggande statistik
| Institutionella ägare | 273 total, 273 long only, 0 short only, 0 long/short - change of 1,11% MRQ |
| Genomsnittlig portföljallokering | 0.0817 % - change of −21,72% MRQ |
| Institutionella aktier (lång) | 32 347 736 (ex 13D/G) - change of 0,35MM shares 1,10% MRQ |
| Institutionellt värde (lång) | $ 2 749 629 USD ($1000) |
Institutionellt ägande och aktieägare
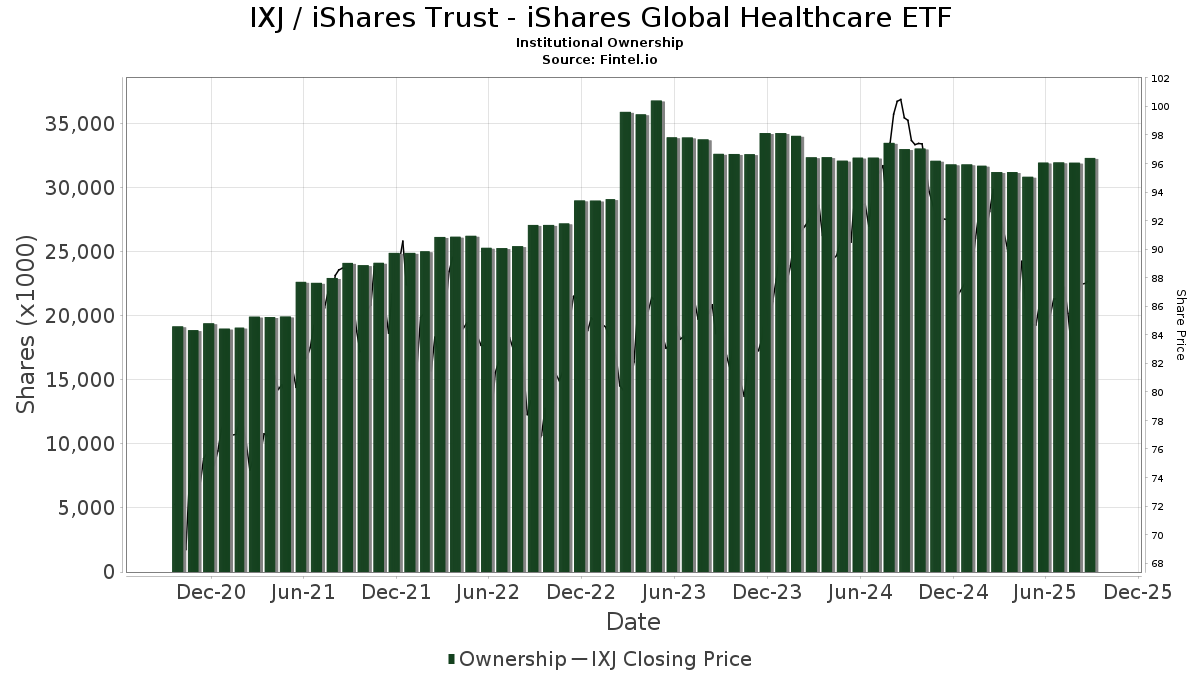
iShares Trust - iShares Global Healthcare ETF (US:IXJ) har 273 Institutionella ägare och aktieägare som har lämnat in 13D/G- eller 13F-formulär till Securities Exchange Commission (SEC). Dessa institut innehar totalt 32,347,736 aktier. Största aktieägare inkluderar BlackRock, Inc., Fisher Asset Management, LLC, Bank Of America Corp /de/, Richard Bernstein Advisors LLC, Phoenix Holdings Ltd., Ameriprise Financial Inc, Jpmorgan Chase & Co, Morgan Stanley, Federation des caisses Desjardins du Quebec, and Royal Bank Of Canada .
iShares Trust - iShares Global Healthcare ETF (ARCA:IXJ) Institutionell ägarstruktur visar institutioners och fonders nuvarande positioner i företaget, samt de senaste förändringarna i positionernas storlek. Större aktieägare kan vara enskilda investerare, fonder, hedgefonder eller institutioner. Bilaga 13D visar att investeraren äger (eller ägde) mer än 5% av företaget och avser (eller avsåg) att aktivt eftersträva en förändring av affärsstrategin. Schedule 13G indikerar en passiv investering på över 5%.
The share price as of September 10, 2025 is 87,85 / share. Previously, on September 11, 2024, the share price was 99,20 / share. This represents a decline of 11,44% over that period.
Fondsentimentets poäng
Fondsentimentet poängen(fka Ägarackumulation-poäng) visar vilka aktier som är mest köpta av fonder. Det är resultatet av en sofistikerad kvantitativ flerfaktormodell som identifierar företag med de högsta nivåerna av institutionell ackumulering. Poängsättningsmodellen använder en kombination av den totala ökningen av redovisade ägare, förändringarna i portföljallokeringarna för dessa ägare och andra mått. Siffran sträcker sig från 0 till 100, där högre siffror indikerar en högre nivå av ackumulering i förhållande till sina konkurrenter, och 50 är genomsnittet.
Uppdateringsfrekvens: Dagligen
Se Ownership Explorer, som innehåller en lista över de högst rankade företagen.
Institutionell sälj/köp-kvot
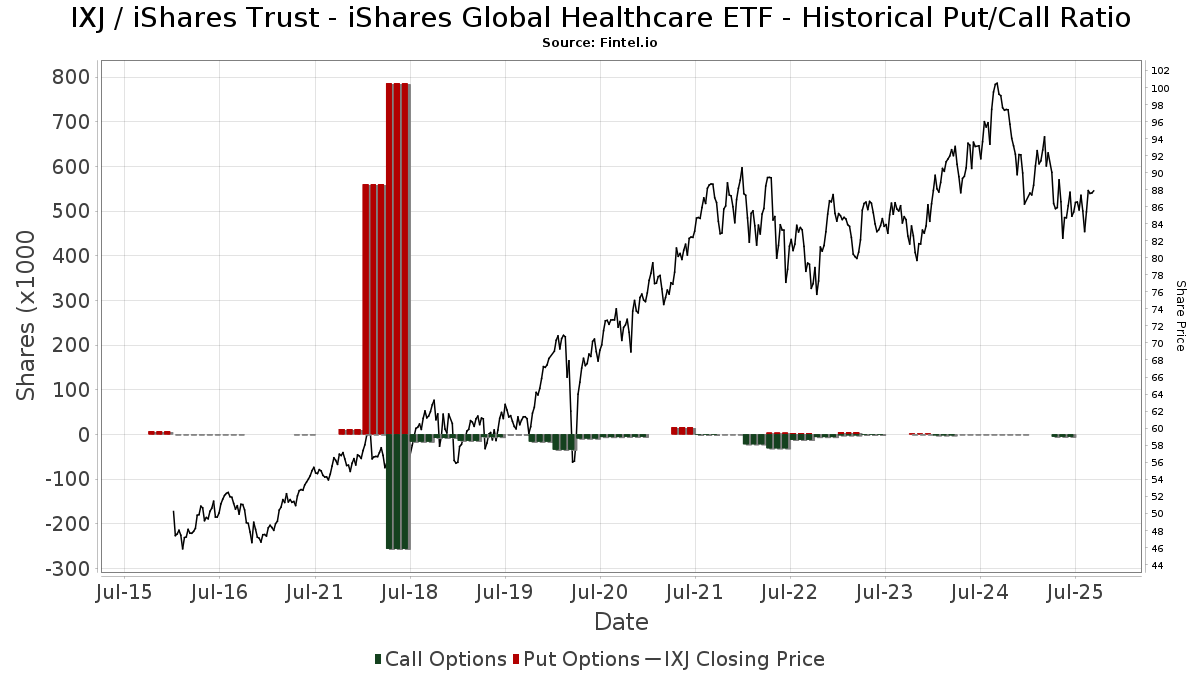
Förutom att rapportera vanliga eget kapital- och skuldemissioner måste institutioner med mer än 100MM tillgångar under förvaltning också avslöja sina innehav av sälj- och köpoptioner. Eftersom säljoptioner i allmänhet indikerar ett negativt sentiment och köpoptioner indikerar ett positivt sentiment, kan vi få en uppfattning om det övergripande institutionella sentimentet genom att plotta förhållandet mellan säljoptioner och köpoptioner. Diagrammet till höger visar det historiska förhållandet mellan sälj- och köpoptioner för detta instrument.
Genom att använda sälj/köp-kvoten som en indikator på aktieägarnas sentiment undviker man en av de största bristerna med att använda det totala institutionella ägandet, nämligen att en betydande del av de förvaltade tillgångarna investeras passivt för att följa index. Passivt förvaltade fonder köper vanligtvis inte optioner, så indikatorn för sälj/köp-kvoten ger en bättre bild av stämningen i aktivt förvaltade fonder.
13D/G-Arkiveringar
Vi presenterar 13D/G-arkiveringar separat från 13F-arkiveringar på grund av att de behandlas olika av SEC. 13D/G-arkiveringar kan lämnas in av grupper av investerare (med en ledare), medan 13F-arkiveringar inte kan det. Detta leder till situationer där en investerare kan lämna in en 13D/G-ansökan med ett värde för de totala aktierna (vilket motsvarar alla aktier som ägs av investerargruppen), men sedan lämna in en 13F-ansökan med ett annat värde för de totala aktierna (vilket motsvarar enbart deras eget ägande). Detta innebär att aktieägandet i 13D/G-arkiveringar och 13F-arkiveringar ofta inte är direkt jämförbara, så vi presenterar dem separat.
Notera: Från och med den 16 maj 2021 visar vi inte längre ägare som inte har lämnat in en 13D/G under det senaste året. Tidigare visade vi hela historiken för 13D/G-arkiveringar. I allmänhet måste enheter som är skyldiga att lämna in 13D/G-arkiveringar lämna in minst en gång per år innan de lämnar in en stängningsarkivering. Fonder avslutar dock ibland positioner utan att lämna in en avslutande arkivering (dvs. de avvecklar), så att visa hela historiken resulterade ibland i förvirring om det nuvarande ägandet. För att förhindra förvirring visar vi nu endast "nuvarande" ägare - det vill säga ägare som har lämnat in en ansökan under det senaste året.
Upgrade to unlock premium data.
| Fil Datum | Formulär | Investerare | Föregående aktier |
Senaste aktier |
Δ Aktier (Procent) |
Ägande (Procent) |
Δ Ägande (Procent) |
|
|---|---|---|---|---|---|---|---|---|
| 2025-04-17 | BlackRock, Inc. | 10,000,920 | 9,755,630 | -2.45 | 22.50 | -5.86 | ||
| 2025-02-07 | BlackRock Portfolio Management LLC | 4,239,124 | 10.10 |
13F- och NPORT-arkiveringar
Detaljer om 13F-arkiveringar är gratis. Detaljer om NP-arkiveringar kräver ett premiummedlemskap. Gröna rader indikerar nya positioner. Röda rader indikerar stängda positioner. Klicka på länk symbolen för att se hela transaktionshistoriken.
Uppgradera
för att låsa upp premiumdata och exportera till Excel ![]() .
.
| Fil Datum | Källa | Investerare | Typ | Genomsnittligt pris (beräknat) |
Aktier | Δ Aktier (%) |
Rapporterat värde (1000 USD) |
Δ Värde (%) |
Portföljallokering (%) |
|
|---|---|---|---|---|---|---|---|---|---|---|
| 2025-08-05 | 13F | Huntington National Bank | 94 | 1 450,00 | ||||||
| 2025-07-22 | 13F | Beacon Financial Advisory LLC | 2 790 | −27,61 | 240 | −31,62 | ||||
| 2025-08-14 | 13F | Wharton Business Group, LLC | 2 396 | 0,00 | 0 | |||||
| 2025-08-07 | 13F | Allworth Financial LP | 739 | 1 747,50 | 64 | 2 000,00 | ||||
| 2025-08-14 | 13F | Ameriprise Financial Inc | 915 169 | 5 522,47 | 78 789 | 5 209,23 | ||||
| 2025-08-14 | 13F | D. E. Shaw & Co., Inc. | 3 860 | 332 | ||||||
| 2025-08-15 | 13F | Captrust Financial Advisors | 12 948 | 1,01 | 1 115 | −4,70 | ||||
| 2025-06-03 | 13F | Invst, LLC | 15 958 | 1 455 | ||||||
| 2025-08-04 | 13F | Creative Financial Designs Inc /adv | 0 | −100,00 | 0 | |||||
| 2025-08-13 | 13F | Russell Investments Group, Ltd. | 231 | −11,83 | 20 | −17,39 | ||||
| 2025-08-19 | 13F | Advisory Services Network, LLC | 8 756 | 7,03 | 727 | −2,55 | ||||
| 2025-08-06 | 13F | Golden State Wealth Management, LLC | 44 | 0,00 | 4 | −25,00 | ||||
| 2025-08-08 | 13F | Kingsview Wealth Management, LLC | 4 846 | 0,02 | 417 | −5,44 | ||||
| 2025-08-11 | 13F | Strategic Wealth Partners, Ltd. | 421 | 36 | ||||||
| 2025-08-12 | 13F | Gladstone Institutional Advisory LLC | 5 437 | −0,11 | 468 | −5,65 | ||||
| 2025-08-13 | 13F | Cary Street Partners Financial Llc | 0 | −100,00 | 0 | |||||
| 2025-05-14 | 13F | Pilgrim Partners Asia Pte Ltd | 0 | −100,00 | 0 | |||||
| 2025-07-16 | 13F | Signaturefd, Llc | 39 | 8,33 | 3 | 0,00 | ||||
| 2025-08-12 | 13F | Fca Corp /tx | 53 935 | 1,36 | 4 643 | −4,31 | ||||
| 2025-08-14 | 13F | Mariner, LLC | 5 302 | 0,40 | 456 | −5,20 | ||||
| 2025-07-30 | NP | ENDW - Cambria Endowment Style ETF | 151 | 13 | ||||||
| 2025-07-15 | 13F | North Star Investment Management Corp. | 179 | 0,56 | 15 | −6,25 | ||||
| 2025-07-14 | 13F | UMA Financial Services, Inc. | 336 | 0,90 | 29 | −6,67 | ||||
| 2025-08-12 | 13F | Proequities, Inc. | 0 | 0 | ||||||
| 2025-08-18 | 13F | Hollencrest Capital Management | 315 | 0,00 | 27 | −3,57 | ||||
| 2025-07-25 | 13F | Envestnet Portfolio Solutions, Inc. | 2 528 | 11,51 | 218 | 5,34 | ||||
| 2025-08-13 | 13F/A | StoneX Group Inc. | 4 550 | 399 | ||||||
| 2025-07-18 | 13F | Union Bancaire Privee, UBP SA | 1 750 | 0,00 | 150 | −5,70 | ||||
| 2025-08-05 | 13F | Bank Of Montreal /can/ | 94 521 | −15,49 | 8 137 | −20,23 | ||||
| 2025-04-21 | NP | ETHSX - Eaton Vance Worldwide Health Sciences Fund Class A | 20 027 | −56,80 | 1 866 | −56,49 | ||||
| 2025-08-11 | 13F | Cordatus Wealth Management LLC | 3 338 | 0,00 | 0 | |||||
| 2025-07-25 | 13F | Sequoia Financial Advisors, LLC | 11 557 | 8,66 | 995 | 2,47 | ||||
| 2025-05-01 | 13F | Quest 10 Wealth Builders, Inc. | 32 | 0,00 | 3 | 0,00 | ||||
| 2025-07-25 | 13F | Community Bank, N.A. | 105 | −54,35 | 9 | −55,00 | ||||
| 2025-08-14 | 13F/A | Skopos Labs, Inc. | 363 | 31 | ||||||
| 2025-08-06 | 13F | Commonwealth Equity Services, Llc | 85 648 | −9,39 | 7 | −12,50 | ||||
| 2025-07-16 | 13F | Meridian Investment Counsel Inc. | 11 703 | −0,14 | 1 008 | −5,71 | ||||
| 2025-08-05 | 13F | Key FInancial Inc | 20 | −74,36 | 2 | −85,71 | ||||
| 2025-08-04 | 13F | Arkadios Wealth Advisors | 0 | −100,00 | 0 | |||||
| 2025-07-24 | 13F | Us Bancorp \de\ | 1 952 | 14,76 | 168 | 8,39 | ||||
| 2025-08-05 | 13F | GPS Wealth Strategies Group, LLC | 207 | −26,33 | 18 | −32,00 | ||||
| 2025-08-06 | 13F | Maltin Wealth Management, Inc. | 9 059 | 0,87 | 780 | −4,88 | ||||
| 2025-07-22 | 13F | Partners Wealth Management, Llc | 10 547 | 0,00 | 946 | −1,56 | ||||
| 2025-08-07 | 13F | Cahill Financial Advisors Inc | 4 626 | 0,00 | 398 | −5,46 | ||||
| 2025-07-10 | 13F | Wealth Enhancement Advisory Services, Llc | 5 132 | 15,40 | 443 | 9,14 | ||||
| 2025-08-11 | 13F | Y.D. More Investments Ltd | 380 | 9,83 | 33 | 3,23 | ||||
| 2025-07-08 | 13F/A | Salem Investment Counselors Inc | 1 400 | 0,00 | 121 | −5,51 | ||||
| 2025-08-12 | 13F | Aviso Financial Inc. | 122 | 10 | ||||||
| 2025-08-12 | 13F | Atlas Capital Advisors Llc | 351 | 0,00 | 30 | −6,25 | ||||
| 2025-05-13 | 13F | Bokf, Na | 0 | −100,00 | 0 | |||||
| 2025-08-06 | 13F | Paladin Advisory Group, LLC | 420 | 0,00 | 36 | −5,26 | ||||
| 2025-08-14 | 13F | Glenmede Investment Management, LP | 533 | 46 | ||||||
| 2025-05-06 | 13F | Venturi Wealth Management, LLC | 0 | −100,00 | 0 | |||||
| 2025-08-14 | 13F | Goldman Sachs Group Inc | 35 355 | 59,10 | 3 044 | 50,20 | ||||
| 2025-07-28 | 13F | Harbour Investments, Inc. | 1 077 | 216,76 | 93 | 196,77 | ||||
| 2025-08-08 | 13F | Avantax Advisory Services, Inc. | 0 | −100,00 | 0 | |||||
| 2025-08-11 | 13F | Aptus Capital Advisors, LLC | 1 127 | −2,42 | 97 | −7,62 | ||||
| 2025-07-30 | 13F | Whittier Trust Co | 0 | −100,00 | 0 | |||||
| 2025-08-13 | 13F | Transce3nd, LLC | 53 | 5 | ||||||
| 2025-07-17 | 13F | HB Wealth Management, LLC | 0 | −100,00 | 0 | |||||
| 2025-07-14 | 13F | Opal Wealth Advisors, LLC | 863 | −24,89 | 74 | −28,85 | ||||
| 2025-07-11 | 13F | Bond & Devick Financial Network, Inc. | 5 357 | −3,43 | 461 | −8,71 | ||||
| 2025-08-26 | NP | Forethought Variable Insurance Trust - Global Atlantic BlackRock Selects Managed Risk Portfolio (formerly Global Atlantic BlackRock Global Allocation Managed Risk Portfolio) Global Atlantic BlackRock Global Allocation Managed Risk Portfolio | 30 625 | −19,50 | 2 637 | −24,01 | ||||
| 2025-08-14 | 13F | Optiver Holding B.V. | 0 | −100,00 | 0 | |||||
| 2025-07-18 | 13F | Access Financial Services, Inc. | 25 082 | 0,93 | 2 159 | −4,72 | ||||
| 2025-08-06 | 13F | Moors & Cabot, Inc. | 2 324 | 0,00 | 200 | −5,21 | ||||
| 2025-04-30 | 13F | Sofos Investments, Inc. | 320 | −22,71 | 29 | −23,68 | ||||
| 2025-05-14 | 13F | Flow Traders U.s. Llc | 0 | −100,00 | 0 | |||||
| 2025-07-17 | 13F | Janney Montgomery Scott LLC | 35 915 | −1,91 | 3 | 0,00 | ||||
| 2025-07-30 | 13F | White Lighthouse Investment Management Inc. | 19 426 | 0,78 | 1 672 | −4,84 | ||||
| 2025-08-05 | 13F | Wakefield Asset Management LLLP | 0 | −100,00 | 0 | |||||
| 2025-07-28 | 13F | Courier Capital Llc | 5 067 | −18,55 | 436 | −23,10 | ||||
| 2025-05-01 | 13F | Ballentine Partners, LLC | 0 | −100,00 | 0 | |||||
| 2025-08-12 | 13F | O'shaughnessy Asset Management, Llc | 1 458 | −4,64 | 126 | −10,07 | ||||
| 2025-05-15 | 13F | Williams & Novak, LLC | 0 | −100,00 | 0 | |||||
| 2025-07-14 | 13F | Park Avenue Securities Llc | 20 567 | −1,31 | 2 | 0,00 | ||||
| 2025-08-13 | 13F | Beacon Pointe Advisors, LLC | 3 792 | 0,00 | 326 | −5,51 | ||||
| 2025-08-14 | 13F | Stifel Financial Corp | 17 846 | 21,04 | 1 536 | 14,29 | ||||
| 2025-08-05 | 13F | Bridgewater Advisors Inc. | 3 748 | 0,00 | 321 | −3,02 | ||||
| 2025-08-07 | 13F | Kestra Private Wealth Services, Llc | 2 842 | −5,89 | 245 | −11,27 | ||||
| 2025-08-12 | 13F | Franklin Resources Inc | 360 | 80,00 | 31 | 66,67 | ||||
| 2025-07-31 | 13F/A | Interchange Capital Partners, LLC | 6 292 | 11,74 | 542 | 5,46 | ||||
| 2025-07-24 | 13F | Eastern Bank | 128 | −61,21 | 11 | −63,33 | ||||
| 2025-07-08 | 13F | Webster Bank, N. A. | 2 975 | −5,41 | 256 | −10,49 | ||||
| 2025-08-13 | 13F | Smith, Moore & Co. | 0 | −100,00 | 0 | |||||
| 2025-09-04 | 13F/A | Advisor Group Holdings, Inc. | 32 370 | 27,66 | 2 789 | 20,54 | ||||
| 2025-08-13 | 13F | Northern Trust Corp | 3 305 | 285 | ||||||
| 2025-08-07 | 13F | LFA - Lugano Financial Advisors SA | 0 | −100,00 | 0 | |||||
| 2025-08-12 | 13F | SRS Capital Advisors, Inc. | 352 | 0,00 | 30 | −6,25 | ||||
| 2025-08-05 | 13F | Dunhill Financial, LLC | 957 | 82 | ||||||
| 2025-08-12 | 13F | J.w. Cole Advisors, Inc. | 3 634 | 14,24 | 313 | 7,59 | ||||
| 2025-08-11 | 13F | ICICI Prudential Asset Management Co Ltd | 12 675 | 0,00 | 1 091 | −5,63 | ||||
| 2025-08-19 | 13F | Anchor Investment Management, LLC | 7 468 | −2,42 | 643 | −7,89 | ||||
| 2025-07-24 | 13F | Ronald Blue Trust, Inc. | 4 673 | 16,16 | 402 | 9,84 | ||||
| 2025-07-18 | 13F | Founders Capital Management | 76 | 0,00 | 7 | 0,00 | ||||
| 2025-07-31 | 13F | Ground Swell Capital, LLC | 7 867 | 677 | ||||||
| 2025-08-04 | 13F | Atria Investments Llc | 12 853 | 15,91 | 1 107 | 9,40 | ||||
| 2025-08-08 | 13F | Hartland & Co., LLC | 600 | 0,00 | 52 | −5,56 | ||||
| 2025-08-14 | 13F | Mercer Global Advisors Inc /adv | 14 730 | −9,37 | 1 268 | −14,44 | ||||
| 2025-08-14 | 13F | Graney & King, LLC | 10 | 0,00 | 1 | |||||
| 2025-08-13 | 13F | WCG Wealth Advisors LLC | 11 091 | −31,71 | 955 | −35,58 | ||||
| 2025-08-14 | 13F | Bank Of America Corp /de/ | 2 539 651 | 6,31 | 218 639 | 0,35 | ||||
| 2025-08-15 | 13F | Provenance Wealth Advisors, LLC | 1 117 | 0,00 | 96 | −4,95 | ||||
| 2025-07-30 | 13F | Exencial Wealth Advisors, Llc | 0 | −100,00 | 0 | |||||
| 2025-07-24 | 13F | Blair William & Co/il | 2 028 | −1,12 | 175 | −6,95 | ||||
| 2025-08-12 | 13F | CIBC Private Wealth Group, LLC | 0 | −100,00 | 0 | |||||
| 2025-07-30 | 13F | Princeton Global Asset Management LLC | 871 | 0,11 | 75 | −6,33 | ||||
| 2025-08-05 | 13F | Continuum Wealth Advisors, Llc | 3 271 | 0,00 | 282 | −5,70 | ||||
| 2025-08-14 | 13F | IHT Wealth Management, LLC | 12 614 | 1 086 | ||||||
| 2025-08-15 | 13F | Equitable Holdings, Inc. | 85 288 | −7,34 | 7 342 | −12,53 | ||||
| 2025-08-15 | 13F | CI Private Wealth, LLC | 2 736 | −79,27 | 236 | −80,47 | ||||
| 2025-08-04 | 13F | Hantz Financial Services, Inc. | 363 | 0 | ||||||
| 2025-08-07 | 13F | Nwam Llc | 5 203 | −3,74 | 445 | −9,76 | ||||
| 2025-03-12 | 13F/A | Private Capital Management Llc | 0 | −100,00 | 0 | |||||
| 2025-08-06 | 13F | Prospera Financial Services Inc | 3 965 | 6,02 | 341 | 0,00 | ||||
| 2025-07-21 | 13F | Ameriflex Group, Inc. | 408 | 0,00 | 35 | −8,11 | ||||
| 2025-08-14 | 13F | Fmr Llc | 13 759 | −1,08 | 1 184 | −6,62 | ||||
| 2025-08-12 | 13F | MAI Capital Management | 7 907 | −14,65 | 681 | −19,43 | ||||
| 2025-08-04 | 13F | ELCO Management Co., LLC | 6 809 | −1,45 | 586 | −6,98 | ||||
| 2025-07-09 | 13F | Fiduciary Alliance LLC | 3 677 | 0,79 | 317 | −4,82 | ||||
| 2025-08-14 | 13F | Comerica Bank | 4 428 | −20,23 | 381 | −24,70 | ||||
| 2025-07-25 | 13F | Atria Wealth Solutions, Inc. | 7 960 | 6,56 | 686 | 0,59 | ||||
| 2025-05-12 | 13F | Sandy Spring Bank | 450 | 0,00 | 41 | 7,89 | ||||
| 2025-07-21 | 13F | Mirae Asset Global Investments Co., Ltd. | 48 500 | −3,48 | 4 175 | −8,46 | ||||
| 2025-08-14 | 13F | Smartleaf Asset Management LLC | 100 | 0,00 | 9 | −11,11 | ||||
| 2025-07-21 | 13F | J. Safra Sarasin Holding AG | 0 | −100,00 | 0 | |||||
| 2025-07-24 | 13F | Trust Co Of Toledo Na /oh/ | 44 | 4 | ||||||
| 2025-08-14 | 13F | EP Wealth Advisors, Inc. | 4 388 | −2,90 | 378 | −8,50 | ||||
| 2025-07-17 | 13F | Halbert Hargrove Global Advisors, Llc | 124 | 0,00 | 11 | −9,09 | ||||
| 2025-08-01 | 13F | Envestnet Asset Management Inc | 237 238 | 6,07 | 20 424 | 0,13 | ||||
| 2025-08-14 | 13F | Federation des caisses Desjardins du Quebec | 314 949 | 6,91 | 27 114 | 0,92 | ||||
| 2025-08-14 | 13F | Royal Bank Of Canada | 276 073 | 5,89 | 23 767 | −0,04 | ||||
| 2025-07-29 | 13F | Signature Estate & Investment Advisors Llc | 19 525 | −2,00 | 1 681 | −7,49 | ||||
| 2025-08-07 | 13F | Resources Investment Advisors, LLC. | 0 | −100,00 | 0 | |||||
| 2025-08-08 | 13F | Pnc Financial Services Group, Inc. | 9 412 | −0,69 | 810 | −6,25 | ||||
| 2025-08-11 | 13F | Citigroup Inc | 54 469 | −0,50 | 4 689 | −6,07 | ||||
| 2025-08-13 | 13F | Cerity Partners LLC | 5 086 | 3,50 | 438 | −2,46 | ||||
| 2025-07-14 | 13F | U.S. Capital Wealth Advisors, LLC | 0 | −100,00 | 0 | |||||
| 2025-08-07 | 13F | Evoke Wealth, Llc | 3 261 | 281 | ||||||
| 2025-08-12 | 13F | Howe & Rusling Inc | 0 | −100,00 | 0 | |||||
| 2025-08-14 | 13F | Mml Investors Services, Llc | 9 899 | 3,60 | 1 | |||||
| 2025-08-08 | 13F | Cetera Investment Advisers | 37 103 | 1,94 | 3 194 | −3,77 | ||||
| 2025-08-11 | 13F | Principal Securities, Inc. | 346 | −34,22 | 30 | −35,56 | ||||
| 2025-08-14 | 13F | Bnp Paribas Arbitrage, Sa | 87 969 | −8,90 | 7 573 | −14,00 | ||||
| 2025-07-08 | 13F | Nbc Securities, Inc. | 298 | 79,52 | 0 | |||||
| 2025-07-22 | 13F | Apexium Financial, Lp | 42 126 | −0,72 | 3 627 | −6,28 | ||||
| 2025-05-15 | 13F | Millennium Management Llc | 0 | −100,00 | 0 | −100,00 | ||||
| 2025-07-24 | 13F | IFP Advisors, Inc | 1 479 | 37,84 | 127 | 30,93 | ||||
| 2025-08-12 | 13F | Pathstone Holdings, LLC | 15 694 | −9,44 | 1 351 | −14,49 | ||||
| 2025-08-12 | 13F | Tocqueville Asset Management L.p. | 6 289 | −55,59 | 541 | −58,09 | ||||
| 2025-08-12 | 13F | LPL Financial LLC | 130 476 | −9,11 | 11 233 | −14,21 | ||||
| 2025-08-12 | 13F | Fairscale Capital, LLC | 118 | 10 | ||||||
| 2025-08-14 | 13F | Raymond James Financial Inc | 152 995 | −2,40 | 13 171 | −7,87 | ||||
| 2025-07-22 | 13F | SOL Capital Management CO | 3 400 | 0,00 | 0 | |||||
| 2025-08-06 | 13F | Ipsen Advisor Group LLC | 11 942 | 5,20 | 1 028 | −0,68 | ||||
| 2025-08-07 | 13F | Rathbone Brothers plc | 26 024 | 16,05 | 2 240 | 9,54 | ||||
| 2025-07-08 | 13F | Parallel Advisors, LLC | 0 | −100,00 | 0 | |||||
| 2025-07-11 | 13F | Farther Finance Advisors, LLC | 651 | −6,73 | 56 | −9,68 | ||||
| 2025-07-24 | 13F | Wealthstar Advisors, Llc | 2 946 | 0,24 | 254 | −5,24 | ||||
| 2025-05-15 | 13F | Sonoma Private Wealth LLC | 0 | −100,00 | 0 | |||||
| 2025-07-17 | 13F | Oakworth Capital, Inc. | 400 | 0,00 | 34 | −5,56 | ||||
| 2025-05-14 | 13F | Van Hulzen Asset Management, LLC | 0 | −100,00 | 0 | −100,00 | ||||
| 2025-08-13 | 13F | Continuum Advisory, LLC | 0 | −100,00 | 0 | |||||
| 2025-08-14 | 13F | Wells Fargo & Company/mn | 219 254 | −10,47 | 18 876 | −15,49 | ||||
| 2025-07-28 | 13F | BRYN MAWR TRUST Co | 450 | 0,00 | 39 | −7,32 | ||||
| 2025-08-11 | 13F | HighTower Advisors, LLC | 131 116 | 2,10 | 11 288 | −3,63 | ||||
| 2025-08-14 | 13F | Two Sigma Securities, Llc | 3 982 | 343 | ||||||
| 2025-08-13 | 13F | Northwestern Mutual Wealth Management Co | 27 830 | 29,97 | 2 396 | 22,69 | ||||
| 2025-08-08 | 13F | Creative Planning | 42 049 | −0,48 | 3 620 | −6,07 | ||||
| 2025-08-14 | 13F | Hilltop Holdings Inc. | 2 325 | 200 | ||||||
| 2025-08-14 | 13F/A | Barclays Plc | 115 760 | 0,00 | 10 | −10,00 | ||||
| 2025-07-17 | 13F | BFI Infinity Ltd. | 4 150 | 12,16 | 357 | 5,93 | ||||
| 2025-08-14 | 13F | Colony Group, LLC | 2 506 | 216 | ||||||
| 2025-07-31 | 13F | Money Design Co.,Ltd. | 67 069 | 0,97 | 6 | −16,67 | ||||
| 2025-08-13 | 13F | Fisher Asset Management, LLC | 6 903 794 | −5,35 | 594 348 | −10,65 | ||||
| 2025-04-21 | 13F | Nelson, Van Denburg & Campbell Wealth Management Group, LLC | 0 | −100,00 | 0 | |||||
| 2025-08-08 | 13F | WASHINGTON TRUST Co | 0 | −100,00 | 0 | |||||
| 2025-07-24 | 13F | Advanced Asset Management Advisors Inc | 16 | 0,00 | 1 | 0,00 | ||||
| 2025-04-18 | 13F | DHJJ Financial Advisors, Ltd. | 0 | −100,00 | 0 | |||||
| 2025-08-06 | 13F | Savant Capital, LLC | 2 987 | 0,13 | 257 | −5,51 | ||||
| 2025-07-29 | 13F | Harbor Asset Planning, Inc. | 1 283 | 110 | ||||||
| 2025-08-04 | 13F | Creekmur Asset Management LLC | 3 | 0,00 | 0 | |||||
| 2025-08-08 | 13F | Family Firm, Inc. | 22 381 | 4,46 | 1 927 | −1,43 | ||||
| 2025-07-21 | 13F | Pflug Koory, LLC | 58 | 0,00 | 5 | −20,00 | ||||
| 2025-07-16 | 13F | Patron Partners Advisors, Llc | 3 922 | −19,93 | 338 | −24,44 | ||||
| 2025-08-14 | 13F | Integrated Wealth Concepts LLC | 4 350 | −30,21 | 374 | −34,15 | ||||
| 2025-08-19 | 13F | Cape Investment Advisory, Inc. | 58 | 0,00 | 5 | −20,00 | ||||
| 2025-08-08 | 13F | Everett Harris & Co /ca/ | 4 630 | 0,00 | 399 | −5,69 | ||||
| 2025-08-14 | 13F | Snowden Capital Advisors LLC | 15 062 | −3,26 | 1 297 | −8,67 | ||||
| 2025-07-18 | 13F | Lynx Investment Advisory | 3 512 | 14,25 | 302 | 7,86 | ||||
| 2025-08-11 | 13F | Banque Cantonale Vaudoise | 898 | 0,00 | 0 | |||||
| 2025-04-29 | 13F | Lee Danner & Bass Inc | 0 | −100,00 | 0 | −100,00 | ||||
| 2025-08-06 | 13F | First Horizon Advisors, Inc. | 1 200 | 0,00 | 103 | −5,50 | ||||
| 2025-07-25 | 13F | Cwm, Llc | 10 314 | 1,55 | 1 | |||||
| 2025-07-21 | 13F | Ameritas Advisory Services, LLC | 633 | 54 | ||||||
| 2025-08-13 | 13F | Mount Yale Investment Advisors, LLC | 772 | 66 | ||||||
| 2025-08-01 | 13F | Bessemer Group Inc | 2 098 | 0,00 | 0 | |||||
| 2025-08-06 | 13F | Richard Bernstein Advisors LLC | 1 349 163 | 10,87 | 116 152 | 4,66 | ||||
| 2025-08-12 | 13F | Jpmorgan Chase & Co | 526 157 | −0,68 | 45 297 | −6,24 | ||||
| 2025-07-23 | 13F | Valmark Advisers, Inc. | 0 | −100,00 | 0 | |||||
| 2025-08-12 | 13F | Eldridge Investment Advisors, Inc. | 0 | −100,00 | 0 | |||||
| 2025-08-13 | 13F | Scotia Capital Inc. | 19 966 | −19,43 | 1 719 | −23,95 | ||||
| 2025-07-16 | 13F | PFS Partners, LLC | 19 | 0,00 | 2 | 0,00 | ||||
| 2025-07-17 | 13F | Sound Income Strategies, LLC | 208 | 0,00 | 18 | −5,56 | ||||
| 2025-07-17 | 13F | Barry Investment Advisors, LLC | 4 768 | −1,55 | 411 | −7,03 | ||||
| 2025-08-15 | 13F | Kestra Advisory Services, LLC | 2 918 | 2,06 | 251 | −3,46 | ||||
| 2025-08-05 | 13F | Plante Moran Financial Advisors, LLC | 5 | 0 | ||||||
| 2025-05-13 | 13F | Quadrature Capital Ltd | 0 | −100,00 | 0 | −100,00 | ||||
| 2025-07-17 | 13F | Keystone Global Partners, LLC | 2 | 0 | ||||||
| 2025-07-25 | 13F | Hazlett, Burt & Watson, Inc. | 3 329 | 0,00 | 0 | |||||
| 2025-08-08 | 13F | SBI Securities Co., Ltd. | 2 896 | 10,37 | 249 | 4,18 | ||||
| 2025-08-13 | 13F | Lido Advisors, LLC | 2 616 | −3,08 | 225 | −8,54 | ||||
| 2025-05-15 | 13F | Citadel Advisors Llc | Put | 0 | −100,00 | 0 | −100,00 | |||
| 2025-07-18 | 13F | Truist Financial Corp | 24 623 | 95,90 | 2 120 | 84,90 | ||||
| 2025-08-12 | 13F | Country Trust Bank | 350 | 0,00 | 30 | −3,23 | ||||
| 2025-07-25 | 13F | Courage Miller Partners, LLC | 2 510 | 0,00 | 216 | −5,26 | ||||
| 2025-08-11 | 13F | Western Wealth Management, LLC | 2 952 | −3,81 | 254 | −8,96 | ||||
| 2025-07-28 | 13F | Morris Financial Concepts, Inc. | 25 | 0,00 | 2 | 0,00 | ||||
| 2025-07-30 | 13F | Strategic Blueprint, LLC | 3 752 | 0,32 | 323 | −5,57 | ||||
| 2025-04-01 | 13F | Massmutual Trust Co Fsb/adv | 0 | −100,00 | 0 | |||||
| 2025-08-13 | 13F | ASB Consultores, LLC | 2 627 | 226 | ||||||
| 2025-07-18 | 13F | Centricity Wealth Management, LLC | 200 | 0,00 | 17 | −5,56 | ||||
| 2025-08-08 | 13F | Capital Investment Advisory Services, LLC | 104 | 0,00 | 9 | −11,11 | ||||
| 2025-07-23 | 13F | Slow Capital, Inc. | 7 909 | −41,61 | 681 | −44,94 | ||||
| 2025-08-14 | 13F | Vista Capital Partners, Inc. | 0 | −100,00 | 0 | |||||
| 2025-08-12 | 13F | TCTC Holdings, LLC | 567 | 0,00 | 49 | −5,88 | ||||
| 2025-08-12 | 13F | Manchester Capital Management LLC | 2 000 | 0,00 | 172 | −5,49 | ||||
| 2025-08-14 | 13F | Susquehanna International Group, Llp | Call | 5 700 | 491 | |||||
| 2025-08-12 | 13F | Mmbg Investment Advisors Co. | 3 900 | 0,00 | 336 | −5,63 | ||||
| 2025-08-14 | 13F | Susquehanna International Group, Llp | 13 817 | −12,51 | 1 190 | −17,43 | ||||
| 2025-08-12 | 13F | Investor's Fiduciary Advisor Network, LLC | 4 924 | −0,63 | 0 | |||||
| 2025-08-14 | 13F | East Coast Asset Management, LLC. | 4 471 | 0,00 | 385 | −5,65 | ||||
| 2025-08-05 | 13F | Harel Insurance Investments & Financial Services Ltd. | 1 667 | 0,00 | 0 | |||||
| 2025-07-16 | 13F/A | CX Institutional | 5 318 | 1 436,99 | 0 | |||||
| 2025-07-29 | 13F | Angeles Wealth Management, Llc | 48 | 4 | ||||||
| 2025-08-18 | 13F | Geneos Wealth Management Inc. | 150 | 42,86 | 13 | 33,33 | ||||
| 2025-07-14 | 13F | Pacifica Partners Inc. | 250 | 0,00 | 21 | −4,55 | ||||
| 2025-05-15 | 13F | Marshall Wace, Llp | 0 | −100,00 | 0 | |||||
| 2025-08-13 | 13F | Jones Financial Companies Lllp | 10 744 | 23,34 | 920 | 16,33 | ||||
| 2025-07-08 | 13F | Ehrlich Financial Group | 6 162 | 17,24 | 530 | 10,65 | ||||
| 2025-08-11 | 13F | Bradley Foster & Sargent Inc/ct | 3 272 | 0,00 | 282 | −5,70 | ||||
| 2025-07-22 | 13F | Wealthcare Advisory Partners LLC | 2 865 | −25,68 | 247 | −29,91 | ||||
| 2025-07-22 | 13F | Sava Infond d.o.o. | 9 260 | 8,94 | 797 | 2,84 | ||||
| 2025-08-14 | 13F | Murphy & Mullick Capital Management Corp | 23 | 0,00 | 2 | −50,00 | ||||
| 2025-08-11 | 13F | Hopwood Financial Services, Inc. | 130 | 0,00 | 11 | 0,00 | ||||
| 2025-08-13 | 13F | Hsbc Holdings Plc | 3 316 | 285 | ||||||
| 2025-08-04 | 13F | Assetmark, Inc | 0 | −100,00 | 0 | |||||
| 2025-08-04 | 13F | Spire Wealth Management | 17 271 | −2,63 | 1 487 | −8,10 | ||||
| 2025-08-01 | 13F | Banco Santander, S.A. | 66 248 | 0,42 | 5 703 | −5,20 | ||||
| 2025-08-05 | 13F | Bank of New York Mellon Corp | 14 020 | 11,92 | 1 207 | 5,69 | ||||
| 2025-07-30 | 13F | Pacific Sun Financial Corp | 0 | −100,00 | 0 | |||||
| 2025-08-08 | 13F | Gts Securities Llc | 5 246 | −58,84 | 452 | −61,19 | ||||
| 2025-04-22 | 13F | Synergy Financial Management, LLC | 0 | −100,00 | 0 | |||||
| 2025-08-12 | 13F | Steward Partners Investment Advisory, Llc | 5 655 | 5,25 | 487 | −0,82 | ||||
| 2025-08-07 | 13F | Parkside Financial Bank & Trust | 570 | 49 | ||||||
| 2025-08-06 | 13F | Atlantic Union Bankshares Corp | 450 | 39 | ||||||
| 2025-08-18 | 13F/A | National Bank Of Canada /fi/ | 12 568 | −3,68 | 1 081 | −9,08 | ||||
| 2025-08-08 | 13F | Capital Investment Counsel, Inc | 433 | 0,00 | 37 | −5,13 | ||||
| 2025-08-11 | 13F | TD Waterhouse Canada Inc. | 6 583 | −7,24 | 573 | −9,92 | ||||
| 2025-08-05 | 13F | Transatlantique Private Wealth Llc | 31 055 | 6,81 | 2 674 | 0,83 | ||||
| 2025-08-14 | 13F | CIBC World Markets Inc. | 16 516 | 6,59 | 1 422 | 0,57 | ||||
| 2025-05-15 | 13F | Edmond De Rothschild Holding S.a. | 0 | −100,00 | 0 | |||||
| 2025-08-01 | 13F | SYM FINANCIAL Corp | 247 | 0,00 | 21 | −4,55 | ||||
| 2025-07-18 | 13F | Pure Financial Advisors, Inc. | 6 805 | −2,77 | 586 | −8,31 | ||||
| 2025-07-02 | 13F | Marotta Asset Management | 20 771 | −10,92 | 1 788 | −21,85 | ||||
| 2025-07-29 | 13F | Mattson Financial Services, LLC | 0 | −100,00 | 0 | |||||
| 2025-07-14 | 13F | Armstrong Advisory Group, Inc | 30 | 0,00 | 3 | 0,00 | ||||
| 2025-08-11 | 13F | Private Advisor Group, LLC | 15 629 | 91,98 | 1 345 | 81,27 | ||||
| 2025-08-15 | 13F | Morgan Stanley | 523 580 | 6,66 | 45 075 | 0,68 | ||||
| 2025-05-16 | 13F | Arete Wealth Advisors, LLC | 0 | −100,00 | 0 | |||||
| 2025-07-15 | 13F | Fifth Third Bancorp | 1 685 | −2,32 | 145 | −7,64 | ||||
| 2025-08-14 | 13F | LM Advisors LLC | 3 748 | 0,00 | 0 | |||||
| 2025-07-17 | 13F | Youngs Advisory Group, Inc. | 2 885 | −20,19 | 249 | −24,55 | ||||
| 2025-08-19 | 13F | National Asset Management, Inc. | 8 411 | −8,15 | 724 | −8,01 | ||||
| 2025-08-18 | 13F | Front Row Advisors LLC | 2 049 | −10,48 | 176 | −15,38 | ||||
| 2025-08-07 | 13F | Clarity Wealth Advisors, LLC | 36 711 | −5,65 | 3 160 | −10,94 | ||||
| 2025-08-12 | 13F | BlackRock, Inc. | 14 053 063 | −1,25 | 1 209 828 | −6,78 | ||||
| 2025-08-14 | 13F | Glen Eagle Advisors, LLC | 3 362 | 0,00 | 289 | −5,56 | ||||
| 2025-08-07 | 13F | Montag A & Associates Inc | 89 | 0,00 | 8 | −12,50 | ||||
| 2025-04-28 | 13F | Strategic Financial Concepts, LLC | 0 | −100,00 | 0 | −100,00 | ||||
| 2025-08-05 | 13F | Simplex Trading, Llc | 0 | −100,00 | 0 | |||||
| 2025-08-13 | 13F | Cresset Asset Management, LLC | 16 703 | −26,81 | 1 438 | −30,95 | ||||
| 2025-08-01 | 13F | Transcend Wealth Collective, Llc | 0 | −100,00 | 0 | |||||
| 2025-08-14 | 13F | Hrt Financial Lp | 9 720 | 1 | ||||||
| 2025-08-14 | 13F | UBS Group AG | 275 151 | −9,65 | 23 688 | −14,71 | ||||
| 2025-07-30 | 13F | Whittier Trust Co Of Nevada Inc | 251 | 0,00 | 22 | −4,55 | ||||
| 2025-08-14 | 13F | CoreCap Advisors, LLC | 105 | −63,92 | 9 | −65,38 | ||||
| 2025-07-11 | 13F | Grove Bank & Trust | 212 | 0,00 | 18 | −5,26 | ||||
| 2025-08-14 | 13F | LaSalle St. Investment Advisors, LLC | 0 | −100,00 | 0 | |||||
| 2025-07-30 | 13F | Phoenix Holdings Ltd. | 1 199 299 | −0,01 | 103 248 | −5,61 | ||||
| 2025-07-09 | 13F | Breakwater Investment Management | 1 948 | 0,00 | 168 | −5,65 | ||||
| 2025-08-08 | 13F | Sittner & Nelson, Llc | 690 | 0,00 | 59 | −4,84 | ||||
| 2025-08-12 | 13F | Coldstream Capital Management Inc | 0 | −100,00 | 0 | |||||
| 2025-07-15 | 13F | Patriot Investment Management Inc. | 5 108 | −0,55 | 440 | −6,20 | ||||
| 2025-07-17 | 13F | Vermillion Wealth Management, Inc. | 348 | 0,00 | 30 | −6,45 | ||||
| 2025-08-12 | 13F | Nemes Rush Group LLC | 0 | −100,00 | 0 | |||||
| 2025-08-14 | 13F | Citadel Advisors Llc | 43 250 | 3 723 | ||||||
| 2025-07-14 | 13F | Farmers & Merchants Investments Inc | 66 | 0,00 | 6 | −16,67 | ||||
| 2025-07-30 | 13F | D.a. Davidson & Co. | 12 722 | −1,66 | 1 095 | −7,12 | ||||
| 2025-08-14 | 13F | FIL Ltd | 47 123 | 0,14 | 4 057 | −5,48 | ||||
| 2025-07-24 | 13F | Leo Wealth, LLC | 140 172 | 52,40 | 12 079 | 43,99 | ||||
| 2025-07-22 | 13F | Miracle Mile Advisors, LLC | 2 609 | 225 | ||||||
| 2025-08-01 | 13F | Purkiss Capital Advisors LLC | 5 995 | 13,26 | 516 | 7,05 | ||||
| 2025-07-31 | 13F | Cambridge Investment Research Advisors, Inc. | 21 154 | 23,53 | 2 | 0,00 | ||||
| 2025-08-11 | 13F | Brown Brothers Harriman & Co | 8 | −99,33 | 1 | −100,00 | ||||
| 2025-08-06 | 13F | Stonebridge Financial Planning Group, LLC | 6 085 | −3,18 | 524 | −8,73 | ||||
| 2025-08-11 | 13F | Anfield Capital Management, LLC | 120 | 0,00 | 10 | 0,00 | ||||
| 2025-08-15 | 13F | Tower Research Capital LLC (TRC) | 1 | 0 | ||||||
| 2025-08-06 | 13F | Kcm Investment Advisors Llc | 4 629 | 399 | ||||||
| 2025-07-16 | 13F | New Insight Wealth Advisors | 3 484 | −52,13 | 300 | −54,90 | ||||
| 2025-08-05 | 13F | Mathes Company, Inc. | 2 750 | 0,00 | 0 | |||||
| 2025-08-13 | 13F | Royal Fund Management, LLC | 0 | −100,00 | 0 | |||||
| 2025-07-30 | 13F | Brookstone Capital Management | 0 | −100,00 | 0 | |||||
| 2025-08-13 | 13F | Crescent Grove Advisors, LLC | 15 940 | 0,00 | 1 372 | −5,57 | ||||
| 2025-08-19 | 13F | Newbridge Financial Services Group, Inc. | 15 553 | −18,97 | 1 339 | −23,54 | ||||
| 2025-07-30 | 13F | LGT Financial Advisors LLC | 80 | 7 | ||||||
| 2025-08-14 | 13F | Sunbelt Securities, Inc. | 5 | 0,00 | 0 | |||||
| 2025-07-30 | 13F | Avidian Wealth Solutions, LLC | 10 064 | 0,64 | 866 | −4,94 | ||||
| 2025-08-08 | 13F | Financial Gravity Companies, Inc. | 230 | −28,12 | 20 | −29,63 | ||||
| 2025-04-21 | 13F | Ayalon Holdings Ltd. | 0 | −100,00 | 0 | |||||
| 2025-08-13 | 13F | Green Harvest Asset Management LLC | 87 573 | −14,52 | 7 539 | −19,30 | ||||
| 2025-08-14 | 13F | Jane Street Group, Llc | 43 132 | −56,92 | 3 713 | −59,33 | ||||
| 2025-08-14 | 13F | Qube Research & Technologies Ltd | 11 121 | 957 | ||||||
| 2025-08-12 | 13F | Global Retirement Partners, LLC | 2 822 | −48,04 | 243 | −48,07 | ||||
| 2025-07-22 | 13F | DAVENPORT & Co LLC | 5 580 | 0,00 | 480 | −5,51 | ||||
| 2025-07-29 | 13F | Chevy Chase Trust Holdings, Inc. | 3 200 | 0,00 | 275 | −5,50 | ||||
| 2025-08-14 | 13F/A | Rockefeller Capital Management L.P. | 13 361 | 8,05 | 1 150 | 2,04 | ||||
| 2025-08-14 | 13F | GWM Advisors LLC | 6 104 | 140,88 | 525 | 127,27 | ||||
| 2025-08-06 | 13F | AE Wealth Management LLC | 7 331 | 7,24 | 631 | 1,28 |