Grundläggande statistik
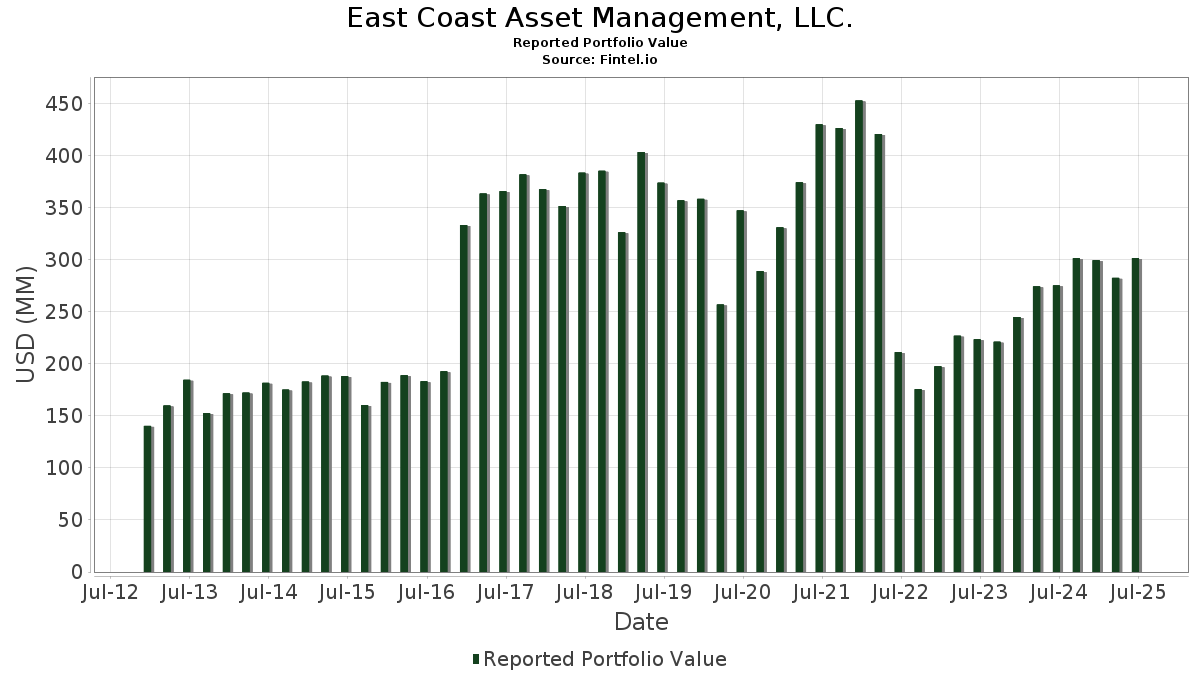
| Portföljvärde | $ 301 408 563 |
| Aktuella positioner | 69 |
Senaste innehav, resultat, förvaltat kapital (från 13F, 13D)
East Coast Asset Management, LLC. har redovisat 69 totala innehav i sina senaste SEC-arkiveringar. Det senaste portföljvärdet beräknas vara $ 301 408 563 USD. Faktiskt förvaltade tillgångar (AUM) är detta värde plus likvida medel (som inte redovisas). East Coast Asset Management, LLC.s största innehav är Alphabet Inc. (US:GOOG) , TransDigm Group Incorporated (US:TDG) , Meta Platforms, Inc. (US:META) , Perimeter Solutions, Inc. (US:PRM) , and Tesla, Inc. (US:TSLA) .
Största ökningarna detta kvartal
Vi använder förändringen i portföljallokeringen eftersom det är det mest meningsfulla måttet. Förändringar kan bero på transaktioner eller förändringar i aktiekurser.
| Värdepapper | Aktier (MM) |
Värde (MM$) |
Portfölj % av | ΔPortfölj % av |
|---|---|---|---|---|
| 2,07 | 28,84 | 9,5683 | 2,1718 | |
| 0,04 | 31,57 | 10,4737 | 1,7486 | |
| 0,06 | 18,86 | 6,2581 | 1,4146 | |
| 0,06 | 13,80 | 4,5780 | 0,7252 | |
| 0,03 | 7,22 | 2,3962 | 0,4900 | |
| 0,02 | 35,93 | 11,9207 | 0,3209 | |
| 0,01 | 3,79 | 1,2575 | 0,2444 | |
| 0,04 | 4,10 | 1,3597 | 0,1152 | |
| 0,01 | 1,85 | 0,6147 | 0,0854 | |
| 0,00 | 0,22 | 0,0731 | 0,0731 |
Största minskningarna detta kvartal
Vi använder förändringen i portföljallokeringen eftersom det är det mest meningsfulla måttet. Förändringar kan bero på transaktioner eller förändringar i aktiepriser.
| Värdepapper | Aktier (MM) |
Värde (MM$) |
Portfölj % av | ΔPortfölj % av |
|---|---|---|---|---|
| 0,09 | 5,28 | 1,7511 | −4,4491 | |
| 0,03 | 15,84 | 5,2552 | −0,9107 | |
| 0,04 | 8,17 | 2,7114 | −0,4363 | |
| 0,02 | 13,17 | 4,3707 | −0,1930 | |
| 0,01 | 4,18 | 1,3860 | −0,1515 | |
| 0,03 | 2,89 | 0,9593 | −0,1350 | |
| 0,00 | 2,19 | 0,7254 | −0,1229 | |
| 0,05 | 5,82 | 1,9297 | −0,1095 | |
| 0,21 | 37,84 | 12,5548 | −0,1080 | |
| 0,02 | 5,92 | 1,9649 | −0,1060 |
13F- och fond arkiveringar
Denna blankett lämnades in den 2025-08-14 för rapporteringsperioden 2025-06-30. Klicka på länksymbolen för att se hela transaktionshistoriken.
Uppgradera för att låsa upp premiumdata och exportera till Excel![]() .
.
| Värdepapper | Typ | Genomsnittligt aktiepris | Aktier (MM) |
ΔAktier (%) |
ΔAktier (%) |
Värde ($MM) |
Portfölj (%) |
ΔPortfölj (%) |
|
|---|---|---|---|---|---|---|---|---|---|
| GOOG / Alphabet Inc. | 0,21 | −6,79 | 37,84 | 5,84 | 12,5548 | −0,1080 | |||
| TDG / TransDigm Group Incorporated | 0,02 | −0,21 | 35,93 | 9,70 | 11,9207 | 0,3209 | |||
| META / Meta Platforms, Inc. | 0,04 | 0,06 | 31,57 | 28,14 | 10,4737 | 1,7486 | |||
| PRM / Perimeter Solutions, Inc. | 2,07 | −0,10 | 28,84 | 38,09 | 9,5683 | 2,1718 | |||
| TSLA / Tesla, Inc. | 0,06 | 12,53 | 18,86 | 37,93 | 6,2581 | 1,4146 | |||
| BRK.B / Berkshire Hathaway Inc. | 0,03 | −0,25 | 15,84 | −9,02 | 5,2552 | −0,9107 | |||
| AMZN / Amazon.com, Inc. | 0,06 | 10,00 | 13,80 | 26,84 | 4,5780 | 0,7252 | |||
| MA / Mastercard Incorporated | 0,02 | −0,28 | 13,17 | 2,24 | 4,3707 | −0,1930 | |||
| AAPL / Apple Inc. | 0,04 | −0,45 | 8,17 | −8,05 | 2,7114 | −0,4363 | |||
| MCO / Moody's Corporation | 0,01 | 0,09 | 7,49 | 7,80 | 2,4855 | 0,0244 | |||
| WWD / Woodward, Inc. | 0,03 | −0,08 | 7,22 | 34,19 | 2,3962 | 0,4900 | |||
| V / Visa Inc. | 0,02 | −0,02 | 5,92 | 1,28 | 1,9649 | −0,1060 | |||
| TJX / The TJX Companies, Inc. | 0,05 | −0,37 | 5,82 | 1,02 | 1,9297 | −0,1095 | |||
| BN / Brookfield Corporation | 0,09 | −74,45 | 5,28 | −69,85 | 1,7511 | −4,4491 | |||
| DE / Deere & Company | 0,01 | 0,18 | 5,21 | 8,53 | 1,7274 | 0,0283 | |||
| MKL / Markel Group Inc. | 0,00 | 0,28 | 4,33 | 7,14 | 1,4380 | 0,0051 | |||
| CHTR / Charter Communications, Inc. | 0,01 | −13,25 | 4,18 | −3,78 | 1,3860 | −0,1515 | |||
| SCHW / The Charles Schwab Corporation | 0,04 | 0,06 | 4,10 | 16,65 | 1,3597 | 0,1152 | |||
| MSFT / Microsoft Corporation | 0,01 | 0,00 | 3,79 | 32,52 | 1,2575 | 0,2444 | |||
| SHW / The Sherwin-Williams Company | 0,01 | 0,06 | 3,63 | −1,60 | 1,2057 | −0,1024 | |||
| SPY / SPDR S&P 500 ETF | 0,01 | −2,12 | 3,22 | 8,10 | 1,0672 | 0,0134 | |||
| WM / Waste Management, Inc. | 0,01 | −0,20 | 3,14 | −1,35 | 1,0405 | −0,0855 | |||
| LPX / Louisiana-Pacific Corporation | 0,03 | 0,09 | 2,89 | −6,41 | 0,9593 | −0,1350 | |||
| BRK.A / Berkshire Hathaway Inc. | 0,00 | 0,00 | 2,19 | −8,73 | 0,7254 | −0,1229 | |||
| ADP / Automatic Data Processing, Inc. | 0,01 | 0,18 | 2,05 | 1,14 | 0,6787 | −0,0377 | |||
| UNP / Union Pacific Corporation | 0,01 | −0,68 | 1,95 | −3,27 | 0,6474 | −0,0671 | |||
| CL / Colgate-Palmolive Company | 0,02 | 0,18 | 1,87 | −2,85 | 0,6217 | −0,0612 | |||
| CR / Crane Company | 0,01 | 0,00 | 1,85 | 23,96 | 0,6147 | 0,0854 | |||
| VOE / Vanguard Index Funds - Vanguard Mid-Cap Value ETF | 0,01 | 0,00 | 1,37 | 2,39 | 0,4555 | −0,0191 | |||
| PAYX / Paychex, Inc. | 0,01 | 0,00 | 1,27 | −5,73 | 0,4204 | −0,0556 | |||
| SYY / Sysco Corporation | 0,02 | 0,10 | 1,18 | 1,02 | 0,3926 | −0,0222 | |||
| LH / Labcorp Holdings Inc. | 0,00 | 0,05 | 1,13 | 12,85 | 0,3759 | 0,0203 | |||
| GOOGL / Alphabet Inc. | 0,01 | −0,27 | 0,96 | 13,61 | 0,3187 | 0,0193 | |||
| JNJ / Johnson & Johnson | 0,01 | −3,60 | 0,86 | −11,21 | 0,2840 | −0,0574 | |||
| BR / Broadridge Financial Solutions, Inc. | 0,00 | 0,00 | 0,85 | 0,24 | 0,2813 | −0,0183 | |||
| OEF / iShares Trust - iShares S&P 100 ETF | 0,00 | 0,00 | 0,84 | 12,38 | 0,2773 | 0,0139 | |||
| DHR / Danaher Corporation | 0,00 | 0,00 | 0,73 | −3,70 | 0,2418 | −0,0260 | |||
| CMCSA / Comcast Corporation | 0,02 | 0,05 | 0,66 | −3,22 | 0,2198 | −0,0227 | |||
| LBRDK / Liberty Broadband Corporation | 0,01 | −11,08 | 0,56 | 2,92 | 0,1873 | −0,0071 | |||
| IWM / iShares Trust - iShares Russell 2000 ETF | 0,00 | 0,00 | 0,54 | 8,08 | 0,1777 | 0,0023 | |||
| IBM / International Business Machines Corporation | 0,00 | 0,17 | 0,53 | 18,96 | 0,1749 | 0,0176 | |||
| SPLV / Invesco Exchange-Traded Fund Trust II - Invesco S&P 500 Low Volatility ETF | 0,01 | 0,00 | 0,52 | −2,61 | 0,1737 | −0,0166 | |||
| PG / The Procter & Gamble Company | 0,00 | 0,00 | 0,50 | −6,43 | 0,1643 | −0,0233 | |||
| RTX / RTX Corporation | 0,00 | 0,12 | 0,48 | 10,39 | 0,1587 | 0,0052 | |||
| INTU / Intuit Inc. | 0,00 | 0,00 | 0,47 | 28,26 | 0,1568 | 0,0263 | |||
| AXP / American Express Company | 0,00 | 0,00 | 0,46 | 18,60 | 0,1526 | 0,0152 | |||
| LMT / Lockheed Martin Corporation | 0,00 | 0,00 | 0,45 | 3,65 | 0,1509 | −0,0045 | |||
| AMGN / Amgen Inc. | 0,00 | 0,00 | 0,45 | −10,45 | 0,1508 | −0,0288 | |||
| ADBE / Adobe Inc. | 0,00 | 0,00 | 0,41 | 0,99 | 0,1352 | −0,0079 | |||
| MMM / 3M Company | 0,00 | 0,00 | 0,39 | 3,69 | 0,1305 | −0,0039 | |||
| EWL / iShares, Inc. - iShares MSCI Switzerland ETF | 0,01 | −6,88 | 0,39 | −1,27 | 0,1291 | −0,0107 | |||
| RSG / Republic Services, Inc. | 0,00 | 0,00 | 0,39 | 1,85 | 0,1279 | −0,0062 | |||
| IXJ / iShares Trust - iShares Global Healthcare ETF | 0,00 | 0,00 | 0,38 | −5,65 | 0,1277 | −0,0167 | |||
| HD / The Home Depot, Inc. | 0,00 | 0,00 | 0,38 | 0,00 | 0,1265 | −0,0085 | |||
| RACE / Ferrari N.V. | 0,00 | 0,00 | 0,37 | 14,78 | 0,1213 | 0,0084 | |||
| BSX / Boston Scientific Corporation | 0,00 | 0,00 | 0,35 | 6,31 | 0,1177 | −0,0003 | |||
| WMT / Walmart Inc. | 0,00 | 0,00 | 0,33 | 11,26 | 0,1083 | 0,0045 | |||
| JPM / JPMorgan Chase & Co. | 0,00 | 0,00 | 0,32 | 18,22 | 0,1058 | 0,0102 | |||
| DIS / The Walt Disney Company | 0,00 | −1,06 | 0,30 | 24,28 | 0,1003 | 0,0142 | |||
| VOO / Vanguard Index Funds - Vanguard S&P 500 ETF | 0,00 | 0,00 | 0,28 | 10,94 | 0,0942 | 0,0032 | |||
| ELV / Elevance Health, Inc. | 0,00 | −1,22 | 0,28 | −11,84 | 0,0942 | −0,0196 | |||
| AMT / American Tower Corporation | 0,00 | 0,00 | 0,28 | 1,84 | 0,0919 | −0,0047 | |||
| VUG / Vanguard Index Funds - Vanguard Growth ETF | 0,00 | 0,00 | 0,26 | 18,26 | 0,0863 | 0,0084 | |||
| COST / Costco Wholesale Corporation | 0,00 | 0,00 | 0,24 | 4,82 | 0,0795 | −0,0016 | |||
| ACN / Accenture plc | 0,00 | 0,00 | 0,22 | −3,93 | 0,0731 | −0,0084 | |||
| ETN / Eaton Corporation plc | 0,00 | 0,22 | 0,0731 | 0,0731 | |||||
| IWF / iShares Trust - iShares Russell 1000 Growth ETF | 0,00 | 0,22 | 0,0724 | 0,0724 | |||||
| CARR / Carrier Global Corporation | 0,00 | 0,22 | 0,0714 | 0,0714 | |||||
| VWO / Vanguard International Equity Index Funds - Vanguard FTSE Emerging Markets ETF | 0,00 | 0,21 | 0,0712 | 0,0712 | |||||
| CLX / The Clorox Company | 0,00 | −100,00 | 0,00 | −100,00 | −0,1025 | ||||
| TMO / Thermo Fisher Scientific Inc. | 0,00 | −100,00 | 0,00 | 0,0000 | |||||
| PEP / PepsiCo, Inc. | 0,00 | −100,00 | 0,00 | 0,0000 | |||||
| PFE / Pfizer Inc. | 0,00 | −100,00 | 0,00 | 0,0000 |