Grundläggande statistik
| Institutionella ägare | 279 total, 278 long only, 0 short only, 1 long/short - change of 2,18% MRQ |
| Genomsnittlig portföljallokering | 0.4029 % - change of −18,69% MRQ |
| Institutionella aktier (lång) | 27 840 932 (ex 13D/G) - change of −0,23MM shares −0,82% MRQ |
| Institutionellt värde (lång) | $ 2 882 333 USD ($1000) |
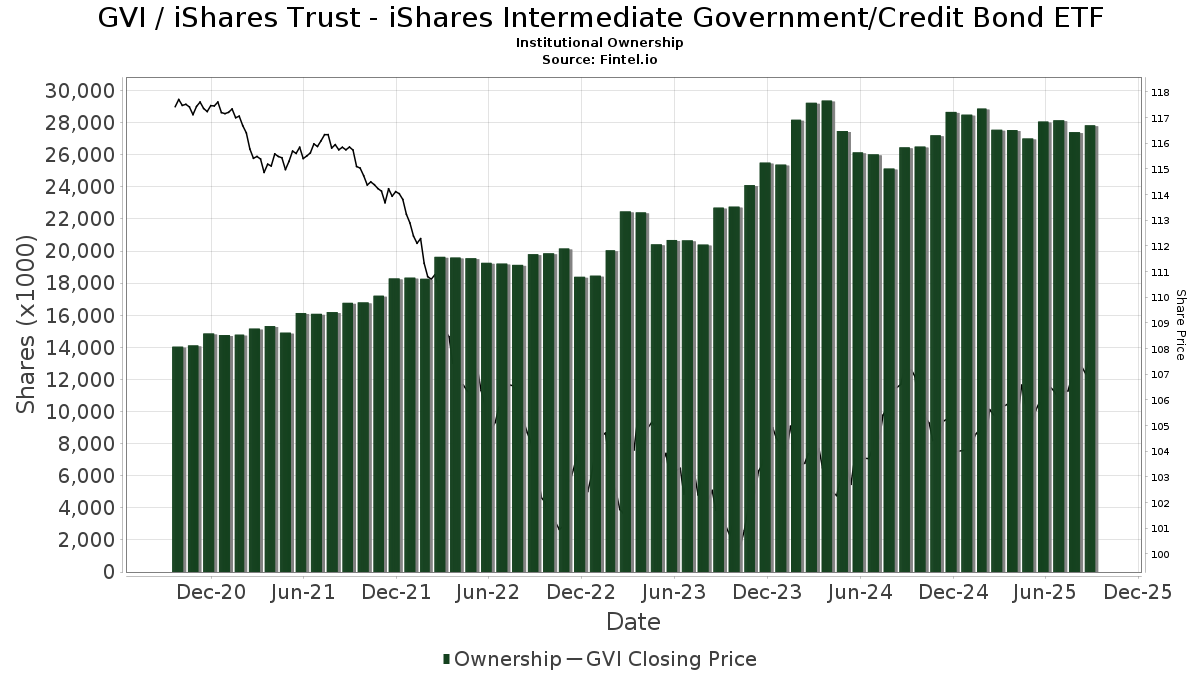
Institutionellt ägande och aktieägare
iShares Trust - iShares Intermediate Government/Credit Bond ETF (US:GVI) har 279 Institutionella ägare och aktieägare som har lämnat in 13D/G- eller 13F-formulär till Securities Exchange Commission (SEC). Dessa institut innehar totalt 27,840,932 aktier. Största aktieägare inkluderar Eastern Bank, Stifel Financial Corp, Bank Of America Corp /de/, Fifth Third Bancorp, Envestnet Asset Management Inc, Midwest Trust Co, CIBC Private Wealth Group, LLC, Keybank National Association/oh, German American Bancorp, Inc., and Umb Bank N A/mo .
iShares Trust - iShares Intermediate Government/Credit Bond ETF (BATS:GVI) Institutionell ägarstruktur visar institutioners och fonders nuvarande positioner i företaget, samt de senaste förändringarna i positionernas storlek. Större aktieägare kan vara enskilda investerare, fonder, hedgefonder eller institutioner. Bilaga 13D visar att investeraren äger (eller ägde) mer än 5% av företaget och avser (eller avsåg) att aktivt eftersträva en förändring av affärsstrategin. Schedule 13G indikerar en passiv investering på över 5%.
The share price as of September 12, 2025 is 107,61 / share. Previously, on September 16, 2024, the share price was 107,43 / share. This represents an increase of 0,17% over that period.
Fondsentimentets poäng
Fondsentimentet poängen(fka Ägarackumulation-poäng) visar vilka aktier som är mest köpta av fonder. Det är resultatet av en sofistikerad kvantitativ flerfaktormodell som identifierar företag med de högsta nivåerna av institutionell ackumulering. Poängsättningsmodellen använder en kombination av den totala ökningen av redovisade ägare, förändringarna i portföljallokeringarna för dessa ägare och andra mått. Siffran sträcker sig från 0 till 100, där högre siffror indikerar en högre nivå av ackumulering i förhållande till sina konkurrenter, och 50 är genomsnittet.
Uppdateringsfrekvens: Dagligen
Se Ownership Explorer, som innehåller en lista över de högst rankade företagen.
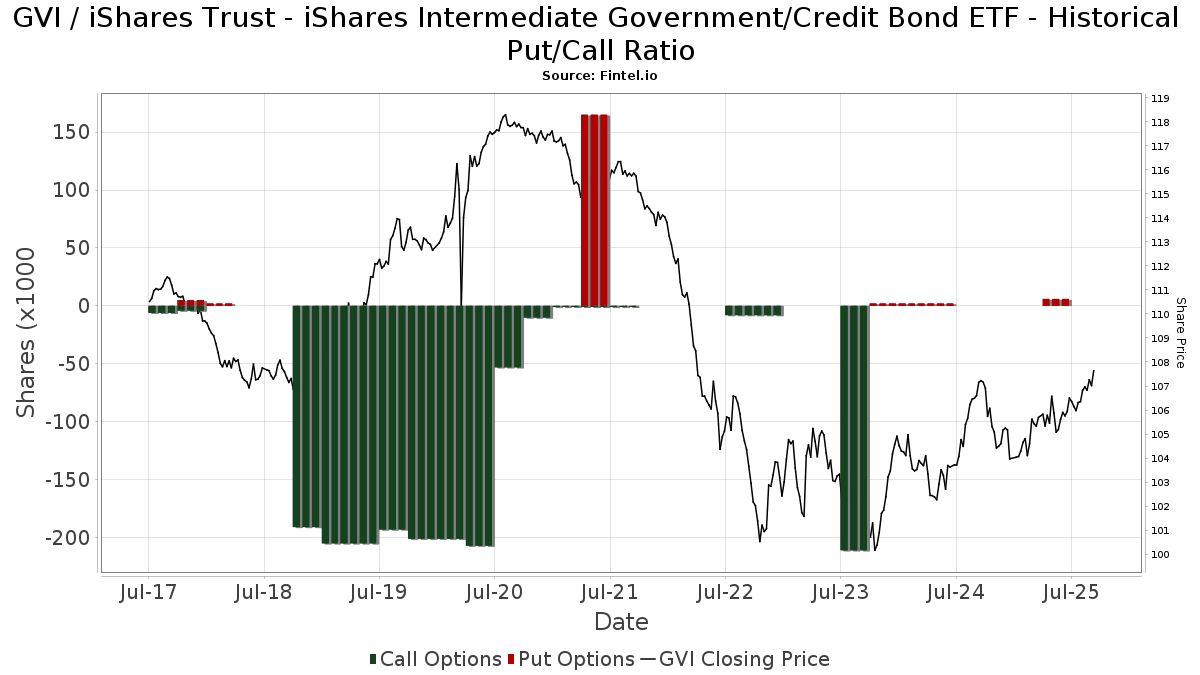
Institutionell sälj/köp-kvot
Förutom att rapportera vanliga eget kapital- och skuldemissioner måste institutioner med mer än 100MM tillgångar under förvaltning också avslöja sina innehav av sälj- och köpoptioner. Eftersom säljoptioner i allmänhet indikerar ett negativt sentiment och köpoptioner indikerar ett positivt sentiment, kan vi få en uppfattning om det övergripande institutionella sentimentet genom att plotta förhållandet mellan säljoptioner och köpoptioner. Diagrammet till höger visar det historiska förhållandet mellan sälj- och köpoptioner för detta instrument.
Genom att använda sälj/köp-kvoten som en indikator på aktieägarnas sentiment undviker man en av de största bristerna med att använda det totala institutionella ägandet, nämligen att en betydande del av de förvaltade tillgångarna investeras passivt för att följa index. Passivt förvaltade fonder köper vanligtvis inte optioner, så indikatorn för sälj/köp-kvoten ger en bättre bild av stämningen i aktivt förvaltade fonder.
13F- och NPORT-arkiveringar
Detaljer om 13F-arkiveringar är gratis. Detaljer om NP-arkiveringar kräver ett premiummedlemskap. Gröna rader indikerar nya positioner. Röda rader indikerar stängda positioner. Klicka på länk symbolen för att se hela transaktionshistoriken.
Uppgradera
för att låsa upp premiumdata och exportera till Excel ![]() .
.
| Fil Datum | Källa | Investerare | Typ | Genomsnittligt pris (beräknat) |
Aktier | Δ Aktier (%) |
Rapporterat värde (1000 USD) |
Δ Värde (%) |
Portföljallokering (%) |
|
|---|---|---|---|---|---|---|---|---|---|---|
| 2025-07-22 | 13F | Miracle Mile Advisors, LLC | 118 121 | 12 614 | ||||||
| 2025-07-25 | 13F | Cwm, Llc | 1 963 | 24,24 | 0 | |||||
| 2025-08-14 | 13F | Common Fund For Nonprofit Organizations | 2 778 | 0,00 | 297 | 0,68 | ||||
| 2025-07-09 | 13F | VisionPoint Advisory Group, LLC | 8 439 | 901 | ||||||
| 2025-07-21 | 13F | Cape Ann Savings Bank | 3 312 | −6,60 | 354 | −5,87 | ||||
| 2025-08-08 | 13F | Citizens Financial Group Inc/ri | 12 772 | −2,38 | 1 364 | −1,73 | ||||
| 2025-07-10 | 13F | Stewardship Advisors, LLC | 3 788 | 2,02 | 405 | 2,80 | ||||
| 2025-07-17 | 13F | First County Bank /CT/ | 9 992 | 11,15 | 1 067 | 11,96 | ||||
| 2025-08-06 | 13F | Simmons Bank | 16 557 | −6,22 | 1 768 | −5,51 | ||||
| 2025-07-08 | 13F | Parallel Advisors, LLC | 175 | −83,57 | 19 | −83,93 | ||||
| 2025-07-18 | 13F | Community Financial Services Group, LLC | 103 225 | 3,32 | 11 023 | 4,07 | ||||
| 2025-08-14 | 13F | GWM Advisors LLC | 53 956 | 1,58 | 5 762 | 2,31 | ||||
| 2025-07-11 | 13F | Compass Ion Advisors, LLC | 5 567 | −7,65 | 595 | −7,04 | ||||
| 2025-08-13 | 13F | Global Endowment Management, LP | 5 334 | 9,33 | 570 | 10,06 | ||||
| 2025-08-12 | 13F | Howe & Rusling Inc | 337 699 | −5,73 | 36 063 | −5,05 | ||||
| 2025-07-14 | 13F | U.S. Capital Wealth Advisors, LLC | 2 147 | −7,97 | 229 | −7,29 | ||||
| 2025-08-15 | 13F | Montag & Caldwell, Llc | 29 325 | −0,18 | 3 132 | 0,55 | ||||
| 2025-07-31 | 13F | CNB Bank | 1 347 | 0,00 | 144 | 0,70 | ||||
| 2025-07-31 | 13F | Cambridge Investment Research Advisors, Inc. | 82 406 | −3,12 | 9 | −11,11 | ||||
| 2025-08-08 | 13F | Glassman Wealth Services | 1 036 | 111 | ||||||
| 2025-08-14 | 13F | Royal Bank Of Canada | 231 747 | 1,87 | 24 749 | 2,62 | ||||
| 2025-05-15 | 13F | Qube Research & Technologies Ltd | 0 | −100,00 | 0 | |||||
| 2025-08-12 | 13F | Argent Trust Co | 25 907 | 30,20 | 2 767 | 31,15 | ||||
| 2025-08-11 | 13F | Trajan Wealth LLC | 27 740 | −8,04 | 2 962 | −7,35 | ||||
| 2025-05-15 | 13F | Engineers Gate Manager LP | 0 | −100,00 | 0 | |||||
| 2025-07-15 | 13F | Td Private Client Wealth Llc | 716 | −3,11 | 76 | −2,56 | ||||
| 2025-08-14 | 13F | Integrated Investment Consultants, LLC | 0 | −100,00 | 0 | |||||
| 2025-08-14 | 13F | Synovus Financial Corp | 561 865 | 6,00 | 60 002 | 6,77 | ||||
| 2025-08-13 | 13F | Sepio Capital, LP | 62 984 | 9,81 | 6 726 | 10,63 | ||||
| 2025-08-08 | 13F | Union Savings Bank | 34 797 | 2,56 | 3 702 | 2,89 | ||||
| 2025-08-19 | 13F | Advisory Services Network, LLC | 15 080 | −5,20 | 1 604 | −4,86 | ||||
| 2025-08-14 | 13F | Stifel Financial Corp | 1 678 087 | −9,78 | 179 203 | −9,12 | ||||
| 2025-07-21 | 13F | Ascent Group, LLC | 5 947 | −28,39 | 635 | −27,84 | ||||
| 2025-07-30 | 13F | D.a. Davidson & Co. | 2 042 | 0,00 | 218 | 0,93 | ||||
| 2025-08-01 | 13F | Envestnet Asset Management Inc | 1 050 413 | −7,00 | 112 166 | −6,33 | ||||
| 2025-08-13 | 13F | Orleans Capital Management Corp/la | 2 300 | 246 | ||||||
| 2025-08-13 | 13F | Parkworth Wealth Management, Inc. | 15 | 0,00 | 2 | 0,00 | ||||
| 2025-08-13 | 13F | Congress Wealth Management LLC / DE / | 47 822 | 13,66 | 5 107 | 14,48 | ||||
| 2025-05-08 | 13F | Gables Capital Management Inc. | 0 | −100,00 | 0 | |||||
| 2025-07-11 | 13F/A | Umb Bank N A/mo | 756 198 | −5,44 | 80 754 | −4,75 | ||||
| 2025-07-30 | NP | OCIO - ClearShares OCIO ETF | 44 109 | 0,00 | 4 676 | 0,09 | ||||
| 2025-05-12 | 13F | Aveo Capital Partners, LLC | 0 | −100,00 | 0 | |||||
| 2025-07-23 | 13F | Country Club Bank /gfn | 176 740 | 2,20 | 18 840 | 2,88 | ||||
| 2025-08-14 | 13F/A | Skopos Labs, Inc. | 4 209 | 449 | ||||||
| 2025-05-01 | 13F | Stephens Inc /ar/ | 0 | −100,00 | 0 | −100,00 | ||||
| 2025-08-14 | 13F | Betterment LLC | 18 435 | −1,37 | 2 | 0,00 | ||||
| 2025-07-25 | 13F | Sequoia Financial Advisors, LLC | 65 025 | 4,59 | 6 944 | 5,36 | ||||
| 2025-08-15 | 13F | Captrust Financial Advisors | 183 828 | 5,71 | 19 631 | 6,48 | ||||
| 2025-08-18 | 13F | Finward Bancorp | 7 900 | 0,00 | 844 | 0,72 | ||||
| 2025-08-14 | 13F | Ancora Advisors, LLC | 9 198 | 9,60 | 982 | 10,46 | ||||
| 2025-08-07 | 13F | Midwest Trust Co | 1 007 399 | 107 580 | ||||||
| 2025-07-25 | 13F | Envestnet Portfolio Solutions, Inc. | 182 014 | −1,85 | 19 437 | −1,13 | ||||
| 2025-08-12 | 13F | Charles Schwab Investment Management Inc | 115 707 | −2,47 | 12 356 | −1,76 | ||||
| 2025-08-14 | 13F | Advisor OS, LLC | 5 309 | 3,23 | 567 | 3,85 | ||||
| 2025-07-09 | 13F | Massmutual Trust Co Fsb/adv | 42 602 | 6,00 | 4 549 | 6,78 | ||||
| 2025-08-14 | 13F | Integrated Wealth Concepts LLC | 6 081 | 11,89 | 649 | 12,67 | ||||
| 2025-08-06 | 13F | Legacy Wealth Managment, LLC/ID | 17 | 0,00 | 2 | 0,00 | ||||
| 2025-08-01 | 13F | Wincap Financial Llc | 0 | −100,00 | 0 | |||||
| 2025-07-28 | 13F | Courier Capital Llc | 77 218 | 6,32 | 8 246 | 7,09 | ||||
| 2025-08-07 | 13F | Guidance Capital, Inc | 2 033 | −5,40 | 217 | −4,41 | ||||
| 2025-08-14 | 13F | Hrt Financial Lp | 3 590 | 0 | ||||||
| 2025-08-05 | 13F | Huntington National Bank | 270 | −15,67 | ||||||
| 2025-08-01 | 13F | First Command Advisory Services, Inc. | 229 | 0,00 | 24 | 0,00 | ||||
| 2025-07-10 | 13F | Bigelow Investment Advisors, LLC | 11 386 | 21,15 | 1 216 | 21,99 | ||||
| 2025-07-17 | 13F | Charles Schwab Trust Co | 8 038 | 858 | ||||||
| 2025-07-30 | 13F | First Citizens Bank & Trust Co | 175 914 | −0,96 | 18 786 | −0,24 | ||||
| 2025-07-17 | 13F | One Wealth Advisors, LLC | 7 488 | 0,00 | 800 | 0,76 | ||||
| 2025-08-01 | 13F | Strategic Financial Services, Inc, | 284 170 | −4,95 | 30 347 | −4,26 | ||||
| 2025-08-11 | 13F | First American Trust, Fsb | 151 590 | 1,22 | 16 188 | 1,96 | ||||
| 2025-07-14 | 13F | Opal Wealth Advisors, LLC | 18 459 | −46,54 | 1 971 | −46,15 | ||||
| 2025-07-24 | 13F | Capital Advisors, Ltd. LLC | 106 | 0,00 | 0 | |||||
| 2025-07-24 | 13F | Conning Inc. | 0 | −100,00 | 0 | |||||
| 2025-08-14 | 13F | CoreCap Advisors, LLC | 277 | 0,00 | 30 | 0,00 | ||||
| 2025-08-14 | 13F | German American Bancorp, Inc. | 833 504 | 0,33 | 89 010 | 1,05 | ||||
| 2025-08-07 | 13F | Allworth Financial LP | 21 | 0,00 | 2 | 0,00 | ||||
| 2025-04-15 | 13F | Orgel Wealth Management, LLC | 0 | −100,00 | 0 | |||||
| 2025-08-14 | 13F | Boston Private Wealth Llc | 53 964 | 5 763 | ||||||
| 2025-08-12 | 13F | OneAscent Financial Services LLC | 53 868 | −49,72 | 6 | −54,55 | ||||
| 2025-08-13 | 13F | GM Advisory Group, Inc. | 4 771 | 509 | ||||||
| 2025-07-31 | 13F | Hanlon Investment Management, Inc. | 3 044 | −7,95 | 325 | −7,14 | ||||
| 2025-07-10 | 13F | Wealth Enhancement Advisory Services, Llc | 84 234 | −2,00 | 8 938 | −1,91 | ||||
| 2025-07-11 | 13F | Trust Co Of Virginia /va | 408 955 | 3,36 | 43 672 | 4,11 | ||||
| 2025-06-03 | 13F/A | First National Bank Of Omaha | 27 985 | 17,78 | 2 967 | 19,16 | ||||
| 2025-07-24 | 13F | Us Bancorp \de\ | 368 792 | −7,59 | 39 383 | −6,91 | ||||
| 2025-07-25 | 13F | Mitchell Sinkler & Starr/pa | 11 425 | 23,31 | 1 220 | 24,24 | ||||
| 2025-08-14 | 13F | RMB Capital Management, LLC | 0 | −100,00 | 0 | |||||
| 2025-09-04 | 13F/A | Advisor Group Holdings, Inc. | 73 674 | 188,01 | 7 831 | 188,75 | ||||
| 2025-08-05 | 13F | Bank Of Montreal /can/ | 74 570 | −1,56 | 7 963 | −0,83 | ||||
| 2025-08-12 | 13F | Pettyjohn, Wood & White, Inc | 3 906 | 4,41 | 417 | 5,30 | ||||
| 2025-08-07 | 13F | Resources Investment Advisors, LLC. | 7 448 | −9,17 | 795 | −8,52 | ||||
| 2025-07-22 | 13F | DT Investment Partners, LLC | 353 745 | −5,92 | 37 776 | −5,23 | ||||
| 2025-08-01 | 13F | First National Trust Co | 60 582 | 0,68 | 6 470 | 1,41 | ||||
| 2025-08-06 | 13F | Commonwealth Equity Services, Llc | 56 025 | 7,06 | 6 | 0,00 | ||||
| 2025-07-30 | 13F | Sanders Morris Harris Llc | 3 500 | 0,00 | 374 | 0,54 | ||||
| 2025-07-31 | 13F | CVA Family Office, LLC | 205 | 0,00 | 22 | 0,00 | ||||
| 2025-08-14 | 13F | Bbr Partners, Llc | 2 506 | 0,00 | 268 | 0,75 | ||||
| 2025-08-14 | 13F | UBS Group AG | 53 871 | 5,71 | 5 753 | 6,48 | ||||
| 2025-07-21 | 13F | Mendota Financial Group, LLC | 29 | 0,00 | 3 | 0,00 | ||||
| 2025-07-09 | 13F | Dynamic Advisor Solutions LLC | 3 120 | 0,00 | 333 | 0,91 | ||||
| 2025-07-21 | 13F | Empirical Financial Services, LLC d.b.a. Empirical Wealth Management | 1 902 | −2,56 | 203 | −1,46 | ||||
| 2025-08-12 | 13F | Heritage Trust Co | 17 691 | 0,00 | 1 889 | 0,75 | ||||
| 2025-07-17 | 13F | Park Place Capital Corp | 7 500 | −25,00 | 798 | −24,81 | ||||
| 2025-07-21 | 13F | Stock Yards Bank & Trust Co | 2 092 | 223 | ||||||
| 2025-08-04 | 13F | Hantz Financial Services, Inc. | 118 644 | −1,23 | 13 | 0,00 | ||||
| 2025-08-14 | 13F | Wiley Bros.-aintree Capital, Llc | 6 786 | 17,57 | 726 | 19,44 | ||||
| 2025-08-04 | 13F | Keybank National Association/oh | 960 611 | 8,67 | 102 584 | 9,46 | ||||
| 2025-08-14 | 13F | Mml Investors Services, Llc | 7 405 | −10,91 | 1 | |||||
| 2025-07-22 | 13F | Old National Bancorp /in/ | 17 254 | −1,37 | 1 843 | −0,65 | ||||
| 2025-08-05 | 13F | Aviance Capital Partners, LLC | 7 186 | −2,47 | 767 | −1,79 | ||||
| 2025-08-06 | 13F | Prospera Financial Services Inc | 8 248 | 169,90 | 881 | 171,91 | ||||
| 2025-08-13 | 13F | Cerity Partners LLC | 0 | −100,00 | 0 | |||||
| 2025-08-14 | 13F | Hilltop Holdings Inc. | 6 112 | 5,47 | 653 | 6,19 | ||||
| 2025-07-24 | 13F | Jfs Wealth Advisors, Llc | 730 | 0,00 | 78 | 0,00 | ||||
| 2025-08-13 | 13F/A | StoneX Group Inc. | 3 743 | 49,00 | 379 | 46,90 | ||||
| 2025-07-08 | 13F | Webster Bank, N. A. | 105 119 | 10,94 | 11 226 | 11,75 | ||||
| 2025-07-10 | 13F | Global Financial Private Client, LLC | 0 | −100,00 | 0 | |||||
| 2025-05-14 | 13F | Van Hulzen Asset Management, LLC | 0 | −100,00 | 0 | −100,00 | ||||
| 2025-07-28 | 13F | Harbour Investments, Inc. | 181 | 0,00 | 19 | 0,00 | ||||
| 2025-07-25 | 13F | Meritage Portfolio Management | 48 309 | −0,41 | 5 159 | 0,31 | ||||
| 2025-07-10 | 13F | Community Trust & Investment Co | 109 920 | 30,72 | 11 738 | 31,67 | ||||
| 2025-08-11 | 13F | Wealthspire Advisors, LLC | 3 460 | −0,97 | 369 | −0,27 | ||||
| 2025-07-24 | 13F | Eastern Bank | 2 377 520 | 28,39 | 253 895 | 29,32 | ||||
| 2025-08-13 | 13F | Northwestern Mutual Wealth Management Co | 1 490 | 115,94 | 159 | 117,81 | ||||
| 2025-08-12 | 13F | Bokf, Na | 119 080 | 0,00 | 12 717 | 0,73 | ||||
| 2025-08-15 | 13F | Morgan Stanley | 501 286 | −15,73 | 53 532 | −15,12 | ||||
| 2025-08-01 | 13F | Financial Counselors Inc | 0 | −100,00 | 0 | |||||
| 2025-05-05 | 13F | Atlantic Union Bankshares Corp | 0 | −100,00 | 0 | |||||
| 2025-07-28 | 13F | Allianz Asset Management GmbH | 259 817 | 0,31 | 27 746 | 1,04 | ||||
| 2025-08-14 | 13F | Prudent Investors Network | 2 896 | 0,00 | 309 | 0,65 | ||||
| 2025-04-03 | 13F | First Hawaiian Bank | 98 233 | 0,23 | 10 415 | 1,96 | ||||
| 2025-07-17 | 13F | HB Wealth Management, LLC | 2 450 | 262 | ||||||
| 2025-08-01 | 13F | Oarsman Capital, Inc. | 322 816 | 4,10 | 34 474 | 4,86 | ||||
| 2025-08-14 | 13F | Mercer Global Advisors Inc /adv | 2 595 | −15,22 | 277 | −14,51 | ||||
| 2025-08-12 | 13F | Proequities, Inc. | 0 | 0 | ||||||
| 2025-07-17 | 13F | Beacon Capital Management, LLC | 9 | 0,00 | 1 | |||||
| 2025-08-14 | 13F | C M Bidwell & Associates Ltd | 58 330 | 0,57 | 6 229 | 1,30 | ||||
| 2025-08-06 | 13F | AE Wealth Management LLC | 257 | 0,00 | 27 | 0,00 | ||||
| 2025-08-01 | 13F | Advisory Alpha, LLC | 7 624 | −60,78 | 814 | −60,49 | ||||
| 2025-08-13 | 13F | Baird Financial Group, Inc. | 34 669 | −0,32 | 3 702 | 0,41 | ||||
| 2025-08-14 | 13F | Colony Group, LLC | 12 792 | −3,92 | 1 366 | −3,19 | ||||
| 2025-08-14 | 13F | Prelude Capital Management, Llc | 0 | −100,00 | 0 | |||||
| 2025-08-13 | 13F | Johnson Financial Group, Inc. | 104 847 | −9,07 | 11 197 | −8,41 | ||||
| 2025-08-14 | 13F | Raymond James Financial Inc | 8 722 | −38,48 | 931 | −38,06 | ||||
| 2025-08-11 | 13F | HighTower Advisors, LLC | 34 521 | −18,57 | 3 686 | −17,98 | ||||
| 2025-08-13 | 13F | Haverford Trust Co | 38 736 | 6,95 | 4 137 | 7,71 | ||||
| 2025-05-14 | 13F | Brown Brothers Harriman & Co | 0 | −100,00 | 0 | |||||
| 2025-08-05 | 13F | Optivise Advisory Services LLC | 2 311 | 0,00 | 247 | 0,41 | ||||
| 2025-08-06 | 13F | Csenge Advisory Group | 8 497 | 0,24 | 901 | 0,45 | ||||
| 2025-07-25 | 13F | Atria Wealth Solutions, Inc. | 4 390 | −33,80 | 469 | −33,33 | ||||
| 2025-07-18 | 13F | Trust Co Of Vermont | 38 | 0,00 | 4 | 0,00 | ||||
| 2025-08-14 | 13F | Citadel Advisors Llc | 18 056 | −78,32 | 1 928 | −78,17 | ||||
| 2025-08-14 | 13F | Wells Fargo & Company/mn | 278 458 | 5,01 | 29 737 | 5,78 | ||||
| 2025-08-13 | 13F | D L Carlson Investment Group Inc | 401 424 | 11,80 | 42 868 | 12,61 | ||||
| 2025-04-09 | 13F | Arlington Financial Advisors, LLC | 0 | −100,00 | 0 | |||||
| 2025-07-30 | 13F | Princeton Global Asset Management LLC | 300 | −62,50 | 32 | −61,90 | ||||
| 2025-08-14 | 13F | Ameriprise Financial Inc | 37 918 | −2,46 | 4 049 | −1,75 | ||||
| 2025-07-24 | 13F | Blair William & Co/il | 540 | −3,05 | 58 | −3,39 | ||||
| 2025-07-16 | 13F | Maridea Wealth Management LLC | 6 984 | 0,00 | 746 | 0,68 | ||||
| 2025-05-13 | 13F | Sand Hill Global Advisors, LLC | 0 | −100,00 | 0 | |||||
| 2025-08-01 | 13F | Bessemer Group Inc | 157 181 | 1,60 | 17 | 0,00 | ||||
| 2025-07-25 | 13F | Natural Investments, Llc | 0 | −100,00 | 0 | |||||
| 2025-07-29 | 13F | Swmg, Llc | 0 | −100,00 | 0 | |||||
| 2025-09-03 | 13F | American Trust | 2 379 | 254 | ||||||
| 2025-04-09 | 13F | Harbor Investment Advisory, Llc | 0 | −100,00 | 0 | |||||
| 2025-08-13 | 13F | Continuum Advisory, LLC | 0 | −100,00 | 0 | |||||
| 2025-07-09 | 13F | Alesco Advisors Llc | 17 910 | 0,14 | 1 913 | 0,84 | ||||
| 2025-08-05 | 13F | Tsfg, Llc | 52 | 1,96 | 0 | |||||
| 2025-07-16 | 13F | Perigon Wealth Management, LLC | 2 024 | −0,30 | 216 | 0,47 | ||||
| 2025-07-29 | 13F | Alaska Permanent Capital Management | 236 852 | 18,18 | 25 291 | 19,06 | ||||
| 2025-08-11 | 13F | Heritage Wealth Advisors | 93 | 1,09 | 10 | 0,00 | ||||
| 2025-08-14 | 13F | Goldman Sachs Group Inc | 9 729 | 11,46 | 1 039 | 12,22 | ||||
| 2025-08-18 | 13F | Geneos Wealth Management Inc. | 1 490 | 0,00 | 159 | 1,27 | ||||
| 2025-07-24 | 13F | Stonebridge Financial Group, LLC | 2 975 | −22,22 | 318 | −21,73 | ||||
| 2025-07-24 | 13F | Wealthstar Advisors, Llc | 36 380 | −24,46 | 3 885 | −23,93 | ||||
| 2025-08-11 | 13F | Beaumont Capital Management, LLC | 6 553 | 122,97 | 700 | 124,76 | ||||
| 2025-08-01 | 13F | New York Life Investment Management Llc | 286 461 | 0,00 | 30 591 | 0,73 | ||||
| 2025-08-12 | 13F | J.w. Cole Advisors, Inc. | 3 153 | 337 | ||||||
| 2025-07-15 | 13F | Unified Investment Management | 17 432 | 0,02 | 1 862 | 0,76 | ||||
| 2025-07-22 | 13F | Schwab Charitable Fund | 6 893 | 0,00 | 736 | 0,82 | ||||
| 2025-07-07 | 13F | Bangor Savings Bank | 9 343 | −15,39 | 998 | −14,79 | ||||
| 2025-08-13 | 13F | M&t Bank Corp | 119 906 | 6,33 | 12 805 | 7,11 | ||||
| 2025-08-08 | 13F | Atlantic Trust, LLC | 1 465 | 156 | ||||||
| 2025-08-14 | 13F | Mariner, LLC | 4 035 | 431 | ||||||
| 2025-08-14 | 13F | Old Mission Capital Llc | 0 | −100,00 | 0 | |||||
| 2025-07-02 | 13F | First Financial Bank - Trust Division | 14 384 | 6,86 | 1 536 | 7,64 | ||||
| 2025-07-21 | 13F | Kennebec Savings Bank | 1 331 | −1,48 | 142 | −0,70 | ||||
| 2025-08-01 | 13F | Koss-Olinger Consulting, LLC | 226 372 | −9,08 | 24 174 | −8,41 | ||||
| 2025-07-29 | 13F | Koshinski Asset Management, Inc. | 7 562 | 15,91 | 808 | 16,79 | ||||
| 2025-08-06 | 13F | Wsfs Capital Management, Llc | 53 270 | −14,21 | 5 689 | −13,58 | ||||
| 2025-08-08 | 13F | Hartland & Co., LLC | 4 126 | 0,59 | 441 | 1,38 | ||||
| 2025-08-04 | 13F | AMG National Trust Bank | 74 976 | 4,11 | 8 007 | 4,86 | ||||
| 2025-05-12 | 13F | Sandy Spring Bank | 0 | −100,00 | 0 | |||||
| 2025-08-08 | 13F | WASHINGTON TRUST Co | 151 877 | −1,90 | 16 219 | −1,19 | ||||
| 2025-08-12 | 13F | Integrated Advisors Network LLC | 5 146 | 0,92 | 550 | 1,67 | ||||
| 2025-07-14 | 13F | Farmers & Merchants Investments Inc | 0 | −100,00 | 0 | |||||
| 2025-07-31 | 13F | Ssa Swiss Advisors Ag | 8 911 | 15,26 | 949 | 15,75 | ||||
| 2025-08-13 | 13F | Hsbc Holdings Plc | 46 841 | −2,02 | 5 002 | −1,30 | ||||
| 2025-08-14 | 13F | Fmr Llc | 813 | −27,80 | 87 | −27,73 | ||||
| 2025-07-11 | 13F | Farther Finance Advisors, LLC | 359 | 0,28 | 38 | 2,70 | ||||
| 2025-07-21 | 13F | Keystone Financial Group, Inc. | 691 | 122,19 | 73 | 128,13 | ||||
| 2025-07-22 | 13F | Cornerstone Partners Capital Management, Llc | 0 | −100,00 | 0 | |||||
| 2025-08-11 | 13F | Citigroup Inc | 13 046 | 74,02 | 1 393 | 75,44 | ||||
| 2025-08-12 | 13F | CIBC Private Wealth Group, LLC | 1 001 432 | 10,22 | 106 943 | 11,55 | ||||
| 2025-06-24 | NP | MBNAX - MainStay Balanced Fund Class A | 159 088 | 69,94 | 16 954 | 72,95 | ||||
| 2025-05-15 | 13F | Millennium Management Llc | 0 | −100,00 | 0 | −100,00 | ||||
| 2025-08-08 | 13F | Pnc Financial Services Group, Inc. | 607 027 | −0,07 | 64 824 | 0,66 | ||||
| 2025-08-13 | 13F | Kayne Anderson Rudnick Investment Management Llc | 11 263 | 34,34 | 1 203 | 35,36 | ||||
| 2025-08-11 | 13F | Principal Securities, Inc. | 3 752 | 26,71 | 401 | 29,87 | ||||
| 2025-08-14 | 13F | Bank Of America Corp /de/ | 1 634 803 | −10,44 | 174 581 | −9,79 | ||||
| 2025-05-16 | 13F | Logan Capital Management Inc | 0 | −100,00 | 0 | −100,00 | ||||
| 2025-07-21 | 13F | Zwj Investment Counsel Inc | 2 842 | 0,11 | 303 | 1,00 | ||||
| 2025-08-13 | 13F | Flow Traders U.s. Llc | 68 197 | 7 | ||||||
| 2025-08-14 | 13F | Transamerica Financial Advisors, Inc. | 21 988 | 2 348 | ||||||
| 2025-08-14 | 13F | Kovitz Investment Group Partners, LLC | 6 570 | −13,69 | 702 | −13,14 | ||||
| 2025-05-02 | 13F | Dravo Bay Llc | 0 | −100,00 | 0 | |||||
| 2025-08-08 | 13F | Creative Planning | 2 303 | 246 | ||||||
| 2025-08-13 | 13F | Jones Financial Companies Lllp | 1 563 | 74,64 | 167 | 76,60 | ||||
| 2025-07-09 | 13F | High Probability Advisors, LLC | 4 793 | 0,88 | 512 | 1,59 | ||||
| 2025-04-16 | 13F | Fortitude Family Office, LLC | 0 | −100,00 | 0 | |||||
| 2025-09-03 | 13F | Ballentine Capital Advisors, Inc | 3 471 | 0,00 | 371 | 0,82 | ||||
| 2025-08-14 | 13F | Harwood Advisory Group, LLC | 8 092 | −6,20 | 864 | −3,89 | ||||
| 2025-08-08 | 13F | Cetera Investment Advisers | 152 807 | 0,60 | 16 318 | 1,33 | ||||
| 2025-08-06 | 13F | Wedbush Securities Inc | 7 831 | 0,37 | 1 | |||||
| 2025-07-18 | 13F | Bartlett & Co. Wealth Management Llc | 1 186 | 0,51 | 127 | 0,80 | ||||
| 2025-08-12 | 13F | LPL Financial LLC | 188 925 | −17,04 | 20 175 | −16,44 | ||||
| 2025-07-21 | 13F | Patriot Financial Group Insurance Agency, LLC | 42 724 | 3,05 | 4 563 | 3,80 | ||||
| 2025-08-12 | 13F | Laurel Wealth Advisors LLC | 2 136 | 10 580,00 | 0 | −100,00 | ||||
| 2025-07-28 | 13F | BRYN MAWR TRUST Co | 20 919 | −13,13 | 2 234 | −12,50 | ||||
| 2025-08-05 | 13F | Meridian Management Co | 182 443 | 9,37 | 19 408 | 9,74 | ||||
| 2025-07-23 | 13F | Independent Solutions Wealth Management, LLC | 92 777 | 0,01 | 9 908 | 0,74 | ||||
| 2025-07-29 | 13F | Curbstone Financial Management Corp | 4 866 | 520 | ||||||
| 2025-07-23 | 13F | First Merchants Corp | 75 654 | −12,49 | 8 079 | −11,85 | ||||
| 2025-08-01 | 13F | Fort Vancouver Investment Management, LLC | 56 | −30,00 | 6 | −37,50 | ||||
| 2025-07-21 | 13F | Ameritas Advisory Services, LLC | 405 | 43 | ||||||
| 2025-08-04 | 13F | Jim Saulnier & Associates, Llc | 33 393 | −7,77 | 3 566 | −7,09 | ||||
| 2025-08-19 | 13F | Cape Investment Advisory, Inc. | 2 | −33,33 | 0 | |||||
| 2025-07-29 | 13F | TFC Financial Management | 74 | −97,01 | 8 | −97,33 | ||||
| 2025-08-14 | 13F | Hancock Whitney Corp | 17 933 | 1,39 | 1 915 | 2,13 | ||||
| 2025-07-08 | 13F | Legacy Private Trust Co. | 27 614 | 108,00 | 2 949 | 109,52 | ||||
| 2025-07-21 | 13F | Greenwood Capital Associates Llc | 135 305 | 1,46 | 14 449 | 2,20 | ||||
| 2025-08-25 | NP | MAINSTAY VP FUNDS TRUST - MainStay VP Balanced Portfolio Initial Class | 127 373 | 0,00 | 13 602 | 0,73 | ||||
| 2025-05-13 | 13F | Heck Capital Advisors, LLC | 0 | −100,00 | 0 | −100,00 | ||||
| 2025-08-13 | 13F | Dana Investment Advisors, Inc. | 10 245 | 8,34 | 1 094 | 9,18 | ||||
| 2025-08-06 | 13F | Legacy Investment Solutions, LLC | 17 | 0,00 | 2 | 0,00 | ||||
| 2025-07-17 | 13F | Sound Income Strategies, LLC | 234 | 0,00 | 25 | 0,00 | ||||
| 2025-08-08 | 13F | Avantax Advisory Services, Inc. | 47 327 | 11,98 | 5 054 | 12,81 | ||||
| 2025-08-07 | 13F | Donaldson Capital Management, Llc | 0 | −100,00 | 0 | |||||
| 2025-08-11 | 13F | Rothschild Investment Llc | 775 | −13,89 | 83 | −13,68 | ||||
| 2025-08-14 | 13F | Lazard Asset Management Llc | 0 | |||||||
| 2025-08-14 | 13F | Warren Averett Asset Management, LLC | 4 319 | 0,00 | 461 | 0,88 | ||||
| 2025-08-15 | 13F | CI Private Wealth, LLC | 3 198 | −21,23 | 342 | −20,70 | ||||
| 2025-07-23 | 13F | Indiana Trust & Investment Management CO | 4 652 | 0,00 | 497 | 0,61 | ||||
| 2025-08-12 | 13F | Jpmorgan Chase & Co | 509 211 | −36,09 | 54 379 | −35,62 | ||||
| 2025-08-04 | 13F | Pensionmark Financial Group, Llc | 20 231 | −43,99 | 2 160 | −43,59 | ||||
| 2025-08-11 | 13F | Wbi Investments, Inc. | 18 404 | −0,67 | 1 965 | 0,05 | ||||
| 2025-08-12 | 13F | Global Retirement Partners, LLC | 31 640 | −21,26 | 3 379 | −19,34 | ||||
| 2025-07-29 | 13F | Private Trust Co Na | 6 309 | −12,22 | 674 | −11,56 | ||||
| 2025-08-13 | 13F | Brown Advisory Inc | 14 242 | 46,19 | 1 521 | 47,29 | ||||
| 2025-08-14 | 13F | Comerica Bank | 18 754 | −75,22 | 2 003 | −75,05 | ||||
| 2025-08-13 | 13F | SageView Advisory Group, LLC | 2 761 | 0,00 | 293 | 0,34 | ||||
| 2025-07-15 | 13F | Graypoint LLC | 2 197 | 0,05 | 235 | 0,86 | ||||
| 2025-08-18 | 13F | N.E.W. Advisory Services LLC | 106 | 0,00 | 11 | 0,00 | ||||
| 2025-07-17 | 13F | Greenleaf Trust | 158 890 | −6,83 | 16 968 | −6,16 | ||||
| 2025-07-22 | 13F | Vantage Investment Partners, LLC | 12 239 | 22,68 | 1 307 | 23,65 | ||||
| 2025-07-17 | 13F | Paradigm Financial Partners, Llc | 5 132 | 2,27 | 548 | 3,01 | ||||
| 2025-07-30 | 13F | Capital Investment Services of America, Inc. | 18 225 | −0,74 | 1 946 | 0,00 | ||||
| 2025-08-07 | 13F | 1st Source Bank | 45 817 | −5,27 | 4 893 | −4,58 | ||||
| 2025-08-08 | 13F | Gts Securities Llc | 3 553 | 379 | ||||||
| 2025-07-14 | 13F | AdvisorNet Financial, Inc | 92 | 0,00 | 10 | 0,00 | ||||
| 2025-07-11 | 13F | Caldwell Securities, Inc | 170 | 0,00 | 18 | 0,00 | ||||
| 2025-07-11 | 13F | BTC Capital Management, Inc. | 5 441 | 581 | ||||||
| 2025-08-11 | 13F | Delta Asset Management Llc/tn | 130 | 0,00 | 14 | 0,00 | ||||
| 2025-04-21 | 13F | True Link Financial Advisors, LLC | 0 | −100,00 | 0 | |||||
| 2025-08-13 | 13F | Azimuth Capital Investment Management LLC | 9 661 | 6,27 | 1 032 | 7,06 | ||||
| 2025-07-18 | 13F | Truist Financial Corp | 50 913 | −38,49 | 5 437 | −38,05 | ||||
| 2025-04-30 | 13F | Stratos Wealth Advisors, LLC | 0 | −100,00 | 0 | |||||
| 2025-07-30 | 13F | Patten Group, Inc. | 20 045 | 12,79 | 2 141 | 13,59 | ||||
| 2025-07-09 | 13F | Bank of New Hampshire | 78 769 | 8,73 | 8 412 | 9,52 | ||||
| 2025-08-05 | 13F | Centennial Bank/AR/ | 4 508 | 481 | ||||||
| 2025-07-23 | 13F | Proffitt & Goodson Inc | 19 966 | 0,00 | 2 132 | 0,76 | ||||
| 2025-08-13 | 13F | Renaissance Technologies Llc | 55 300 | 4,73 | 5 905 | 5,50 | ||||
| 2025-08-01 | 13F | FSA Advisors, Inc. | 0 | −100,00 | 0 | |||||
| 2025-07-23 | 13F | Nbt Bank N A /ny | 5 939 | −53,77 | 634 | −53,45 | ||||
| 2025-08-08 | 13F | Capital Investment Advisory Services, LLC | 65 | 1,56 | 7 | 0,00 | ||||
| 2025-07-30 | 13F | Phillips Financial Management, Llc | 1 315 | 0,00 | 140 | 0,72 | ||||
| 2025-08-05 | 13F | Trail Ridge Investment Advisors, LLC | 44 685 | 2,56 | 4 754 | 2,90 | ||||
| 2025-08-04 | 13F | MeadowBrook Investment Advisors LLC | 0 | −100,00 | 0 | |||||
| 2025-08-08 | 13F | Renasant Bank | 7 500 | −25,00 | 801 | −24,53 | ||||
| 2025-08-11 | 13F | Lowe Brockenbrough & Co Inc | 118 644 | 0,28 | 12 670 | 1,00 | ||||
| 2025-08-18 | 13F | Tactive Advisors, LLC | 2 379 | 254 | ||||||
| 2025-08-12 | 13F | Putnam Fl Investment Management Co | 199 344 | 0,11 | 21 288 | 0,83 | ||||
| 2025-07-07 | 13F | Wesbanco Bank Inc | 8 502 | 35,23 | 908 | 36,19 | ||||
| 2025-08-07 | 13F | Montag A & Associates Inc | 19 529 | 6,32 | 2 086 | 7,09 | ||||
| 2025-08-14 | 13F | Bnp Paribas Arbitrage, Sa | 0 | −100,00 | 0 | |||||
| 2025-08-14 | 13F | Jane Street Group, Llc | 39 609 | −57,55 | 4 230 | −57,24 | ||||
| 2025-08-12 | 13F | Steward Partners Investment Advisory, Llc | 525 | 0,00 | 56 | 1,82 | ||||
| 2025-07-24 | 13F | Horizon Bancorp Inc /in/ | 267 752 | −1,91 | 29 | 0,00 | ||||
| 2025-07-25 | 13F | Apollon Wealth Management, LLC | 0 | −100,00 | 0 | |||||
| 2025-08-07 | 13F | Commerce Bank | 43 810 | −9,04 | 4 678 | −8,38 | ||||
| 2025-08-01 | 13F | James Investment Research Inc | 3 766 | 0,00 | 402 | 0,75 | ||||
| 2025-08-13 | 13F | Rsm Us Wealth Management Llc | 61 460 | 0,00 | 6 563 | 0,74 | ||||
| 2025-07-25 | 13F | Richardson Financial Services Inc. | 110 | 0,00 | 12 | 0,00 | ||||
| 2025-08-14 | 13F | FC Advisory LLC | 5 081 | 4,44 | 543 | 5,24 | ||||
| 2025-08-11 | 13F | United Capital Financial Advisers, Llc | 74 696 | 0,14 | 7 977 | 0,86 | ||||
| 2025-07-22 | 13F | DAVENPORT & Co LLC | 213 756 | 3,72 | 22 827 | 4,48 | ||||
| 2025-08-04 | 13F | Atria Investments Llc | 48 426 | 2,63 | 5 171 | 3,38 | ||||
| 2025-07-30 | 13F | Whittier Trust Co Of Nevada Inc | 29 607 | 0,00 | 3 162 | 0,73 | ||||
| 2025-07-16 | 13F | Badgley Phelps Wealth Managers, LLC | 102 175 | 3,08 | 10 911 | 3,84 | ||||
| 2025-04-10 | 13F | Chatham Capital Group, Inc. | 0 | −100,00 | 0 | |||||
| 2025-07-31 | 13F | Oppenheimer & Co Inc | 7 780 | −0,80 | 831 | −0,12 | ||||
| 2025-08-04 | 13F | Assetmark, Inc | 301 816 | −3,10 | 32 231 | −2,40 | ||||
| 2025-07-30 | 13F | Whittier Trust Co | 51 631 | −3,77 | 5 514 | −3,08 | ||||
| 2025-08-12 | 13F | BlackRock, Inc. | 318 225 | −0,83 | 33 983 | −0,11 | ||||
| 2025-07-29 | 13F | Regions Financial Corp | 19 913 | 10,57 | 2 127 | 11,37 | ||||
| 2025-08-11 | 13F | Lcnb Corp | 15 000 | 25,00 | 1 602 | 25,86 | ||||
| 2025-08-14 | 13F | Susquehanna International Group, Llp | Put | 6 000 | 641 | |||||
| 2025-07-15 | 13F | Fifth Third Bancorp | 1 125 112 | −2,01 | 120 151 | −1,30 | ||||
| 2025-08-14 | 13F | Susquehanna International Group, Llp | 56 802 | 450,41 | 6 066 | 454,39 | ||||
| 2025-07-31 | 13F | New Hampshire Trust | 14 704 | 25,03 | 1 570 | 26,00 | ||||
| 2025-08-11 | 13F | Private Advisor Group, LLC | 40 933 | −10,91 | 4 371 | −10,26 | ||||
| 2025-07-14 | 13F | S.A. Mason LLC | 900 | 0,00 | 96 | 1,05 | ||||
| 2025-08-05 | 13F | Bank of New York Mellon Corp | 582 293 | 3,49 | 62 183 | 4,24 | ||||
| 2025-07-14 | 13F | GAMMA Investing LLC | 3 144 | 6,32 | 336 | 7,03 |
Other Listings
| MX:GVI |