Grundläggande statistik
| Institutionella ägare | 94 total, 92 long only, 0 short only, 2 long/short - change of 1,06% MRQ |
| Genomsnittlig portföljallokering | 0.1781 % - change of 7,91% MRQ |
| Institutionella aktier (lång) | 8 213 692 (ex 13D/G) - change of 1,98MM shares 31,71% MRQ |
| Institutionellt värde (lång) | $ 118 131 USD ($1000) |
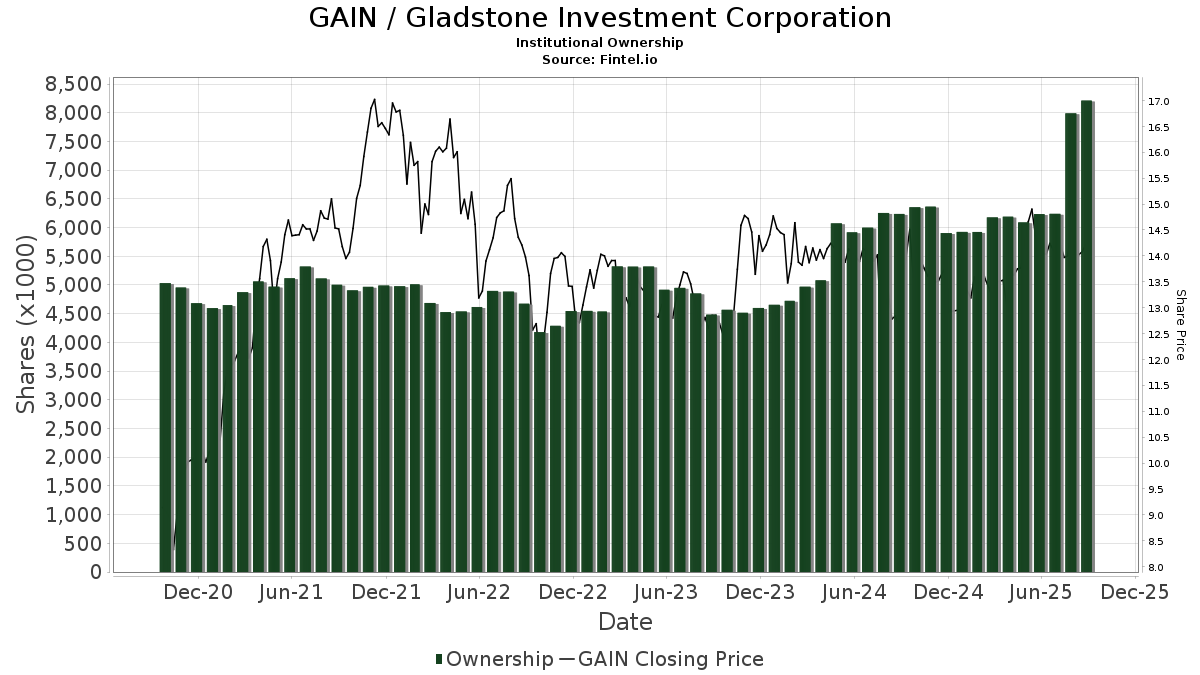
Institutionellt ägande och aktieägare
Gladstone Investment Corporation (US:GAIN) har 94 Institutionella ägare och aktieägare som har lämnat in 13D/G- eller 13F-formulär till Securities Exchange Commission (SEC). Dessa institut innehar totalt 8,213,692 aktier. Största aktieägare inkluderar Kingstone Capital Partners Texas, LLC, Melia Wealth LLC, Van Eck Associates Corp, BIZD - VanEck Vectors BDC Income ETF, Morgan Stanley, UBS Group AG, BlackRock, Inc., Legal & General Group Plc, Outfitter Financial LLC, and LPL Financial LLC .
Gladstone Investment Corporation (NasdaqGS:GAIN) Institutionell ägarstruktur visar institutioners och fonders nuvarande positioner i företaget, samt de senaste förändringarna i positionernas storlek. Större aktieägare kan vara enskilda investerare, fonder, hedgefonder eller institutioner. Bilaga 13D visar att investeraren äger (eller ägde) mer än 5% av företaget och avser (eller avsåg) att aktivt eftersträva en förändring av affärsstrategin. Schedule 13G indikerar en passiv investering på över 5%.
The share price as of September 12, 2025 is 14,23 / share. Previously, on September 16, 2024, the share price was 13,06 / share. This represents an increase of 8,96% over that period.
Fondsentimentets poäng
Fondsentimentet poängen(fka Ägarackumulation-poäng) visar vilka aktier som är mest köpta av fonder. Det är resultatet av en sofistikerad kvantitativ flerfaktormodell som identifierar företag med de högsta nivåerna av institutionell ackumulering. Poängsättningsmodellen använder en kombination av den totala ökningen av redovisade ägare, förändringarna i portföljallokeringarna för dessa ägare och andra mått. Siffran sträcker sig från 0 till 100, där högre siffror indikerar en högre nivå av ackumulering i förhållande till sina konkurrenter, och 50 är genomsnittet.
Uppdateringsfrekvens: Dagligen
Se Ownership Explorer, som innehåller en lista över de högst rankade företagen.
Institutionell sälj/köp-kvot
Förutom att rapportera vanliga eget kapital- och skuldemissioner måste institutioner med mer än 100MM tillgångar under förvaltning också avslöja sina innehav av sälj- och köpoptioner. Eftersom säljoptioner i allmänhet indikerar ett negativt sentiment och köpoptioner indikerar ett positivt sentiment, kan vi få en uppfattning om det övergripande institutionella sentimentet genom att plotta förhållandet mellan säljoptioner och köpoptioner. Diagrammet till höger visar det historiska förhållandet mellan sälj- och köpoptioner för detta instrument.
Genom att använda sälj/köp-kvoten som en indikator på aktieägarnas sentiment undviker man en av de största bristerna med att använda det totala institutionella ägandet, nämligen att en betydande del av de förvaltade tillgångarna investeras passivt för att följa index. Passivt förvaltade fonder köper vanligtvis inte optioner, så indikatorn för sälj/köp-kvoten ger en bättre bild av stämningen i aktivt förvaltade fonder.

13F- och NPORT-arkiveringar
Detaljer om 13F-arkiveringar är gratis. Detaljer om NP-arkiveringar kräver ett premiummedlemskap. Gröna rader indikerar nya positioner. Röda rader indikerar stängda positioner. Klicka på länk symbolen för att se hela transaktionshistoriken.
Uppgradera
för att låsa upp premiumdata och exportera till Excel ![]() .
.
| Fil Datum | Källa | Investerare | Typ | Genomsnittligt pris (beräknat) |
Aktier | Δ Aktier (%) |
Rapporterat värde (1000 USD) |
Δ Värde (%) |
Portföljallokering (%) |
|
|---|---|---|---|---|---|---|---|---|---|---|
| 2025-08-13 | 13F | Invesco Ltd. | 51 478 | 735 | ||||||
| 2025-08-04 | 13F | Assetmark, Inc | 845 | 12 | ||||||
| 2025-08-14 | 13F | Citadel Advisors Llc | 0 | −100,00 | 0 | |||||
| 2025-08-12 | 13F | Virtu Financial LLC | 12 592 | 0 | ||||||
| 2025-08-12 | 13F | Proequities, Inc. | Put | 0 | 0 | |||||
| 2025-08-12 | 13F | Proequities, Inc. | Call | 0 | 0 | |||||
| 2025-05-05 | 13F | Lindbrook Capital, Llc | 0 | −100,00 | 0 | |||||
| 2025-07-11 | 13F | Caldwell Securities, Inc | 800 | 0,00 | 11 | 10,00 | ||||
| 2025-08-12 | 13F | Proequities, Inc. | 0 | 0 | ||||||
| 2025-08-14 | 13F | Two Sigma Investments, Lp | 56 075 | −29,13 | 800 | −24,31 | ||||
| 2025-08-11 | 13F | Private Advisor Group, LLC | 15 751 | 0,97 | 225 | 7,69 | ||||
| 2025-07-15 | 13F | Kentucky Trust Co | 2 000 | 0,00 | 29 | 7,69 | ||||
| 2025-07-22 | 13F | Valley National Advisers Inc | 150 | 0,00 | 0 | |||||
| 2025-08-18 | 13F/A | National Bank Of Canada /fi/ | 1 000 | 0,00 | 14 | 7,69 | ||||
| 2025-05-14 | 13F | Susquehanna International Group, Llp | Call | 0 | −100,00 | 0 | −100,00 | |||
| 2025-07-23 | 13F | Hardy Reed LLC | 10 733 | 5,57 | 153 | 13,33 | ||||
| 2025-08-11 | 13F | United Advisor Group, LLC | 78 434 | 2,73 | 1 119 | 9,71 | ||||
| 2025-08-06 | 13F | Atlantic Union Bankshares Corp | 85 613 | −3,39 | 1 222 | 3,21 | ||||
| 2025-08-12 | 13F | Jpmorgan Chase & Co | 5 304 | 960,80 | 76 | 1 150,00 | ||||
| 2025-07-30 | 13F | Prosperity Financial Group, Inc. | 24 700 | −22,20 | 352 | −16,98 | ||||
| 2025-08-14 | 13F | Colony Group, LLC | 19 855 | 1,68 | 283 | 8,85 | ||||
| 2025-08-14 | 13F | Citadel Advisors Llc | Put | 0 | −100,00 | 0 | ||||
| 2025-07-21 | 13F | DHJJ Financial Advisors, Ltd. | 5 | 0,00 | 0 | |||||
| 2025-08-14 | 13F | Susquehanna International Group, Llp | 32 155 | 4,97 | 459 | 11,98 | ||||
| 2025-05-29 | NP | JAFEX - Total Stock Market Index Trust NAV | 39 | −94,73 | 1 | −100,00 | ||||
| 2025-08-14 | 13F | Qube Research & Technologies Ltd | 0 | −100,00 | 0 | |||||
| 2025-08-14 | 13F | Susquehanna International Group, Llp | Put | 71 100 | 17,52 | 1 015 | 25,50 | |||
| 2025-08-04 | 13F | Creekmur Asset Management LLC | 0 | −100,00 | 0 | |||||
| 2025-08-18 | 13F | Geneos Wealth Management Inc. | 8 849 | 4,60 | 126 | 11,50 | ||||
| 2025-08-14 | 13F | Bank Of America Corp /de/ | 2 404 | −75,26 | 34 | −73,64 | ||||
| 2025-08-14 | 13F | Van Eck Associates Corp | 836 641 | 3,49 | 12 | 10,00 | ||||
| 2025-08-21 | NP | BIZD - VanEck Vectors BDC Income ETF | 834 567 | 2,85 | 11 909 | 9,86 | ||||
| 2025-08-14 | 13F | Two Sigma Advisers, Lp | 0 | −100,00 | 0 | |||||
| 2025-08-14 | 13F | Hrt Financial Lp | 57 501 | 260,39 | 1 | |||||
| 2025-07-22 | 13F | DAVENPORT & Co LLC | 135 262 | −12,47 | 1 930 | −6,54 | ||||
| 2025-07-28 | 13F | Harbour Investments, Inc. | 10 | 0,00 | 0 | |||||
| 2025-08-14 | 13F | UBS Group AG | 255 656 | 15,63 | 3 648 | 23,54 | ||||
| 2025-08-12 | 13F | MAI Capital Management | 871 | 56,37 | 12 | 71,43 | ||||
| 2025-07-29 | 13F | Albert D Mason Inc | 48 056 | −6,22 | 686 | 0,15 | ||||
| 2025-08-06 | 13F | Commonwealth Equity Services, Llc | 36 633 | 5,84 | 1 | |||||
| 2025-06-27 | NP | LBO - WHITEWOLF Publicly Listed Private Equity ETF | 2 456 | 14,23 | 34 | 13,79 | ||||
| 2025-07-22 | 13F | Coastal Investment Advisors, Inc. | 42 227 | 322,27 | 603 | 352,63 | ||||
| 2025-08-06 | 13F | First Horizon Advisors, Inc. | 2 259 | 32 | ||||||
| 2025-07-17 | 13F | Sound Income Strategies, LLC | 0 | −100,00 | 0 | |||||
| 2025-08-15 | 13F | Equitable Holdings, Inc. | 10 602 | 5,22 | 151 | 12,69 | ||||
| 2025-07-28 | 13F | Melia Wealth LLC | 1 133 030 | 4,06 | 16 168 | 11,15 | ||||
| 2025-07-08 | 13F | Parallel Advisors, LLC | 263 | −27,95 | 4 | −25,00 | ||||
| 2025-08-06 | 13F | Outfitter Financial LLC | 202 295 | 0,57 | 2 887 | 7,41 | ||||
| 2025-07-15 | 13F | North Star Investment Management Corp. | 5 000 | 0,00 | 71 | 7,58 | ||||
| 2025-08-12 | 13F | BlackRock, Inc. | 251 201 | 25,60 | 3 585 | 34,18 | ||||
| 2025-08-11 | 13F | United Capital Financial Advisers, Llc | 13 500 | 12,50 | 193 | 20,00 | ||||
| 2025-08-12 | 13F | Cornerstone Wealth Management, LLC | 10 479 | −11,41 | 150 | −5,70 | ||||
| 2025-08-14 | 13F | D. E. Shaw & Co., Inc. | 0 | −100,00 | 0 | |||||
| 2025-08-14 | 13F | Millennium Management Llc | 169 197 | 118,53 | 2 414 | 133,46 | ||||
| 2025-08-05 | 13F | Simplex Trading, Llc | 0 | −100,00 | 0 | |||||
| 2025-08-13 | 13F | Baird Financial Group, Inc. | 90 800 | −0,70 | 1 296 | 6,06 | ||||
| 2025-08-15 | 13F | Morgan Stanley | 286 395 | 11,79 | 4 087 | 19,40 | ||||
| 2025-07-16 | 13F | Signaturefd, Llc | 1 322 | 32,33 | 19 | 38,46 | ||||
| 2025-08-14 | 13F | Royal Bank Of Canada | 77 867 | 2,95 | 1 112 | 10,10 | ||||
| 2025-07-24 | 13F | Blair William & Co/il | 169 571 | 0,67 | 2 420 | 7,51 | ||||
| 2025-04-17 | 13F | Janney Montgomery Scott LLC | 0 | −100,00 | 0 | |||||
| 2025-08-13 | 13F | Garner Asset Management Corp | 36 805 | −2,38 | 525 | 4,37 | ||||
| 2025-08-04 | 13F | Roble, Belko & Company, Inc | 93 | 1,09 | 0 | |||||
| 2025-08-08 | 13F | Cetera Investment Advisers | 30 681 | 1,47 | 438 | 8,44 | ||||
| 2025-08-13 | 13F | EverSource Wealth Advisors, LLC | 1 200 | 0,00 | 17 | 6,25 | ||||
| 2025-08-07 | 13F | PFG Advisors | 100 404 | 0,00 | 1 433 | 6,79 | ||||
| 2025-08-14 | 13F | Jane Street Group, Llc | 14 193 | −37,14 | 203 | −32,89 | ||||
| 2025-08-12 | 13F | Advisors Asset Management, Inc. | 114 865 | −0,51 | 1 639 | 6,29 | ||||
| 2025-08-14 | 13F | Raymond James Financial Inc | 40 857 | 2,03 | 583 | 9,18 | ||||
| 2025-08-13 | 13F | Northwestern Mutual Wealth Management Co | 0 | −100,00 | 0 | |||||
| 2025-08-14 | 13F | Bnp Paribas Arbitrage, Sa | 0 | −100,00 | 0 | |||||
| 2025-08-07 | 13F | Allworth Financial LP | 5 030 | 38 592,31 | 72 | |||||
| 2025-07-11 | 13F | Kingstone Capital Partners Texas, LLC | 1 759 421 | 24 | ||||||
| 2025-08-14 | 13F | Aquatic Capital Management LLC | 0 | −100,00 | 0 | |||||
| 2025-08-14 | 13F | Comerica Bank | 950 | 14 | ||||||
| 2025-08-15 | 13F | Tower Research Capital LLC (TRC) | 971 | −75,46 | 14 | −75,47 | ||||
| 2025-08-19 | 13F | State of Wyoming | 12 033 | 204,32 | 172 | 228,85 | ||||
| 2025-08-01 | 13F | Envestnet Asset Management Inc | 16 794 | 0,27 | 240 | 7,17 | ||||
| 2025-07-11 | 13F | Farther Finance Advisors, LLC | 5 364 | 1,55 | 77 | 7,04 | ||||
| 2025-08-12 | 13F | LPL Financial LLC | 188 193 | 0,82 | 2 686 | 7,70 | ||||
| 2025-08-08 | 13F | Foundations Investment Advisors, LLC | 15 410 | 220 | ||||||
| 2025-08-27 | NP | Mason Capital Fund Trust - Fundamentals First ETF | 1 864 | 0,00 | 27 | 8,33 | ||||
| 2025-07-17 | 13F | Oakworth Capital, Inc. | 100 | 1 | ||||||
| 2025-08-13 | 13F | Quantbot Technologies LP | 7 392 | 105 | ||||||
| 2025-04-01 | NP | PSP - Invesco Global Listed Private Equity ETF This fund is a listed as child fund of Invesco Ltd. and if that institution has disclosed ownership in this security, then these positions will not be double counted when calculating total shares and total value | 108 956 | 162,65 | 1 472 | 153,18 | ||||
| 2025-08-04 | 13F | Creative Financial Designs Inc /adv | 600 | 0,00 | 9 | 0,00 | ||||
| 2025-08-14 | 13F | Fmr Llc | 0 | −100,00 | 0 | |||||
| 2025-04-25 | 13F | JNBA Financial Advisors | 0 | −100,00 | 0 | −100,00 | ||||
| 2025-07-10 | 13F | Exchange Traded Concepts, Llc | 1 901 | 27 | ||||||
| 2025-07-21 | 13F | Ameriflex Group, Inc. | 0 | −100,00 | 0 | |||||
| 2025-08-12 | 13F | Steward Partners Investment Advisory, Llc | 3 600 | 0,00 | 51 | 6,25 | ||||
| 2025-08-13 | 13F | Transce3nd, LLC | 35 | 288,89 | 0 | |||||
| 2025-08-14 | 13F | GWM Advisors LLC | 19 626 | 0,00 | 280 | 6,87 | ||||
| 2025-08-14 | 13F | Group One Trading, L.p. | Call | 400 | 6 | |||||
| 2025-08-15 | 13F | Great West Life Assurance Co /can/ | 37 238 | 6,09 | 1 | |||||
| 2025-05-14 | 13F | Virtus ETF Advisers LLC | 0 | −100,00 | 0 | |||||
| 2025-08-05 | 13F | Simplex Trading, Llc | Put | 10 500 | −12,50 | 0 | ||||
| 2025-08-05 | 13F | Simplex Trading, Llc | Call | 2 300 | 109,09 | 0 | ||||
| 2025-08-13 | 13F | Quadrant Capital Group Llc | 0 | −100,00 | 0 | |||||
| 2025-08-13 | 13F | Virtus Investment Advisers, Inc. | 53 768 | −38,03 | 767 | −33,82 | ||||
| 2025-09-04 | 13F/A | Advisor Group Holdings, Inc. | 24 828 | −5,97 | 354 | 0,57 | ||||
| 2025-08-14 | 13F | Federation des caisses Desjardins du Quebec | 0 | −100,00 | 0 | |||||
| 2025-07-21 | 13F | Pflug Koory, LLC | 675 | 0,00 | 10 | 0,00 | ||||
| 2025-04-25 | 13F | Morton Brown Family Wealth, LLC | 0 | −100,00 | 0 | |||||
| 2025-08-14 | 13F | Wells Fargo & Company/mn | 12 107 | −7,62 | 173 | −1,71 | ||||
| 2025-08-05 | 13F | Cassaday & Co Wealth Management LLC | 112 500 | 0,00 | 1 605 | 6,79 | ||||
| 2025-08-14 | 13F | Quarry LP | 1 | 0 | ||||||
| 2025-08-13 | 13F | Jones Financial Companies Lllp | 1 291 | 0,00 | 18 | 5,88 | ||||
| 2025-08-13 | 13F | Legacy Capital Wealth Partners, LLC | 102 257 | −3,61 | 1 459 | 2,96 | ||||
| 2025-07-28 | 13F | BRYN MAWR TRUST Co | 884 | 0,00 | 13 | 9,09 | ||||
| 2025-08-11 | 13F | Citigroup Inc | 1 | −99,96 | 0 | −100,00 | ||||
| 2025-06-25 | NP | VPC - Virtus Private Credit Strategy ETF | 79 260 | 5,63 | 1 090 | 7,50 | ||||
| 2025-08-25 | NP | TMVAX - RBC Microcap Value Fund A Shares | 10 200 | 0,00 | 146 | 6,62 | ||||
| 2025-08-13 | 13F | Northern Trust Corp | 24 854 | 101,13 | 355 | 114,55 | ||||
| 2025-07-18 | 13F | Union Bancaire Privee, UBP SA | 19 806 | 5,09 | 40 356 | 15 977,69 | ||||
| 2025-08-12 | 13F | Legal & General Group Plc | 242 600 | 0,00 | 3 462 | 6,72 | ||||
| 2025-08-08 | 13F | Larson Financial Group LLC | 224 | 1,82 | 3 | 50,00 | ||||
| 2025-04-23 | 13F | Spire Wealth Management | 0 | −100,00 | 0 | |||||
| 2025-07-30 | 13F | Mid-American Wealth Advisory Group, Inc. | 401 | 6 | ||||||
| 2025-08-13 | 13F | Marshall Wace, Llp | 29 972 | 428 | ||||||
| 2025-08-14 | 13F | Citadel Advisors Llc | Call | 77 100 | 30,24 | 1 100 | 39,24 |
Other Listings
| GB:0IVR |