Grundläggande statistik
| Institutionella ägare | 160 total, 160 long only, 0 short only, 0 long/short - change of 13,48% MRQ |
| Genomsnittlig portföljallokering | 0.5886 % - change of 14,58% MRQ |
| Institutionella aktier (lång) | 20 596 679 (ex 13D/G) - change of 3,68MM shares 21,72% MRQ |
| Institutionellt värde (lång) | $ 793 188 USD ($1000) |
Institutionellt ägande och aktieägare
EA Series Trust - Freedom 100 Emerging Markets ETF (US:FRDM) har 160 Institutionella ägare och aktieägare som har lämnat in 13D/G- eller 13F-formulär till Securities Exchange Commission (SEC). Dessa institut innehar totalt 20,596,679 aktier. Största aktieägare inkluderar Retirement Planning Group, Northwestern Mutual Wealth Management Co, Wells Fargo & Company/mn, Ellevest, Inc., Tanglewood Wealth Management, Inc., Willis Johnson & Associates, Inc., Aptus Capital Advisors, LLC, Guardian Wealth Advisors, Llc / Nc, Coyle Financial Counsel LLC, and Kathmere Capital Management, LLC .
EA Series Trust - Freedom 100 Emerging Markets ETF (BATS:FRDM) Institutionell ägarstruktur visar institutioners och fonders nuvarande positioner i företaget, samt de senaste förändringarna i positionernas storlek. Större aktieägare kan vara enskilda investerare, fonder, hedgefonder eller institutioner. Bilaga 13D visar att investeraren äger (eller ägde) mer än 5% av företaget och avser (eller avsåg) att aktivt eftersträva en förändring av affärsstrategin. Schedule 13G indikerar en passiv investering på över 5%.
The share price as of September 8, 2025 is 42,66 / share. Previously, on September 9, 2024, the share price was 34,22 / share. This represents an increase of 24,66% over that period.

Fondsentimentets poäng
Fondsentimentet poängen(fka Ägarackumulation-poäng) visar vilka aktier som är mest köpta av fonder. Det är resultatet av en sofistikerad kvantitativ flerfaktormodell som identifierar företag med de högsta nivåerna av institutionell ackumulering. Poängsättningsmodellen använder en kombination av den totala ökningen av redovisade ägare, förändringarna i portföljallokeringarna för dessa ägare och andra mått. Siffran sträcker sig från 0 till 100, där högre siffror indikerar en högre nivå av ackumulering i förhållande till sina konkurrenter, och 50 är genomsnittet.
Uppdateringsfrekvens: Dagligen
Se Ownership Explorer, som innehåller en lista över de högst rankade företagen.
Institutionell sälj/köp-kvot
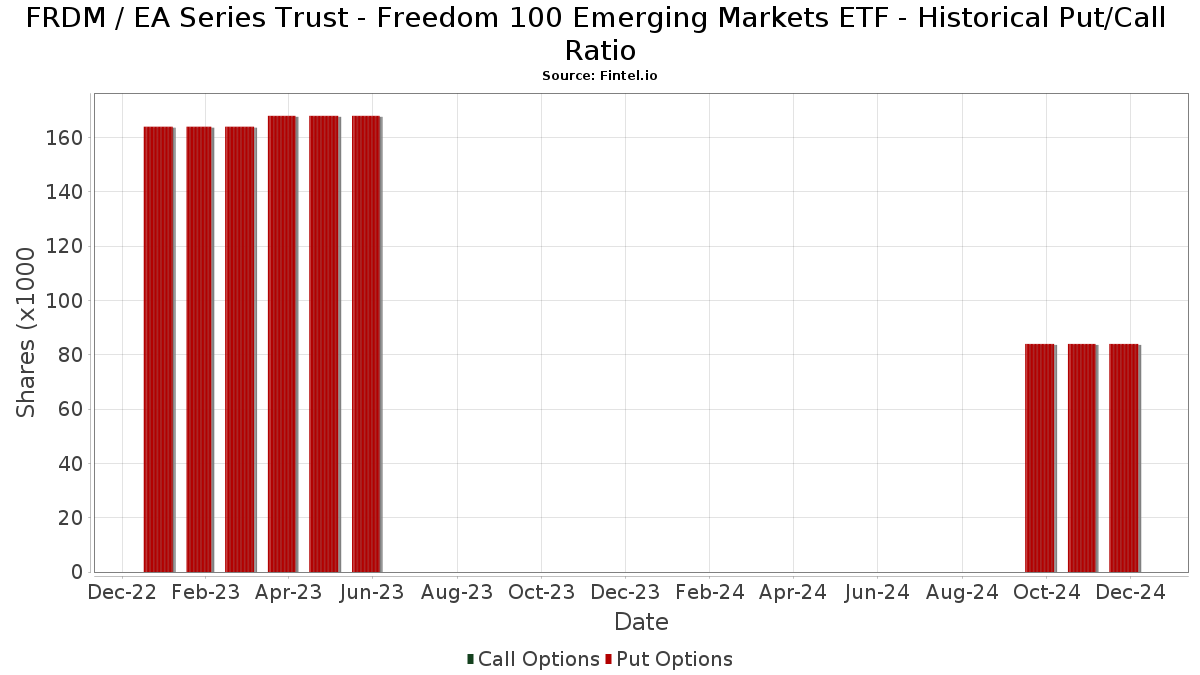
Förutom att rapportera vanliga eget kapital- och skuldemissioner måste institutioner med mer än 100MM tillgångar under förvaltning också avslöja sina innehav av sälj- och köpoptioner. Eftersom säljoptioner i allmänhet indikerar ett negativt sentiment och köpoptioner indikerar ett positivt sentiment, kan vi få en uppfattning om det övergripande institutionella sentimentet genom att plotta förhållandet mellan säljoptioner och köpoptioner. Diagrammet till höger visar det historiska förhållandet mellan sälj- och köpoptioner för detta instrument.
Genom att använda sälj/köp-kvoten som en indikator på aktieägarnas sentiment undviker man en av de största bristerna med att använda det totala institutionella ägandet, nämligen att en betydande del av de förvaltade tillgångarna investeras passivt för att följa index. Passivt förvaltade fonder köper vanligtvis inte optioner, så indikatorn för sälj/köp-kvoten ger en bättre bild av stämningen i aktivt förvaltade fonder.
13F- och NPORT-arkiveringar
Detaljer om 13F-arkiveringar är gratis. Detaljer om NP-arkiveringar kräver ett premiummedlemskap. Gröna rader indikerar nya positioner. Röda rader indikerar stängda positioner. Klicka på länk symbolen för att se hela transaktionshistoriken.
Uppgradera
för att låsa upp premiumdata och exportera till Excel ![]() .
.
| Fil Datum | Källa | Investerare | Typ | Genomsnittligt pris (beräknat) |
Aktier | Δ Aktier (%) |
Rapporterat värde (1000 USD) |
Δ Värde (%) |
Portföljallokering (%) |
|
|---|---|---|---|---|---|---|---|---|---|---|
| 2025-07-23 | 13F | Lansing Street Advisors | 37 230 | 25,76 | 1 504 | 45,03 | ||||
| 2025-08-06 | 13F | Ethos Financial Group, LLC | 51 537 | 74,11 | 2 082 | 115,31 | ||||
| 2025-08-13 | 13F | Millstone Evans Group, LLC | 634 | 0,32 | 26 | 13,64 | ||||
| 2025-08-13 | 13F | WCG Wealth Advisors LLC | 174 390 | −21,80 | 7 045 | −9,88 | ||||
| 2025-08-14 | 13F | Susquehanna International Group, Llp | 30 620 | 1 237 | ||||||
| 2025-08-07 | 13F | Mayport, Llc | 265 391 | 6,57 | 10 722 | 22,83 | ||||
| 2025-08-08 | 13F | Smithfield Trust Co | 1 328 | 0,00 | 0 | |||||
| 2025-07-25 | 13F | Commonwealth Financial Services, LLC | 259 753 | 0,84 | 10 494 | 16,24 | ||||
| 2025-07-30 | 13F | Brookstone Capital Management | 5 164 | −46,29 | 209 | −38,28 | ||||
| 2025-08-14 | 13F | Financial Network Wealth Advisors LLC | 2 119 | −32,06 | 86 | −22,02 | ||||
| 2025-07-24 | 13F | Us Bancorp \de\ | 3 858 | 21,59 | 156 | 39,64 | ||||
| 2025-08-14 | 13F | Raymond James Financial Inc | 454 117 | 16,51 | 18 346 | 34,29 | ||||
| 2025-08-07 | 13F | Sierra Ocean, Llc | 1 600 | 65 | ||||||
| 2025-07-17 | 13F | XY Planning Network, Inc. | 8 801 | 356 | ||||||
| 2025-08-13 | 13F | Jones Financial Companies Lllp | 25 396 | 157,30 | 1 019 | 194,51 | ||||
| 2025-04-25 | 13F | Smallwood Wealth Investment Management, LLC | 113 884 | 3,65 | 3 992 | 11,17 | ||||
| 2025-07-11 | 13F | Farther Finance Advisors, LLC | 236 | 293,33 | 10 | 350,00 | ||||
| 2025-08-14 | 13F | Guardian Wealth Advisors, Llc / Nc | 622 371 | 83,09 | 25 144 | 110,63 | ||||
| 2025-07-16 | 13F | Beaumont Financial Advisors, LLC | 220 075 | 14,20 | 8 891 | 31,64 | ||||
| 2025-08-14 | 13F | Mercer Global Advisors Inc /adv | 12 109 | −41,94 | 489 | −33,11 | ||||
| 2025-07-10 | 13F | Signal Advisors Wealth, LLC | 85 799 | 57,61 | 3 466 | 81,66 | ||||
| 2025-07-08 | 13F | Parallel Advisors, LLC | 5 317 | 0,00 | 215 | 15,05 | ||||
| 2025-08-12 | 13F | O'shaughnessy Asset Management, Llc | 935 | 3,89 | 38 | 19,35 | ||||
| 2025-03-12 | 13F/A | Private Capital Management Llc | 12 295 | 434 | ||||||
| 2025-08-11 | 13F | Citigroup Inc | 7 971 | 322 | ||||||
| 2025-07-10 | 13F | Redhawk Wealth Advisors, Inc. | 8 046 | 4,47 | 325 | 20,82 | ||||
| 2025-08-08 | 13F | Foundations Investment Advisors, LLC | 87 706 | 11,90 | 3 543 | 28,98 | ||||
| 2025-05-15 | 13F | Gts Securities Llc | 0 | −100,00 | 0 | |||||
| 2025-07-28 | 13F | Harbour Investments, Inc. | 1 920 | 1,64 | 78 | 16,67 | ||||
| 2025-08-14 | 13F | Fmr Llc | 1 304 | −22,79 | 53 | −11,86 | ||||
| 2025-07-29 | 13F | Angeles Wealth Management, Llc | 30 072 | 1 215 | ||||||
| 2025-08-07 | 13F | 1620 Investment Advisors, Inc. | 62 574 | 4,01 | 2 528 | 19,88 | ||||
| 2025-08-14 | 13F | UBS Group AG | 813 | 33 | ||||||
| 2025-08-08 | 13F | Larson Financial Group LLC | 86 | −86,11 | 3 | −85,71 | ||||
| 2025-07-17 | 13F | Sound Income Strategies, LLC | 1 | 0 | ||||||
| 2025-07-21 | 13F | Tanglewood Wealth Management, Inc. | 1 107 772 | 48,58 | 44 754 | 71,24 | ||||
| 2025-07-30 | 13F | Strategic Blueprint, LLC | 0 | −100,00 | 0 | |||||
| 2025-07-23 | 13F | Quarry Hill Advisors, Llc | 134 479 | −1,85 | 5 433 | 13,12 | ||||
| 2025-08-06 | 13F | Prospera Financial Services Inc | 24 986 | 1 009 | ||||||
| 2025-08-07 | 13F | Resources Investment Advisors, LLC. | 160 176 | −0,73 | 6 471 | 14,43 | ||||
| 2025-08-14 | 13F | Bank Of America Corp /de/ | 12 431 | −6,56 | 502 | 7,73 | ||||
| 2025-08-13 | 13F | Willis Johnson & Associates, Inc. | 982 672 | 4,38 | 39 700 | 20,31 | ||||
| 2025-08-14 | 13F | Great Valley Advisor Group, Inc. | 178 208 | −1,74 | 7 200 | 13,25 | ||||
| 2025-08-12 | 13F | Frontier Asset Management, LLC | 7 294 | −90,97 | 295 | −89,61 | ||||
| 2025-08-13 | 13F | Baird Financial Group, Inc. | 7 940 | 321 | ||||||
| 2025-08-15 | 13F | Koesten, Hirschmann & Crabtree, INC. | 19 | 0,00 | 1 | |||||
| 2025-07-23 | 13F | Heck Capital Advisors, LLC | 249 563 | 0,22 | 10 082 | 15,51 | ||||
| 2025-08-12 | 13F | Jpmorgan Chase & Co | 184 | 0,00 | 7 | 16,67 | ||||
| 2025-08-06 | 13F | SOUTH STATE Corp | 25 440 | −15,02 | 1 028 | −2,10 | ||||
| 2025-07-11 | 13F | William Howard & Co Financial Advisors Inc | 16 137 | 0,70 | 652 | 16,04 | ||||
| 2025-08-14 | 13F | Jane Street Group, Llc | 46 326 | 1 872 | ||||||
| 2025-07-24 | 13F | IFP Advisors, Inc | 24 877 | 827,55 | 1 005 | 969,15 | ||||
| 2025-08-14 | 13F | Integrated Wealth Concepts LLC | 250 227 | 461,77 | 10 109 | 547,60 | ||||
| 2025-07-22 | 13F | Yardley Wealth Management LLC | 360 025 | −1,64 | 15 | 16,67 | ||||
| 2025-08-13 | 13F | EverSource Wealth Advisors, LLC | 30 | 0,00 | 1 | 0,00 | ||||
| 2025-07-08 | 13F | Prism Advisors, Inc. | 28 337 | −39,00 | 1 145 | −29,73 | ||||
| 2025-04-23 | 13F | Mascagni Wealth Management, Inc. | 0 | −100,00 | 0 | −100,00 | ||||
| 2025-07-18 | 13F/A | MJT & Associates Financial Advisory Group, Inc. | 685 | 28 | ||||||
| 2025-08-12 | 13F | Tableaux Llc | 15 000 | −86,72 | 15 | −99,62 | ||||
| 2025-08-13 | 13F | Northwestern Mutual Wealth Management Co | 1 438 388 | 12,01 | 58 111 | 29,10 | ||||
| 2025-08-19 | 13F | Advisory Services Network, LLC | 47 054 | 21,55 | 1 896 | 39,75 | ||||
| 2025-08-05 | 13F | Lord & Richards Wealth Management, LLC | 21 950 | 146,68 | 887 | 184,89 | ||||
| 2025-08-15 | 13F | Kestra Advisory Services, LLC | 362 962 | −0,75 | 14 664 | 14,39 | ||||
| 2025-08-15 | 13F | Morgan Stanley | 139 220 | −29,31 | 5 624 | −18,53 | ||||
| 2025-07-25 | 13F | Cwm, Llc | 31 665 | −27,02 | 1 | 0,00 | ||||
| 2025-07-23 | 13F | High Note Wealth, LLC | 178 666 | 186,57 | 7 218 | 230,34 | ||||
| 2025-07-11 | 13F/A | Umb Bank N A/mo | 200 | 0,00 | 8 | 14,29 | ||||
| 2025-05-15 | 13F | Bank Of America Corp /de/ | Put | 0 | −100,00 | 0 | −100,00 | |||
| 2025-08-11 | 13F | TD Waterhouse Canada Inc. | 1 632 | 0,00 | 66 | 14,04 | ||||
| 2025-07-21 | 13F | Investment Planning Advisors, Inc. | 416 007 | 107,51 | 16 807 | 139,16 | ||||
| 2025-05-13 | 13F/A | Magnolia Capital Advisors Llc | 26 757 | 3,61 | 874 | −4,17 | ||||
| 2025-08-12 | 13F | CIBC Private Wealth Group, LLC | 193 | 0,00 | 8 | 40,00 | ||||
| 2025-07-16 | 13F | Magnus Financial Group LLC | 32 105 | −0,12 | 1 297 | 15,19 | ||||
| 2025-07-28 | 13F | Mutual Advisors, LLC | 25 267 | 4,53 | 1 031 | 18,53 | ||||
| 2025-07-03 | 13F | TrueWealth Advisors, LLC | 128 729 | −4,52 | 5 201 | 10,03 | ||||
| 2025-08-14 | 13F | Mariner, LLC | 163 305 | −10,48 | 6 598 | 3,17 | ||||
| 2025-08-14 | 13F | Wells Fargo & Company/mn | 1 264 419 | 228,60 | 51 083 | 278,75 | ||||
| 2025-07-31 | 13F | Trademark Financial Management, LLC | 72 304 | 270,13 | 2 921 | 327,05 | ||||
| 2025-08-08 | 13F | Islay Capital Management, Llc | 71 613 | 4,53 | 2 893 | 20,49 | ||||
| 2025-08-13 | 13F | Colonial Trust Co / SC | 3 000 | 0,00 | 121 | 15,24 | ||||
| 2025-08-13 | 13F | Level Four Advisory Services, Llc | 23 568 | 0,58 | 952 | 15,96 | ||||
| 2025-08-14 | 13F | Comerica Bank | 2 401 | 0,00 | 97 | 15,48 | ||||
| 2025-07-21 | 13F | Ameritas Advisory Services, LLC | 2 133 | 86 | ||||||
| 2025-08-11 | 13F | HighTower Advisors, LLC | 396 795 | 8,89 | 16 030 | 25,50 | ||||
| 2025-07-15 | 13F | Mather Group, Llc. | 21 469 | 0,00 | 867 | 15,29 | ||||
| 2025-07-28 | 13F | Lunt Capital Management, Inc. | 62 234 | 0,81 | 2 514 | 16,23 | ||||
| 2025-08-06 | 13F | Savant Capital, LLC | 10 248 | 414 | ||||||
| 2025-08-14 | 13F | L2 Asset Management, LLC | 8 816 | 356 | ||||||
| 2025-07-17 | 13F | Janney Montgomery Scott LLC | 270 737 | 1,50 | 11 | 11,11 | ||||
| 2025-07-23 | 13F | Clear Creek Financial Management, LLC | 59 183 | −2,31 | 2 391 | 11,73 | ||||
| 2025-07-17 | 13F | HB Wealth Management, LLC | 5 300 | 214 | ||||||
| 2025-08-08 | 13F | Bailard, Inc. | 5 200 | 210 | ||||||
| 2025-08-26 | 13F/A | Thrivent Financial For Lutherans | 72 481 | −87,76 | 3 | −90,00 | ||||
| 2025-08-27 | 13F/A | Brinker Capital Investments, LLC | 55 000 | 0,00 | 2 222 | 15,31 | ||||
| 2025-05-15 | 13F/A | Orion Portfolio Solutions, LLC | 55 000 | 0,00 | 1 928 | 7,23 | ||||
| 2025-07-23 | 13F | L.K. Benson & Company, P.C. | 14 206 | 17,03 | 574 | 34,82 | ||||
| 2025-05-02 | 13F | Transcendent Capital Group LLC | 0 | −100,00 | 0 | |||||
| 2025-08-15 | 13F | Global View Capital Management LLC | 20 857 | −10,17 | 843 | 3,57 | ||||
| 2025-07-11 | 13F | SILVER OAK SECURITIES, Inc | 24 654 | 0,94 | 996 | 16,08 | ||||
| 2025-08-14 | 13F | CoreCap Advisors, LLC | 450 | 18 | ||||||
| 2025-08-14 | 13F | Coyle Financial Counsel LLC | 523 087 | 5,48 | 21 133 | 21,57 | ||||
| 2025-05-12 | 13F | Independent Advisor Alliance | 0 | −100,00 | 0 | |||||
| 2025-07-29 | 13F | Financial Guidance Group, Inc. | 31 969 | 1 292 | ||||||
| 2025-07-31 | 13F | Longview Financial Advisors, Inc. | 40 180 | 13,59 | 1 623 | 30,99 | ||||
| 2025-07-16 | 13F | Kathmere Capital Management, LLC | 519 600 | 0,78 | 20 992 | 16,15 | ||||
| 2025-07-25 | 13F | Pandora Wealth, Inc. | 45 188 | 0,65 | 1 826 | 16,02 | ||||
| 2025-08-12 | 13F | Proequities, Inc. | 0 | 0 | ||||||
| 2025-08-14 | 13F | Marshall Investment Management, Llc | 0 | −100,00 | 0 | |||||
| 2025-08-15 | 13F | Captrust Financial Advisors | 20 746 | 37,98 | 838 | 59,01 | ||||
| 2025-07-15 | 13F | Fifth Third Bancorp | 0 | −100,00 | 0 | |||||
| 2025-08-05 | 13F | Bank of New York Mellon Corp | 7 427 | 15,52 | 300 | 33,33 | ||||
| 2025-08-12 | 13F | Maripau Wealth Management Llc | 44 870 | 47,80 | 1 826 | 71,52 | ||||
| 2025-08-14 | 13F | Mml Investors Services, Llc | 55 313 | 275,44 | 2 | |||||
| 2025-08-18 | 13F/A | National Bank Of Canada /fi/ | 4 992 | 5,45 | 202 | 21,82 | ||||
| 2025-07-25 | 13F | Envestnet Portfolio Solutions, Inc. | 0 | −100,00 | 0 | |||||
| 2025-08-08 | 13F | Avantax Advisory Services, Inc. | 10 432 | 18,05 | 421 | 36,25 | ||||
| 2025-08-11 | 13F | Principal Securities, Inc. | 11 689 | 1 111,30 | 472 | 1 422,58 | ||||
| 2025-08-14 | 13F | Colony Group, LLC | 60 967 | −14,77 | 2 463 | −1,79 | ||||
| 2025-07-17 | 13F | Beacon Capital Management, LLC | 48 | 2,13 | 2 | 0,00 | ||||
| 2025-07-29 | 13F | Koshinski Asset Management, Inc. | 5 432 | 219 | ||||||
| 2025-05-06 | 13F | Venturi Wealth Management, LLC | 0 | −100,00 | 0 | |||||
| 2025-07-11 | 13F | Skyline Advisors, Inc. | 8 717 | 0,68 | 352 | 16,17 | ||||
| 2025-07-17 | 13F | Smith Anglin Financial, LLC | 11 844 | −5,87 | 478 | 8,39 | ||||
| 2025-08-13 | 13F | Townsquare Capital Llc | 0 | −100,00 | 0 | |||||
| 2025-08-07 | 13F | Tfo-tdc, Llc | 10 000 | 404 | ||||||
| 2025-08-07 | 13F | New England Private Wealth Advisors LLC | 113 580 | 1,62 | 4 597 | 17,33 | ||||
| 2025-08-08 | 13F | Creative Planning | 13 532 | 28,10 | 547 | 47,57 | ||||
| 2025-07-31 | 13F | Stegent Equity Advisors, Inc. | 11 763 | 0,00 | 475 | 15,29 | ||||
| 2025-04-21 | 13F | Nelson, Van Denburg & Campbell Wealth Management Group, LLC | 0 | −100,00 | 0 | |||||
| 2025-07-14 | 13F | AdvisorNet Financial, Inc | 1 441 | −66,57 | 58 | −61,59 | ||||
| 2025-08-06 | 13F | Stokes Family Office, LLC | 226 851 | −0,38 | 9 165 | 14,81 | ||||
| 2025-08-13 | 13F | Northern Trust Corp | 5 161 | 209 | ||||||
| 2025-05-14 | 13F | Flow Traders U.s. Llc | 0 | −100,00 | 0 | |||||
| 2025-08-13 | 13F | New Harbor Financial Group, LLC | 5 589 | −4,61 | 226 | 9,76 | ||||
| 2025-08-12 | 13F | Watchman Group, Inc. | 190 367 | −0,70 | 7 691 | 14,45 | ||||
| 2025-07-09 | 13F | Dynamic Advisor Solutions LLC | 10 109 | −3,03 | 408 | 11,78 | ||||
| 2025-08-19 | 13F | Anchor Investment Management, LLC | 5 010 | −8,98 | 202 | 5,21 | ||||
| 2025-09-04 | 13F/A | Advisor Group Holdings, Inc. | 22 443 | −37,71 | 907 | −28,32 | ||||
| 2025-04-16 | 13F | Fortitude Family Office, LLC | 0 | −100,00 | 0 | |||||
| 2025-04-10 | 13F | Clarus Wealth Advisors | 0 | −100,00 | 0 | |||||
| 2025-08-11 | 13F | Rothschild Investment Llc | 0 | −100,00 | 0 | |||||
| 2025-07-31 | 13F | Cambridge Investment Research Advisors, Inc. | 23 269 | 29,61 | 1 | |||||
| 2025-07-24 | 13F | Capital Advisors, Ltd. LLC | 8 583 | 21,31 | 0 | |||||
| 2025-08-06 | 13F | Commonwealth Equity Services, Llc | 72 132 | 5,36 | 3 | 0,00 | ||||
| 2025-08-14 | 13F | IHT Wealth Management, LLC | 7 729 | −3,04 | 312 | 11,83 | ||||
| 2025-04-28 | 13F | Strategic Financial Concepts, LLC | 0 | −100,00 | 0 | −100,00 | ||||
| 2025-08-14 | 13F | GWM Advisors LLC | 28 306 | 3,23 | 1 144 | 18,94 | ||||
| 2025-08-12 | 13F | Allen Capital Group, LLC | 33 656 | 9,53 | 1 360 | 26,18 | ||||
| 2025-08-18 | 13F | Geneos Wealth Management Inc. | 89 981 | 402,43 | 3 635 | 479,74 | ||||
| 2025-08-01 | 13F | Rossby Financial, LCC | 196 276 | 1,86 | 7 930 | 14,43 | ||||
| 2025-08-13 | 13F | Lumbard & Kellner, LLC | 154 307 | 97,17 | 6 234 | 127,27 | ||||
| 2025-08-01 | 13F | Envestnet Asset Management Inc | 356 976 | 527,54 | 14 422 | 623,58 | ||||
| 2025-08-05 | 13F | Ellevest, Inc. | 1 140 983 | 458,64 | 46 096 | 543,96 | ||||
| 2025-07-30 | 13F | Mills Wealth Advisors LLC | 5 280 | 213 | ||||||
| 2025-07-25 | 13F | We Are One Seven, LLC | 10 611 | −3,01 | 429 | 11,75 | ||||
| 2025-08-08 | 13F | Cetera Investment Advisers | 11 387 | −11,69 | 460 | 2,00 | ||||
| 2025-08-19 | 13F | Asset Dedication, LLC | 1 121 | 0,00 | 45 | 15,38 | ||||
| 2025-06-27 | NP | GIAX - Nicholas Global Equity and Income ETF | 57 776 | 22,11 | 2 089 | 29,69 | ||||
| 2025-08-04 | 13F | Center for Financial Planning, Inc. | 650 | 48,40 | 26 | 73,33 | ||||
| 2025-08-14 | 13F | Toroso Investments, LLC | 60 830 | 5,29 | 2 458 | 21,33 | ||||
| 2025-08-15 | 13F | First Heartland Consultants, Inc. | 362 182 | 14 632 | ||||||
| 2025-04-30 | 13F | Bull Oak Capital, LLC | 0 | −100,00 | 0 | |||||
| 2025-05-15 | 13F | Old Mission Capital Llc | 0 | −100,00 | 0 | |||||
| 2025-08-14 | 13F | Citadel Advisors Llc | 0 | −100,00 | 0 | |||||
| 2025-08-14 | 13F | Royal Bank Of Canada | 729 | −98,73 | 29 | −98,56 | ||||
| 2025-07-09 | 13F | Intelligence Driven Advisers, LLC | 422 619 | 25,95 | 17 074 | 45,17 | ||||
| 2025-08-01 | 13F | SwitchPoint Financial Planning, LLC | 5 644 | 228 | ||||||
| 2025-07-25 | 13F | Stephens Consulting, LLC | 187 682 | 14,25 | 7 582 | 31,70 | ||||
| 2025-08-11 | 13F | Aptus Capital Advisors, LLC | 658 174 | 91,48 | 26 590 | 120,70 | ||||
| 2025-07-15 | 13F | EWG Elevate Inc. | 93 518 | 3 778 | ||||||
| 2025-08-07 | 13F | Gs Investments, Inc. | 8 055 | 0,00 | 325 | 15,25 | ||||
| 2025-08-06 | 13F | AE Wealth Management LLC | 341 | −77,67 | 14 | −75,47 | ||||
| 2025-07-16 | 13F | ORG Partners LLC | 1 000 | 0,00 | 40 | 14,29 | ||||
| 2025-08-14 | 13F | Ancora Advisors, LLC | 3 371 | 28,47 | 136 | 49,45 | ||||
| 2025-08-12 | 13F | LPL Financial LLC | 227 106 | 25,38 | 9 175 | 44,51 | ||||
| 2025-05-15 | 13F | CAPROCK Group, Inc. | 37 747 | 1 333 | ||||||
| 2025-07-30 | 13F | Retirement Planning Group | 2 386 771 | 1,20 | 96 426 | 16,64 | ||||
| 2025-08-14 | 13F | Arete Wealth Advisors, LLC | 12 874 | −5,93 | 1 | |||||
| 2025-07-18 | 13F | Warren Street Wealth Advisors, LLC | 5 828 | 0,00 | 235 | 15,20 | ||||
| 2025-08-12 | 13F | Ameritas Investment Partners, Inc. | 94 884 | 5,72 | 3 833 | 21,88 | ||||
| 2025-07-22 | 13F | Wealthcare Advisory Partners LLC | 45 526 | 88,34 | 1 839 | 117,12 |