Grundläggande statistik
| Institutionella ägare | 169 total, 169 long only, 0 short only, 0 long/short - change of 18,06% MRQ |
| Genomsnittlig portföljallokering | 0.6805 % - change of −23,13% MRQ |
| Institutionella aktier (lång) | 31 531 669 (ex 13D/G) - change of −1,61MM shares −4,85% MRQ |
| Institutionellt värde (lång) | $ 991 423 USD ($1000) |
Institutionellt ägande och aktieägare
Franklin Templeton ETF Trust - Franklin FTSE Japan ETF (US:FLJP) har 169 Institutionella ägare och aktieägare som har lämnat in 13D/G- eller 13F-formulär till Securities Exchange Commission (SEC). Dessa institut innehar totalt 31,531,669 aktier. Största aktieägare inkluderar Bank Of America Corp /de/, Morgan Stanley, LPL Financial LLC, Janus Henderson Group Plc, Clayton Street Trust - Protective Life Dynamic Allocation Series - Moderate Portfolio, Bank Of Montreal /can/, Envestnet Asset Management Inc, RiverFront Investment Group, LLC, Arvest Bank Trust Division, and Agf Management Ltd .
Franklin Templeton ETF Trust - Franklin FTSE Japan ETF (ARCA:FLJP) Institutionell ägarstruktur visar institutioners och fonders nuvarande positioner i företaget, samt de senaste förändringarna i positionernas storlek. Större aktieägare kan vara enskilda investerare, fonder, hedgefonder eller institutioner. Bilaga 13D visar att investeraren äger (eller ägde) mer än 5% av företaget och avser (eller avsåg) att aktivt eftersträva en förändring av affärsstrategin. Schedule 13G indikerar en passiv investering på över 5%.
The share price as of September 12, 2025 is 34,84 / share. Previously, on September 13, 2024, the share price was 29,74 / share. This represents an increase of 17,15% over that period.

Fondsentimentets poäng
Fondsentimentet poängen(fka Ägarackumulation-poäng) visar vilka aktier som är mest köpta av fonder. Det är resultatet av en sofistikerad kvantitativ flerfaktormodell som identifierar företag med de högsta nivåerna av institutionell ackumulering. Poängsättningsmodellen använder en kombination av den totala ökningen av redovisade ägare, förändringarna i portföljallokeringarna för dessa ägare och andra mått. Siffran sträcker sig från 0 till 100, där högre siffror indikerar en högre nivå av ackumulering i förhållande till sina konkurrenter, och 50 är genomsnittet.
Uppdateringsfrekvens: Dagligen
Se Ownership Explorer, som innehåller en lista över de högst rankade företagen.
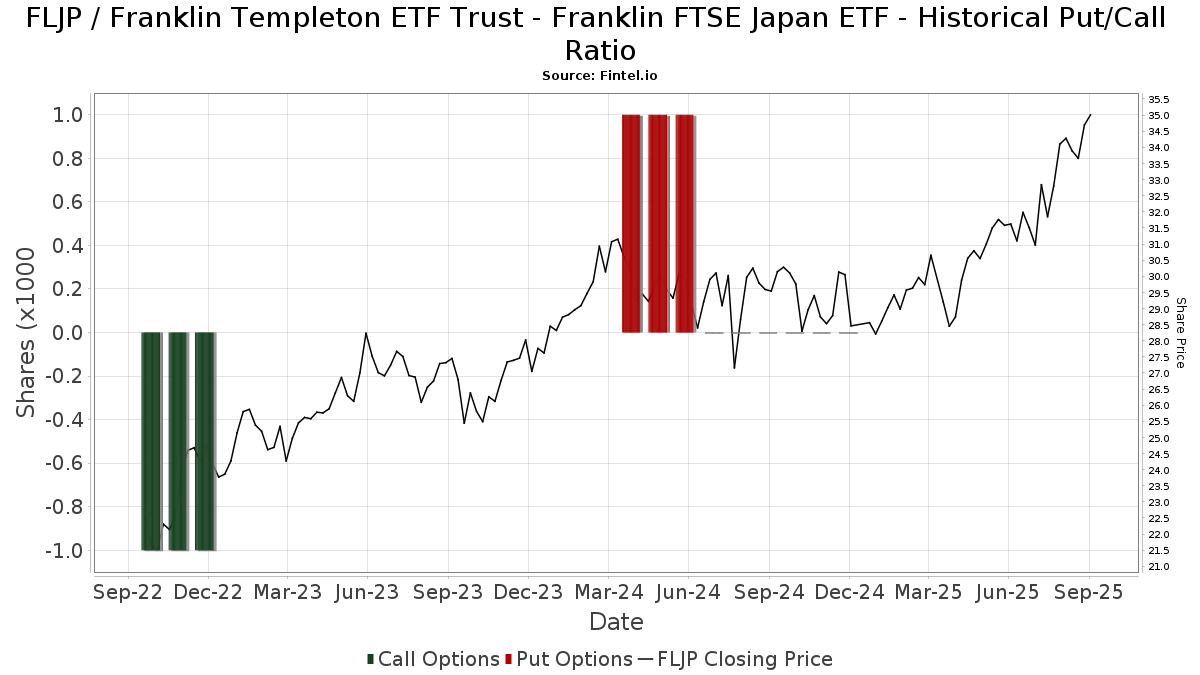
Institutionell sälj/köp-kvot
Förutom att rapportera vanliga eget kapital- och skuldemissioner måste institutioner med mer än 100MM tillgångar under förvaltning också avslöja sina innehav av sälj- och köpoptioner. Eftersom säljoptioner i allmänhet indikerar ett negativt sentiment och köpoptioner indikerar ett positivt sentiment, kan vi få en uppfattning om det övergripande institutionella sentimentet genom att plotta förhållandet mellan säljoptioner och köpoptioner. Diagrammet till höger visar det historiska förhållandet mellan sälj- och köpoptioner för detta instrument.
Genom att använda sälj/köp-kvoten som en indikator på aktieägarnas sentiment undviker man en av de största bristerna med att använda det totala institutionella ägandet, nämligen att en betydande del av de förvaltade tillgångarna investeras passivt för att följa index. Passivt förvaltade fonder köper vanligtvis inte optioner, så indikatorn för sälj/köp-kvoten ger en bättre bild av stämningen i aktivt förvaltade fonder.
13F- och NPORT-arkiveringar
Detaljer om 13F-arkiveringar är gratis. Detaljer om NP-arkiveringar kräver ett premiummedlemskap. Gröna rader indikerar nya positioner. Röda rader indikerar stängda positioner. Klicka på länk symbolen för att se hela transaktionshistoriken.
Uppgradera
för att låsa upp premiumdata och exportera till Excel ![]() .
.
| Fil Datum | Källa | Investerare | Typ | Genomsnittligt pris (beräknat) |
Aktier | Δ Aktier (%) |
Rapporterat värde (1000 USD) |
Δ Värde (%) |
Portföljallokering (%) |
|
|---|---|---|---|---|---|---|---|---|---|---|
| 2025-07-29 | 13F | Yoffe Investment Management, LLC | 11 410 | 0,00 | 367 | 9,25 | ||||
| 2025-08-14 | 13F | Mml Investors Services, Llc | 81 805 | 12,00 | 3 | 0,00 | ||||
| 2025-05-14 | 13F | Itau Unibanco Holding S.A. | 0 | −100,00 | 0 | |||||
| 2025-07-16 | 13F | Signaturefd, Llc | 60 | −58,33 | 2 | −75,00 | ||||
| 2025-08-14 | 13F | Ancora Advisors, LLC | 0 | −100,00 | 0 | |||||
| 2025-08-07 | 13F | Compass Financial Group, Inc. | 0 | −100,00 | 0 | |||||
| 2025-08-07 | 13F | Resources Investment Advisors, LLC. | 28 628 | −59,52 | 920 | −55,73 | ||||
| 2025-07-24 | 13F | Us Bancorp \de\ | 221 | −12,99 | 7 | 0,00 | ||||
| 2025-08-11 | 13F | HighTower Advisors, LLC | 52 137 | −0,22 | 1 676 | 9,11 | ||||
| 2025-08-14 | 13F | Bank Of America Corp /de/ | 11 359 669 | −0,64 | 365 213 | 8,66 | ||||
| 2025-07-24 | 13F | IFP Advisors, Inc | 9 722 | 60,85 | 313 | 76,27 | ||||
| 2025-05-14 | 13F | Visionary Wealth Advisors | 0 | −100,00 | 0 | |||||
| 2025-07-08 | 13F | Parallel Advisors, LLC | 30 | 0,00 | 1 | |||||
| 2025-08-05 | 13F | Bank Of Montreal /can/ | 662 168 | 288,04 | 21 289 | 324,40 | ||||
| 2025-07-28 | 13F | Harbour Investments, Inc. | 7 780 | 67,02 | 250 | 83,82 | ||||
| 2025-08-29 | NP | N/A - Protective Life Dynamic Allocation Series - Conservative Portfolio | 32 389 | −5,77 | 1 041 | 3,07 | ||||
| 2025-08-12 | 13F | MAI Capital Management | 500 | −7,92 | 16 | 6,67 | ||||
| 2025-05-06 | 13F | Venturi Wealth Management, LLC | 0 | −100,00 | 0 | |||||
| 2025-04-17 | 13F | Sound Income Strategies, LLC | 0 | −100,00 | 0 | |||||
| 2025-08-13 | 13F/A | StoneX Group Inc. | 200 000 | 5 420 | ||||||
| 2025-08-12 | 13F | Atlas Capital Advisors Llc | 206 781 | −6,27 | 6 648 | 2,51 | ||||
| 2025-07-10 | 13F | Wealth Enhancement Advisory Services, Llc | 25 607 | 26,92 | 820 | 38,28 | ||||
| 2025-08-05 | 13F | Huntington National Bank | 31 | 7,14 | ||||||
| 2025-08-07 | 13F | WESCAP Management Group, Inc. | 18 098 | −1,31 | 582 | 7,79 | ||||
| 2025-08-08 | 13F | Creative Planning | 10 923 | 54,76 | 351 | 69,57 | ||||
| 2025-07-24 | 13F | Ronald Blue Trust, Inc. | 194 | 0,00 | 6 | 20,00 | ||||
| 2025-08-13 | 13F | Northwestern Mutual Wealth Management Co | 2 899 | 29,07 | 93 | 40,91 | ||||
| 2025-08-11 | 13F | Madison Asset Management, LLC | 396 238 | −40,95 | 12 739 | −35,42 | ||||
| 2025-08-12 | 13F | RiverFront Investment Group, LLC | 632 962 | 3,00 | 20 350 | 12,63 | ||||
| 2025-07-23 | 13F | Spectrum Asset Management, Inc. (NB/CA) | 58 219 | 1 872 | ||||||
| 2025-08-14 | 13F | Wells Fargo & Company/mn | 275 | −27,06 | 9 | −27,27 | ||||
| 2025-08-29 | NP | Clayton Street Trust - Protective Life Dynamic Allocation Series - Growth Portfolio | 59 766 | −11,22 | 1 921 | −2,93 | ||||
| 2025-08-14 | 13F | Main Street Financial Solutions, LLC | 14 251 | 458 | ||||||
| 2025-08-14 | 13F | DZ BANK AG Deutsche Zentral Genossenschafts Bank, Frankfurt am Main | 24 388 | −97,45 | 784 | −97,21 | ||||
| 2025-08-07 | 13F | Evoke Wealth, Llc | 52 572 | 0,00 | 1 690 | 9,39 | ||||
| 2025-08-13 | 13F | Baird Financial Group, Inc. | 10 778 | 7,38 | 347 | 17,29 | ||||
| 2025-04-25 | 13F | New Millennium Group LLC | 0 | −100,00 | 0 | |||||
| 2025-08-14 | 13F | Janus Henderson Group Plc | 820 571 | −6,23 | 26 381 | 1,67 | ||||
| 2025-06-27 | NP | INTL - Main International ETF | 0 | −100,00 | 0 | −100,00 | ||||
| 2025-06-26 | NP | SSXU - Day Hagan/Ned Davis Research Smart Sector International ETF | 171 793 | −31,68 | 5 250 | −28,28 | ||||
| 2025-08-29 | NP | Clayton Street Trust - Protective Life Dynamic Allocation Series - Moderate Portfolio | 738 036 | −4,58 | 23 728 | 4,35 | ||||
| 2025-04-25 | 13F | Saxon Interests, Inc. | 0 | −100,00 | 0 | |||||
| 2025-05-14 | 13F | Level Four Advisory Services, Llc | 0 | −100,00 | 0 | |||||
| 2025-08-14 | 13F | EP Wealth Advisors, Inc. | 18 738 | −93,71 | 602 | −93,13 | ||||
| 2025-08-12 | 13F | Winnow Wealth Llc | 119 965 | 3 857 | ||||||
| 2025-05-09 | 13F | CoreCap Advisors, LLC | 0 | −100,00 | 0 | |||||
| 2025-08-04 | 13F | Simon Quick Advisors, Llc | 249 307 | 8 015 | ||||||
| 2025-08-12 | 13F | Proequities, Inc. | 0 | 0 | ||||||
| 2025-08-14 | 13F | Ameriprise Financial Inc | 249 268 | −38,86 | 8 014 | −33,09 | ||||
| 2025-08-11 | 13F | Brown Brothers Harriman & Co | 619 | 20 | ||||||
| 2025-07-11 | 13F | Adirondack Trust Co | 539 | 17 | ||||||
| 2025-08-13 | 13F | Kilter Group LLC | 101 | 3 | ||||||
| 2025-08-14 | 13F | Raymond James Financial Inc | 311 468 | −2,75 | 10 014 | 6,35 | ||||
| 2025-08-04 | 13F | Spire Wealth Management | 59 | −14,49 | 2 | −50,00 | ||||
| 2025-08-14 | 13F | UBS Group AG | 271 576 | −29,55 | 8 731 | −22,97 | ||||
| 2025-08-14 | 13F | Kovitz Investment Group Partners, LLC | 35 421 | −0,71 | 1 139 | 8,59 | ||||
| 2025-04-01 | 13F | Confluence Investment Management Llc | 0 | −100,00 | 0 | |||||
| 2025-08-11 | 13F | Principal Securities, Inc. | 44 | 1 | ||||||
| 2025-08-14 | 13F | Quantinno Capital Management LP | 38 608 | −1,74 | 1 241 | 7,45 | ||||
| 2025-04-25 | 13F | Stonebridge Financial Group, LLC | 0 | −100,00 | 0 | |||||
| 2025-08-06 | 13F | Agf Management Ltd | 430 131 | 6,71 | 13 829 | 16,69 | ||||
| 2025-05-09 | 13F | Wealthspire Advisors, LLC | 0 | −100,00 | 0 | |||||
| 2025-08-14 | 13F | Goldman Sachs Group Inc | 243 380 | 7 825 | ||||||
| 2025-07-14 | 13F | Toth Financial Advisory Corp | 0 | −100,00 | 0 | |||||
| 2025-06-17 | NP | MCNAX - Madison Conservative Allocation Fund Conservative Allocation Fund Class A | 31 703 | 10,04 | 969 | 15,51 | ||||
| 2025-08-14 | 13F | Hrt Financial Lp | 34 942 | 1 | ||||||
| 2025-08-19 | 13F | Newbridge Financial Services Group, Inc. | 80 | 0,00 | 3 | 0,00 | ||||
| 2025-07-28 | 13F | Fairman Group, LLC | 67 | 0,00 | 2 | 100,00 | ||||
| 2025-07-29 | 13F | Koshinski Asset Management, Inc. | 8 285 | 9,81 | 266 | 20,36 | ||||
| 2025-08-04 | 13F | Virtus Family Office LLC | 17 800 | 39,88 | 572 | 52,94 | ||||
| 2025-08-01 | 13F | New York Life Investment Management Llc | 0 | −100,00 | 0 | |||||
| 2025-08-13 | 13F | EverSource Wealth Advisors, LLC | 31 945 | 1,76 | 1 027 | 11,39 | ||||
| 2025-08-05 | 13F | Mma Asset Management Llc | 146 675 | 4 716 | ||||||
| 2025-08-04 | 13F | Pensionmark Financial Group, Llc | 13 748 | 2,83 | 442 | 12,47 | ||||
| 2025-08-05 | 13F | Carolinas Wealth Consulting Llc | 0 | −100,00 | 0 | −100,00 | ||||
| 2025-07-16 | 13F | Paragon Capital Management Ltd | 152 205 | 118,35 | 4 893 | 138,80 | ||||
| 2025-08-14 | 13F | Sunbelt Securities, Inc. | 200 | 0,00 | 6 | 0,00 | ||||
| 2025-08-13 | 13F | Cerity Partners LLC | 11 336 | −23,41 | 364 | −16,32 | ||||
| 2025-07-17 | 13F | Keystone Global Partners, LLC | 0 | −100,00 | 0 | |||||
| 2025-08-08 | 13F | Gts Securities Llc | 324 654 | 10 438 | ||||||
| 2025-08-12 | 13F | AlphaCore Capital LLC | 79 | 71,74 | 3 | 100,00 | ||||
| 2025-07-17 | 13F | Janney Montgomery Scott LLC | 75 474 | −2,34 | 2 | 0,00 | ||||
| 2025-09-04 | 13F/A | Advisor Group Holdings, Inc. | 19 766 | 9,16 | 636 | 19,36 | ||||
| 2025-08-12 | 13F | O'shaughnessy Asset Management, Llc | 5 904 | −6,46 | 190 | 2,16 | ||||
| 2025-05-15 | 13F | GWM Advisors LLC | 0 | −100,00 | 0 | |||||
| 2025-07-25 | 13F | Almanack Investment Partners, LLC. | 30 475 | 4,33 | 980 | 14,10 | ||||
| 2025-08-08 | 13F | Pnc Financial Services Group, Inc. | 4 702 | 0,00 | 151 | 9,42 | ||||
| 2025-08-08 | 13F | Mittelman Wealth Management | 108 395 | 13,55 | 3 485 | 24,16 | ||||
| 2025-08-14 | 13F | Comerica Bank | 36 978 | 123,72 | 1 189 | 144,95 | ||||
| 2025-07-22 | 13F | Belpointe Asset Management LLC | 19 820 | 637 | ||||||
| 2025-08-08 | 13F | Rockefeller Capital Management L.P. | 0 | −100,00 | 0 | |||||
| 2025-08-12 | 13F | Franklin Resources Inc | 7 547 | −98,15 | 243 | −97,98 | ||||
| 2025-08-14 | 13F | Mariner, LLC | 47 319 | 0,35 | 1 521 | 9,74 | ||||
| 2025-08-14 | 13F | Paces Ferry Wealth Advisors, Llc | 10 260 | −1,89 | 330 | 7,17 | ||||
| 2025-07-23 | 13F | Vontobel Holding Ltd. | 144 100 | −5,88 | 4 633 | 2,98 | ||||
| 2025-05-15 | 13F | Proquility Private Wealth Partners, LLC | 242 846 | 43,90 | 7 140 | 47,87 | ||||
| 2025-07-15 | 13F | Armis Advisers, LLC | 169 366 | 5 274 | ||||||
| 2025-08-13 | 13F | Rsm Us Wealth Management Llc | 8 644 | −1,90 | 278 | 6,95 | ||||
| 2025-07-21 | 13F | Ameritas Advisory Services, LLC | 200 | 6 | ||||||
| 2025-07-23 | 13F | Clear Creek Financial Management, LLC | 41 405 | 1 331 | ||||||
| 2025-08-06 | 13F | Innealta Capital, Llc | 220 030 | −17,43 | 7 074 | −9,71 | ||||
| 2025-07-31 | 13F | Brinker Capital Investments, LLC | 0 | −100,00 | 0 | −100,00 | ||||
| 2025-07-31 | 13F | Sage Mountain Advisors LLC | 2 125 | 0,00 | 68 | 9,68 | ||||
| 2025-08-14 | 13F | Jane Street Group, Llc | 67 027 | 2 155 | ||||||
| 2025-07-14 | 13F | Armstrong Advisory Group, Inc | 3 383 | 109 | ||||||
| 2025-07-28 | 13F | SFG Wealth Management, LLC. | 0 | −100,00 | 0 | |||||
| 2025-08-04 | 13F | Impact Partnership Wealth, LLC | 262 140 | 3,60 | 8 428 | 13,28 | ||||
| 2025-06-17 | NP | MMDAX - Madison Moderate Allocation Fund Moderate Allocation Fund Class A | 124 124 | 11,04 | 3 793 | 16,60 | ||||
| 2025-06-17 | NP | MAGSX - Madison Aggressive Allocation Fund Aggressive Allocation Fund Class A | 96 500 | 8,60 | 2 949 | 14,04 | ||||
| 2025-05-05 | 13F | Eagle Bay Advisors LLC | 0 | −100,00 | 0 | |||||
| 2025-07-31 | 13F | Opes Wealth Management LLC | 185 706 | 5,60 | 5 970 | 15,47 | ||||
| 2025-08-14 | 13F | Knightsbridge Asset Management, Llc | 51 415 | 9,47 | 1 653 | 19,71 | ||||
| 2025-08-12 | 13F | LPL Financial LLC | 867 229 | −12,70 | 27 881 | −4,54 | ||||
| 2025-07-10 | 13F | Farmers & Merchants Trust Co of Chambersburg PA | 369 | 0,00 | 0 | |||||
| 2025-05-15 | 13F | Citadel Advisors Llc | Put | 0 | −100,00 | 0 | −100,00 | |||
| 2025-07-14 | 13F | GAMMA Investing LLC | 259 | 0,00 | 8 | 14,29 | ||||
| 2025-08-14 | 13F | Fmr Llc | 4 527 | −7,73 | 146 | 0,69 | ||||
| 2025-08-29 | NP | GDMA - Gadsden Dynamic Multi-Asset ETF | 230 062 | −10,19 | 7 396 | −1,79 | ||||
| 2025-08-18 | NP | ULTRA SERIES FUND - Aggressive Allocation Fund Class I | 65 269 | −8,93 | 2 098 | −0,43 | ||||
| 2025-08-06 | 13F | Commonwealth Equity Services, Llc | 10 560 | 40,63 | 0 | |||||
| 2025-05-15 | 13F | Citadel Advisors Llc | Call | 0 | −100,00 | 0 | −100,00 | |||
| 2025-07-07 | 13F | General Partner, Inc. | 30 295 | 0,00 | 974 | 9,33 | ||||
| 2025-07-31 | 13F | Leavell Investment Management, Inc. | 87 815 | 4,13 | 2 823 | 13,88 | ||||
| 2025-08-18 | 13F/A | National Bank Of Canada /fi/ | 5 627 | 85,96 | 181 | 104,55 | ||||
| 2025-08-14 | 13F | Old Mission Capital Llc | 14 987 | 482 | ||||||
| 2025-08-18 | NP | ULTRA SERIES FUND - Conservative Allocation Fund Class I | 30 115 | −18,79 | 968 | −11,19 | ||||
| 2025-05-09 | 13F | Connable Office Inc | 0 | −100,00 | 0 | |||||
| 2025-08-12 | NP | DFNDX - Kensington Defender Fund Institutional Class | 120 172 | −51,15 | 3 864 | −45,40 | ||||
| 2025-07-10 | 13F | Atticus Wealth Management, Llc | 125 | 4 | ||||||
| 2025-08-05 | 13F | Harel Insurance Investments & Financial Services Ltd. | 3 400 | 385,71 | 0 | |||||
| 2025-08-12 | 13F | Accordant Advisory Group Inc | 119 965 | 3 857 | ||||||
| 2025-08-13 | 13F | Berkshire Asset Management Llc/pa | 6 586 | 0,00 | 212 | 4,46 | ||||
| 2025-08-14 | 13F | Stifel Financial Corp | 22 890 | 0,94 | 736 | 10,36 | ||||
| 2025-08-12 | 13F | Archer Investment Corp | 313 | 0,00 | 10 | 11,11 | ||||
| 2025-08-13 | 13F | Flow Traders U.s. Llc | 32 801 | 1 | ||||||
| 2025-08-11 | 13F | Empowered Funds, LLC | 230 687 | −9,94 | 7 417 | −1,53 | ||||
| 2025-08-06 | 13F | AE Wealth Management LLC | 825 | −7,20 | 27 | 0,00 | ||||
| 2025-08-13 | 13F | GeoWealth Management, LLC | 5 919 | 190 | ||||||
| 2025-05-27 | NP | MAINSTAY VP FUNDS TRUST - MainStay VP IQ Hedge Multi-Strategy Portfolio Initial Class | 2 445 | −13,36 | 72 | −11,25 | ||||
| 2025-08-13 | 13F | Avestar Capital, LLC | 321 882 | 10 349 | ||||||
| 2025-03-28 | NP | QAI - IQ Hedge Multi-Strategy Tracker ETF | 7 639 | 5,41 | 222 | 6,22 | ||||
| 2025-08-18 | NP | ULTRA SERIES FUND - Moderate Allocation Fund Class I | 114 414 | −20,62 | 3 678 | −13,19 | ||||
| 2025-05-12 | 13F | Benjamin Edwards Inc | 0 | −100,00 | 0 | |||||
| 2025-07-15 | 13F | Td Private Client Wealth Llc | 1 132 | −42,24 | 36 | −36,84 | ||||
| 2025-08-14 | 13F | Fiduciary Trust Co | 15 055 | 0,00 | 484 | 9,50 | ||||
| 2025-07-17 | 13F | Clean Yield Group | 1 750 | 0,00 | 56 | 9,80 | ||||
| 2025-07-29 | 13F | Crux Wealth Advisors | 23 686 | −28,08 | 762 | −21,38 | ||||
| 2025-08-11 | 13F | Inspire Advisors, LLC | 37 405 | 87,22 | 1 203 | 104,77 | ||||
| 2025-04-10 | 13F | Hennion & Walsh Asset Management, Inc. | 0 | −100,00 | 0 | |||||
| 2025-08-01 | 13F | Rossby Financial, LCC | 50 | 0,00 | 2 | 0,00 | ||||
| 2025-08-01 | 13F | Envestnet Asset Management Inc | 659 760 | 0,01 | 21 211 | 9,37 | ||||
| 2025-07-25 | 13F | Cwm, Llc | 11 651 | 1 072,13 | 0 | |||||
| 2025-08-08 | 13F | Principal Financial Group Inc | 0 | −100,00 | 0 | |||||
| 2025-08-18 | 13F | Geneos Wealth Management Inc. | 389 | 13 | ||||||
| 2025-08-08 | 13F | Kingsview Wealth Management, LLC | 7 371 | 237 | ||||||
| 2025-08-07 | 13F | Altman Advisors, Inc. | 57 432 | 3,86 | 1 836 | 8,64 | ||||
| 2025-05-16 | 13F | Jones Financial Companies Lllp | 0 | −100,00 | 0 | |||||
| 2025-08-07 | 13F | Allworth Financial LP | 70 | −85,26 | 2 | −85,71 | ||||
| 2025-08-29 | NP | RAA - SMI 3Fourteen Real Asset Allocation ETF SMI 3Fourteen REAL Asset Allocation ETF | 152 121 | 4 891 | ||||||
| 2025-08-12 | 13F | Steward Partners Investment Advisory, Llc | 313 151 | 0,50 | 10 068 | 9,90 | ||||
| 2025-08-14 | 13F | Toroso Investments, LLC | 136 325 | 12,91 | 4 383 | 23,47 | ||||
| 2025-08-01 | 13F | Bessemer Group Inc | 0 | −100,00 | 0 | |||||
| 2025-05-15 | 13F | Main Management LLC | 0 | −100,00 | 0 | |||||
| 2025-08-13 | 13F | Bare Financial Services, Inc | 432 | 0,00 | 14 | 8,33 | ||||
| 2025-08-15 | 13F | Morgan Stanley | 4 441 003 | 7,07 | 142 778 | 17,08 | ||||
| 2025-08-12 | 13F | Kensington Asset Management, LLC | 120 172 | 3 864 | ||||||
| 2025-07-29 | 13F | Private Trust Co Na | 168 | −9,19 | 5 | 0,00 | ||||
| 2025-06-27 | NP | DAAVX - Dunham Dynamic Macro Fund Class A | 153 100 | 3,80 | 4 679 | 8,97 | ||||
| 2025-08-14 | 13F | Alaska Permanent Fund Corp | 0 | −100,00 | 0 | |||||
| 2025-05-12 | 13F | Sandy Spring Bank | 100 | 3 | ||||||
| 2025-08-14 | 13F | Hara Capital LLC | 120 | 0,00 | 4 | 0,00 | ||||
| 2025-08-28 | NP | ICCIX - Dynamic International Opportunity Fund Class I | 219 688 | −17,46 | 7 063 | −9,74 | ||||
| 2025-08-12 | 13F | Global Retirement Partners, LLC | 10 218 | −4,92 | 329 | 6,84 | ||||
| 2025-05-13 | 13F | Heck Capital Advisors, LLC | 0 | −100,00 | 0 | −100,00 | ||||
| 2025-08-14 | 13F | Principia Wealth Advisory, LLC | 2 401 | 77 | ||||||
| 2025-08-08 | 13F | Tortoise Investment Management, LLC | 4 400 | 0,00 | 141 | 9,30 | ||||
| 2025-05-15 | 13F | SRS Capital Advisors, Inc. | 0 | −100,00 | 0 | |||||
| 2025-08-11 | 13F | HHM Wealth Advisors, LLC | 100 | 3 | ||||||
| 2025-07-28 | 13F | BRYN MAWR TRUST Co | 7 636 | −8,32 | 245 | 0,41 | ||||
| 2025-05-14 | 13F | Susquehanna International Group, Llp | 0 | −100,00 | 0 | |||||
| 2025-08-11 | 13F | Annis Gardner Whiting Capital Advisors, LLC | 731 | 24 | ||||||
| 2025-08-13 | 13F | Townsquare Capital Llc | 0 | −100,00 | 0 | |||||
| 2025-08-14 | 13F | Qube Research & Technologies Ltd | 5 732 | 184 | ||||||
| 2025-08-12 | 13F | Jpmorgan Chase & Co | 71 615 | 125,63 | 2 302 | 146,73 | ||||
| 2025-07-07 | 13F | Nova Wealth Management, Inc. | 70 | 2 | ||||||
| 2025-05-13 | 13F | Bokf, Na | 0 | −100,00 | 0 | |||||
| 2025-08-14 | 13F | Royal Bank Of Canada | 174 874 | 23,41 | 5 621 | 34,93 | ||||
| 2025-08-04 | 13F | Assetmark, Inc | 80 | 3 | ||||||
| 2025-08-13 | 13F | Green Harvest Asset Management LLC | 50 151 | 44,17 | 1 612 | 57,73 | ||||
| 2025-08-13 | 13F | Capital Analysts, Inc. | 121 | 0,00 | 0 | |||||
| 2025-07-31 | 13F | Wealthfront Advisers Llc | 15 481 | 2,31 | 498 | 11,94 | ||||
| 2025-08-15 | 13F | Chapman Financial Group, Llc | 15 425 | −3,74 | 496 | 8,08 | ||||
| 2025-07-16 | 13F | BOS Asset Management, LLC | 8 232 | 265 | ||||||
| 2025-07-30 | 13F | Strategic Investment Management, Llc | 0 | −100,00 | 0 | |||||
| 2025-08-08 | 13F | Cetera Investment Advisers | 43 242 | 31,16 | 1 390 | 43,45 | ||||
| 2025-05-15 | 13F | Main Management ETF Advisors, LLC | 0 | −100,00 | 0 | |||||
| 2025-08-11 | 13F | Private Advisor Group, LLC | 11 185 | −5,28 | 360 | 3,46 | ||||
| 2025-07-08 | 13F | Boltwood Capital Management | 12 200 | 34,07 | 392 | 46,82 | ||||
| 2025-08-14 | 13F | Coastal Bridge Advisors, LLC | 9 273 | 0,00 | 298 | 9,56 | ||||
| 2025-08-01 | 13F | Y-Intercept (Hong Kong) Ltd | 9 663 | 311 | ||||||
| 2025-08-08 | 13F | Arvest Bank Trust Division | 530 359 | −0,91 | 17 051 | 8,36 | ||||
| 2025-07-11 | 13F | Farther Finance Advisors, LLC | 1 284 | −65,58 | 41 | −62,04 | ||||
| 2025-07-03 | 13F | Arvest Investments, Inc. | 205 030 | −1,99 | 6 592 | 7,17 | ||||
| 2025-08-13 | 13F | Congress Wealth Management LLC / DE / | 321 981 | −1,00 | 10 352 | 8,26 | ||||
| 2025-05-14 | 13F | Bnp Paribas Arbitrage, Sa | 0 | −100,00 | 0 | |||||
| 2025-07-18 | 13F | Truist Financial Corp | 15 965 | −5,36 | 513 | 3,64 | ||||
| 2025-08-13 | 13F | Hsbc Holdings Plc | 15 510 | 499 | ||||||
| 2025-08-14 | 13F | D. E. Shaw & Co., Inc. | 32 437 | 1 043 | ||||||
| 2025-07-28 | 13F | Rainwater Charitable Foundation | 328 743 | 0,00 | 10 569 | 9,35 | ||||
| 2025-08-14 | 13F | Citadel Advisors Llc | 165 020 | 5 305 | ||||||
| 2025-07-31 | 13F | Cambridge Investment Research Advisors, Inc. | 6 358 | −14,42 | 0 | |||||
| 2025-08-26 | 13F/A | Thrivent Financial For Lutherans | 347 380 | −8,15 | 11 | 0,00 |
Other Listings
| MX:FLJP |