Grundläggande statistik
| Institutionella ägare | 224 total, 224 long only, 0 short only, 0 long/short - change of 25,00% MRQ |
| Genomsnittlig portföljallokering | 0.7286 % - change of 11,43% MRQ |
| Institutionella aktier (lång) | 68 919 779 (ex 13D/G) - change of 17,23MM shares 33,34% MRQ |
| Institutionellt värde (lång) | $ 2 173 671 USD ($1000) |
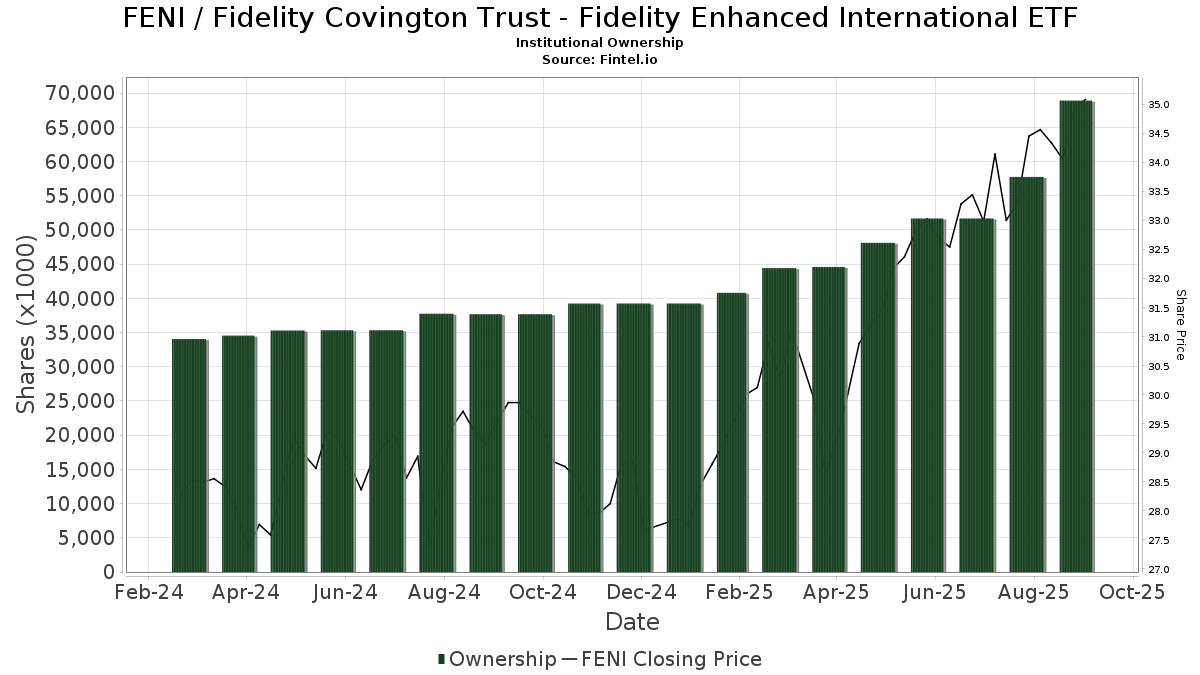
Institutionellt ägande och aktieägare
Fidelity Covington Trust - Fidelity Enhanced International ETF (US:FENI) har 224 Institutionella ägare och aktieägare som har lämnat in 13D/G- eller 13F-formulär till Securities Exchange Commission (SEC). Dessa institut innehar totalt 68,919,779 aktier. Största aktieägare inkluderar Fmr Llc, Northwestern Mutual Wealth Management Co, Variable Insurance Products Fund V - FundsManager 60% Portfolio Investor Class, Variable Insurance Products Fund V - FundsManager 50% Portfolio Investor Class, Fragasso Group Inc., Commonwealth Equity Services, Llc, Syntegra Private Wealth Group, LLC, Kestra Advisory Services, LLC, Variable Insurance Products Fund V - FundsManager 70% Portfolio Investor Class, and Cornerstone Planning Group LLC .
Fidelity Covington Trust - Fidelity Enhanced International ETF (ARCA:FENI) Institutionell ägarstruktur visar institutioners och fonders nuvarande positioner i företaget, samt de senaste förändringarna i positionernas storlek. Större aktieägare kan vara enskilda investerare, fonder, hedgefonder eller institutioner. Bilaga 13D visar att investeraren äger (eller ägde) mer än 5% av företaget och avser (eller avsåg) att aktivt eftersträva en förändring av affärsstrategin. Schedule 13G indikerar en passiv investering på över 5%.
The share price as of September 17, 2025 is 35,08 / share. Previously, on September 18, 2024, the share price was 29,53 / share. This represents an increase of 18,79% over that period.
Fondsentimentets poäng
Fondsentimentet poängen(fka Ägarackumulation-poäng) visar vilka aktier som är mest köpta av fonder. Det är resultatet av en sofistikerad kvantitativ flerfaktormodell som identifierar företag med de högsta nivåerna av institutionell ackumulering. Poängsättningsmodellen använder en kombination av den totala ökningen av redovisade ägare, förändringarna i portföljallokeringarna för dessa ägare och andra mått. Siffran sträcker sig från 0 till 100, där högre siffror indikerar en högre nivå av ackumulering i förhållande till sina konkurrenter, och 50 är genomsnittet.
Uppdateringsfrekvens: Dagligen
Se Ownership Explorer, som innehåller en lista över de högst rankade företagen.
Institutionell sälj/köp-kvot
Förutom att rapportera vanliga eget kapital- och skuldemissioner måste institutioner med mer än 100MM tillgångar under förvaltning också avslöja sina innehav av sälj- och köpoptioner. Eftersom säljoptioner i allmänhet indikerar ett negativt sentiment och köpoptioner indikerar ett positivt sentiment, kan vi få en uppfattning om det övergripande institutionella sentimentet genom att plotta förhållandet mellan säljoptioner och köpoptioner. Diagrammet till höger visar det historiska förhållandet mellan sälj- och köpoptioner för detta instrument.
Genom att använda sälj/köp-kvoten som en indikator på aktieägarnas sentiment undviker man en av de största bristerna med att använda det totala institutionella ägandet, nämligen att en betydande del av de förvaltade tillgångarna investeras passivt för att följa index. Passivt förvaltade fonder köper vanligtvis inte optioner, så indikatorn för sälj/köp-kvoten ger en bättre bild av stämningen i aktivt förvaltade fonder.
13F- och NPORT-arkiveringar
Detaljer om 13F-arkiveringar är gratis. Detaljer om NP-arkiveringar kräver ett premiummedlemskap. Gröna rader indikerar nya positioner. Röda rader indikerar stängda positioner. Klicka på länk symbolen för att se hela transaktionshistoriken.
Uppgradera
för att låsa upp premiumdata och exportera till Excel ![]() .
.
| Fil Datum | Källa | Investerare | Typ | Genomsnittligt pris (beräknat) |
Aktier | Δ Aktier (%) |
Rapporterat värde (1000 USD) |
Δ Värde (%) |
Portföljallokering (%) |
|
|---|---|---|---|---|---|---|---|---|---|---|
| 2025-08-22 | NP | Variable Insurance Products Fund V - FundsManager 60% Portfolio Investor Class | 4 491 183 | 0,00 | 149 377 | 11,76 | ||||
| 2025-08-11 | 13F | Cornerstone Planning Group LLC | 1 569 960 | 51 981 | ||||||
| 2025-07-11 | 13F | Bond & Devick Financial Network, Inc. | 10 152 | 1,73 | 338 | 13,85 | ||||
| 2025-08-14 | 13F | GWM Advisors LLC | 2 011 | 1,06 | 67 | 11,86 | ||||
| 2025-07-17 | 13F | Janney Montgomery Scott LLC | 221 896 | 6,06 | 7 | 16,67 | ||||
| 2025-08-13 | 13F | Fiduciary Group LLC | 18 319 | 0,03 | 609 | 11,95 | ||||
| 2025-08-11 | 13F | Advisor Resource Council | 0 | −100,00 | 0 | |||||
| 2025-08-22 | NP | Variable Insurance Products Fund V - FundsManager 30% Portfolio Service Class | 2 148 | 4,58 | 71 | 16,39 | ||||
| 2025-08-07 | 13F | Nwam Llc | 19 478 | 1,79 | 643 | 12,83 | ||||
| 2025-07-23 | 13F | Gerber, Llc | 441 737 | 2,30 | 14 692 | 14,33 | ||||
| 2025-08-06 | 13F | Wedbush Securities Inc | 8 339 | 0 | ||||||
| 2025-08-07 | 13F | Kestra Private Wealth Services, Llc | 11 417 | 33,75 | 380 | 49,21 | ||||
| 2025-08-14 | 13F | Clarity Asset Management, Inc. | 19 635 | −1,10 | 653 | 10,68 | ||||
| 2025-07-21 | 13F | Ameritas Advisory Services, LLC | 11 234 | 374 | ||||||
| 2025-08-08 | 13F | IMA Wealth, Inc. | 374 | 1,08 | 12 | 9,09 | ||||
| 2025-08-12 | 13F | Tableaux Llc | 0 | −100,00 | 0 | |||||
| 2025-05-15 | 13F | Front Row Advisors LLC | 0 | −100,00 | 0 | |||||
| 2025-08-13 | 13F | Rsm Us Wealth Management Llc | 376 481 | 438,88 | 12 522 | 502,26 | ||||
| 2025-08-04 | 13F | Kovack Advisors, Inc. | 34 274 | 3,09 | 1 140 | 15,17 | ||||
| 2025-08-12 | 13F | Cornerstone Wealth Management, LLC | 6 552 | 218 | ||||||
| 2025-08-14 | 13F | Fmr Llc | 20 838 158 | −2,65 | 693 077 | 8,80 | ||||
| 2025-08-01 | 13F | Envestnet Asset Management Inc | 237 707 | 531,78 | 7 906 | 606,52 | ||||
| 2025-08-14 | 13F | Stifel Financial Corp | 19 585 | −71,55 | 651 | −68,21 | ||||
| 2025-07-14 | 13F | McMahon Financial Advisors, LLC | 331 662 | 361,42 | 11 031 | 415,71 | ||||
| 2025-08-15 | 13F | Captrust Financial Advisors | 396 171 | 14,60 | 13 177 | 28,07 | ||||
| 2025-08-01 | 13F | Pasadena Private Wealth, LLC | 285 514 | 9 496 | ||||||
| 2025-08-05 | 13F | Smith Shellnut Wilson Llc /adv | 29 371 | −46,64 | 977 | −40,42 | ||||
| 2025-08-14 | 13F | UBS Group AG | 7 146 | 141,01 | 238 | 169,32 | ||||
| 2025-07-17 | 13F | Nelson, Van Denburg & Campbell Wealth Management Group, LLC | 19 274 | 0,00 | 641 | 11,87 | ||||
| 2025-08-11 | 13F | Regal Investment Advisors LLC | 9 689 | 0,00 | 322 | 11,81 | ||||
| 2025-07-30 | 13F | Exencial Wealth Advisors, Llc | 13 683 | −1,33 | 455 | 10,44 | ||||
| 2025-07-29 | 13F | Madison Wealth Partners, Inc | 59 747 | 132,73 | 1 987 | 160,42 | ||||
| 2025-07-30 | 13F | Financial Perspectives, Inc | 29 | 0,00 | 1 | |||||
| 2025-08-07 | 13F | Allworth Financial LP | 1 228 | 17,51 | 41 | 29,03 | ||||
| 2025-08-08 | 13F | Creative Planning | 17 149 | 44,35 | 570 | 61,47 | ||||
| 2025-08-14 | 13F | Betterment LLC | 20 872 | 1 | ||||||
| 2025-07-17 | 13F | Investment Research & Advisory Group, Inc. | 1 | 0 | ||||||
| 2025-08-04 | 13F | AlphaStar Capital Management, LLC | 336 729 | 11,16 | 11 200 | 24,24 | ||||
| 2025-07-23 | 13F | WESPAC Advisors, LLC | 19 321 | 26,78 | 643 | 41,72 | ||||
| 2025-08-15 | 13F | Kestra Advisory Services, LLC | 1 980 290 | 80,39 | 65 864 | 101,61 | ||||
| 2025-07-28 | 13F | Mutual Advisors, LLC | 33 889 | 58,79 | 1 147 | 75,92 | ||||
| 2025-07-25 | 13F | Ball & Co Wealth Management Inc. | 16 548 | −8,63 | 1 | |||||
| 2025-08-05 | 13F | MidAtlantic Capital Management, Inc. | 8 515 | 3,73 | 283 | 15,98 | ||||
| 2025-08-12 | 13F | Jpmorgan Chase & Co | 184 490 | 2 638,46 | 6 136 | 2 968,00 | ||||
| 2025-07-30 | 13F | Advantage Trust Co | 341 192 | 2,15 | 11 348 | 14,18 | ||||
| 2025-08-12 | 13F | Steward Partners Investment Advisory, Llc | 37 024 | 1 036,05 | 1 231 | 1 182,29 | ||||
| 2025-07-18 | 13F | Dogwood Wealth Management LLC | 87 | 3 | ||||||
| 2025-07-10 | 13F | Kmg Fiduciary Partners, Llc | 184 806 | 7,16 | 6 147 | 19,76 | ||||
| 2025-08-08 | 13F | Pnc Financial Services Group, Inc. | 220 | 0,00 | 7 | 16,67 | ||||
| 2025-08-14 | 13F | Clg Llc | 68 100 | −13,40 | 2 265 | −3,21 | ||||
| 2025-08-14 | 13F | McIlrath & Eck, LLC | 694 | 1,02 | 23 | 15,00 | ||||
| 2025-08-22 | NP | Variable Insurance Products Fund V - FundsManager 50% Portfolio Investor Class | 3 022 291 | 0,00 | 100 521 | 11,76 | ||||
| 2025-07-23 | 13F | BankPlus Trust Department | 766 | 0,00 | 25 | 13,64 | ||||
| 2025-04-30 | 13F | Cerity Partners LLC | 0 | −100,00 | 0 | |||||
| 2025-08-08 | 13F | Advisory Resource Group | 131 213 | 4 364 | ||||||
| 2025-07-09 | 13F | Fragasso Group Inc. | 2 390 713 | 12,63 | 79 515 | 25,87 | ||||
| 2025-07-29 | 13F | Stratos Wealth Partners, LTD. | 92 955 | 41,09 | 3 092 | 57,70 | ||||
| 2025-07-28 | 13F | Evernest Financial Advisors, LLC | 248 060 | 25,22 | 8 250 | 39,95 | ||||
| 2025-08-04 | 13F | Flagship Harbor Advisors, Llc | 37 102 | 43,78 | 1 234 | 60,89 | ||||
| 2025-08-12 | 13F | Proequities, Inc. | 0 | 0 | ||||||
| 2025-05-08 | 13F | Savant Capital, LLC | 0 | −100,00 | 0 | |||||
| 2025-08-04 | 13F | Spire Wealth Management | 655 | 22 | ||||||
| 2025-08-11 | 13F | Strategic Wealth Partners, Ltd. | 771 | 26 | ||||||
| 2025-07-15 | 13F | Axis Wealth Partners, LLC | 13 061 | 28,58 | 434 | 43,71 | ||||
| 2025-08-14 | 13F | TCG Advisory Services, LLC | 10 061 | 4,29 | 335 | 16,38 | ||||
| 2025-07-30 | 13F | Syntegra Private Wealth Group, LLC | 2 079 283 | 3 759,17 | 69 157 | 4 214,16 | ||||
| 2025-07-31 | 13F | Graybill Bartz & Assoc Ltd | 0 | −100,00 | 0 | |||||
| 2025-07-29 | 13F | Systelligence, LLC | 193 573 | 6 438 | ||||||
| 2025-08-12 | 13F/A | Cozad Asset Management Inc | 15 353 | 511 | ||||||
| 2025-07-07 | 13F | Wealth Alliance Advisory Group, LLC | 817 928 | 2,53 | 27 204 | 14,59 | ||||
| 2025-07-31 | 13F | Cambridge Investment Research Advisors, Inc. | 520 774 | 25,91 | 17 | 41,67 | ||||
| 2025-08-12 | 13F | Leigh Baldwin & Co., Llc | 56 134 | 1 867 | ||||||
| 2025-07-23 | 13F | Sax Wealth Advisors, Llc | 106 498 | 4,70 | 3 542 | 17,01 | ||||
| 2025-08-14 | 13F | Jane Street Group, Llc | 237 574 | −31,80 | 7 902 | −23,79 | ||||
| 2025-08-12 | 13F | O'shaughnessy Asset Management, Llc | 1 884 | 48,35 | 63 | 67,57 | ||||
| 2025-08-13 | 13F | Financial Freedom, LLC | 2 310 | 1,05 | 77 | 11,76 | ||||
| 2025-08-12 | 13F | Armor Investment Advisors, LLC | 1 797 | 60 | ||||||
| 2025-08-05 | 13F | Gibraltar Capital Management, Inc. | 11 390 | 1,07 | 379 | 12,84 | ||||
| 2025-07-23 | 13F | Element Wealth, LLC | 7 864 | 262 | ||||||
| 2025-08-08 | 13F | Cetera Investment Advisers | 257 718 | 1 229,88 | 8 572 | 1 388,02 | ||||
| 2025-07-11 | 13F | Orrstown Financial Services Inc | 1 286 213 | 3,67 | 42 779 | 15,86 | ||||
| 2025-07-24 | 13F | Aurora Private Wealth, Inc. | 0 | −100,00 | 0 | |||||
| 2025-04-22 | 13F | Gpwm Llc | 0 | −100,00 | 0 | |||||
| 2025-08-05 | 13F | Dunhill Financial, LLC | 96 | 45,45 | 3 | 200,00 | ||||
| 2025-08-05 | 13F | Sigma Planning Corp | 26 153 | 171,55 | 870 | 203,85 | ||||
| 2025-08-26 | NP | EVVLX - The E-Valuator Very Conservative (0%-15%) RMS Fund Service Class Shares | 815 | 27 | ||||||
| 2025-07-22 | 13F | Wealthcare Advisory Partners LLC | 66 610 | 39,10 | 2 215 | 55,44 | ||||
| 2025-08-06 | 13F | Golden State Wealth Management, LLC | 60 | 0,00 | 2 | 0,00 | ||||
| 2025-08-08 | 13F | Kingsview Wealth Management, LLC | 48 189 | 1 603 | ||||||
| 2025-08-05 | 13F | Dahring | Cusmano Llc | 171 391 | −0,54 | 5 700 | 11,15 | ||||
| 2025-07-10 | 13F | Sharkey, Howes & Javer | 33 196 | 85,63 | 1 104 | 107,52 | ||||
| 2025-07-25 | 13F | Sequoia Financial Advisors, LLC | 16 050 | 13,71 | 534 | 26,90 | ||||
| 2025-07-25 | 13F | PrairieView Partners, LLC | 2 779 | 0,11 | 0 | |||||
| 2025-07-11 | 13F | Grove Bank & Trust | 300 | 10 | ||||||
| 2025-08-14 | 13F | Susquehanna International Group, Llp | 136 906 | 72,74 | 4 553 | 93,09 | ||||
| 2025-07-21 | 13F | Warner Financial, Inc | 9 092 | 0 | ||||||
| 2025-08-08 | 13F | Tortoise Investment Management, LLC | 671 | 0,00 | 22 | 15,79 | ||||
| 2025-08-11 | 13F | Anderson Financial Strategies, LLC | 427 257 | 1,61 | 14 211 | 13,57 | ||||
| 2025-08-14 | 13F | CoreCap Advisors, LLC | 138 | 15,97 | 5 | 33,33 | ||||
| 2025-07-09 | 13F | Westmount Partners, LLC | 8 759 | 1,07 | 291 | 13,23 | ||||
| 2025-08-22 | NP | Variable Insurance Products Fund V - FundsManager 70% Portfolio Investor Class | 1 711 137 | −1,34 | 56 912 | 10,26 | ||||
| 2025-08-14 | 13F | Wells Fargo & Company/mn | 1 235 967 | 10 472,86 | 41 108 | 11 746,69 | ||||
| 2025-07-30 | 13F | Bogart Wealth, LLC | 742 | 0,00 | 25 | 9,09 | ||||
| 2025-08-13 | 13F | WCG Wealth Advisors LLC | 21 845 | 3,75 | 727 | 15,97 | ||||
| 2025-08-01 | 13F | Logan Capital Management Inc | 37 | 0,00 | 1 | 0,00 | ||||
| 2025-08-12 | 13F | CIBC Private Wealth Group, LLC | 691 | 1 091,38 | 23 | 2 100,00 | ||||
| 2025-08-14 | 13F | Great Valley Advisor Group, Inc. | 57 844 | 1 924 | ||||||
| 2025-08-08 | 13F | Pinney & Scofield, Inc. | 1 027 | 0,98 | 34 | 13,33 | ||||
| 2025-07-25 | 13F | Cwm, Llc | 16 187 | 12,41 | 1 | |||||
| 2025-08-14 | 13F | Raymond James Financial Inc | 808 782 | 20,17 | 26 900 | 34,31 | ||||
| 2025-08-26 | NP | EVMLX - The E-Valuator Moderate (50%-70%) RMS Fund Service Class Shares | 24 929 | 829 | ||||||
| 2025-07-24 | 13F | IFP Advisors, Inc | 20 418 | 13,97 | 679 | 27,39 | ||||
| 2025-08-14 | 13F | First Commonwealth Financial Corp /pa/ | 129 210 | 19,66 | 4 298 | 33,74 | ||||
| 2025-08-12 | 13F | TCTC Holdings, LLC | 22 477 | 1,07 | 748 | 13,01 | ||||
| 2025-07-10 | 13F | Farmers & Merchants Trust Co of Chambersburg PA | 259 172 | 0,49 | 9 | 14,29 | ||||
| 2025-07-07 | 13F | TruWealth Advisors, LLC | 290 469 | 1 360,16 | 9 661 | 1 531,76 | ||||
| 2025-04-15 | 13F | Noble Wealth Management PBC | 71 579 | 121,31 | 2 130 | 139,33 | ||||
| 2025-07-25 | 13F | Concord Wealth Partners | 579 | 0,87 | 19 | 11,76 | ||||
| 2025-08-05 | 13F | Key FInancial Inc | 112 | 0,00 | 4 | 0,00 | ||||
| 2025-08-14 | 13F | Citadel Advisors Llc | 148 899 | 4 952 | ||||||
| 2025-08-26 | NP | EVGLX - The E-Valuator Growth (70%-85%) RMS Fund Service Class Shares | 69 361 | 2 307 | ||||||
| 2025-08-19 | 13F | Advisory Services Network, LLC | 75 923 | 2 489 | ||||||
| 2025-07-28 | 13F | SFG Wealth Management, LLC. | 0 | −100,00 | 0 | |||||
| 2025-07-17 | 13F | Fifth Third Securities, Inc. | 120 935 | 21,42 | 4 022 | 35,70 | ||||
| 2025-07-18 | 13F | Centricity Wealth Management, LLC | 637 | 0,00 | 21 | 16,67 | ||||
| 2025-07-29 | 13F | Private Trust Co Na | 10 604 | 353 | ||||||
| 2025-08-14 | 13F | Certified Advisory Corp | 152 133 | 5 060 | ||||||
| 2025-07-28 | 13F | CGC Financial Services, LLC | 1 147 411 | 38 163 | ||||||
| 2025-07-17 | 13F | SC&H Financial Advisors, Inc. | 9 194 | 0,52 | 306 | 12,13 | ||||
| 2025-05-09 | 13F | Atria Wealth Solutions, Inc. | 0 | −100,00 | 0 | |||||
| 2025-09-04 | 13F/A | Advisor Group Holdings, Inc. | 665 483 | −17,38 | 22 147 | −7,64 | ||||
| 2025-05-16 | 13F/A | Kestra Investment Management, LLC | 0 | −100,00 | 0 | |||||
| 2025-08-08 | 13F | TD Capital Management LLC | 2 943 | 1,06 | 98 | 12,79 | ||||
| 2025-08-14 | 13F | Mml Investors Services, Llc | 125 472 | 35,80 | 4 | 100,00 | ||||
| 2025-08-05 | 13F | Mission Wealth Management, Lp | 14 933 | −6,76 | 497 | 4,20 | ||||
| 2025-07-22 | 13F | DAVENPORT & Co LLC | 15 500 | 516 | ||||||
| 2025-08-22 | NP | Variable Insurance Products Fund V - FundsManager 20% Portfolio Investor Class | 178 255 | 0,00 | 5 929 | 11,76 | ||||
| 2025-07-29 | 13F | Salus Financial Advisors, LLC | 21 744 | −95,98 | 723 | −95,51 | ||||
| 2025-07-15 | 13F | Lynch & Associates/in | 31 133 | 26,90 | 1 035 | 41,78 | ||||
| 2025-07-24 | 13F | Eastern Bank | 421 | 0,00 | 14 | 16,67 | ||||
| 2025-07-14 | 13F | Painted Porch Advisors LLC | 369 | 0,00 | 12 | 20,00 | ||||
| 2025-08-08 | 13F | New England Capital Financial Advisors LLC | 35 | 94,44 | 1 | |||||
| 2025-07-28 | 13F | Harbour Investments, Inc. | 26 183 | 3,65 | 871 | 15,85 | ||||
| 2025-08-08 | 13F | Hartland & Co., LLC | 17 | 0,00 | 1 | |||||
| 2025-08-08 | 13F | Avantax Advisory Services, Inc. | 70 404 | 19,33 | 2 342 | 33,39 | ||||
| 2025-07-11 | 13F | Farther Finance Advisors, LLC | 1 997 | 51,98 | 66 | 69,23 | ||||
| 2025-07-21 | 13F | Barrett & Company, Inc. | 2 138 | 0,00 | 71 | 12,70 | ||||
| 2025-07-25 | 13F | Stephens Consulting, LLC | 139 631 | 3 260,55 | 4 644 | 3 675,61 | ||||
| 2025-08-14 | 13F | Atomi Financial Group, Inc. | 61 232 | 2 037 | ||||||
| 2025-08-12 | 13F | Barnes Pettey Financial Advisors, Llc | 29 615 | 985 | ||||||
| 2025-08-13 | 13F | Mayfair Advisory Group, LLC | 63 577 | 2 146 | ||||||
| 2025-08-07 | 13F | Resources Investment Advisors, LLC. | 322 512 | 10 727 | ||||||
| 2025-08-13 | 13F | StoneX Group Inc. | 209 193 | −9,46 | 6 958 | 1,18 | ||||
| 2025-08-12 | 13F | Global Retirement Partners, LLC | 6 130 | 131,23 | 204 | 181,94 | ||||
| 2025-07-23 | 13F | Heck Capital Advisors, LLC | 0 | −100,00 | 0 | |||||
| 2025-08-11 | 13F | HighTower Advisors, LLC | 89 038 | 216,60 | 2 961 | 254,19 | ||||
| 2025-08-14 | 13F | Modern Wealth Management, LLC | 12 162 | 1,07 | 405 | 12,85 | ||||
| 2025-05-15 | 13F | EP Wealth Advisors, Inc. | 0 | −100,00 | 0 | −100,00 | ||||
| 2025-08-12 | 13F | MAI Capital Management | 5 768 | 10,35 | 192 | 23,23 | ||||
| 2025-08-11 | 13F | Private Advisor Group, LLC | 18 094 | 602 | ||||||
| 2025-08-12 | 13F | J.w. Cole Advisors, Inc. | 0 | −100,00 | 0 | |||||
| 2025-07-24 | 13F | Williams & Novak, LLC | 14 669 | 93,96 | 488 | 116,44 | ||||
| 2025-08-14 | 13F | Bank Of America Corp /de/ | 20 720 | 2 583,94 | 689 | 3 031,82 | ||||
| 2025-07-10 | 13F | Veridan Wealth LLC | 142 422 | 4 737 | ||||||
| 2025-07-11 | 13F | LongView Wealth Management | 75 845 | 30,65 | 2 523 | 46,03 | ||||
| 2025-07-21 | 13F | DHJJ Financial Advisors, Ltd. | 2 047 | 0,00 | 68 | 13,33 | ||||
| 2025-08-26 | NP | EVTTX - The E-Valuator Conservative/Moderate (30%-50%) RMS Fund Service Class Shares | 8 395 | 279 | ||||||
| 2025-08-08 | 13F | Independence Financial Advisors, LLC | 292 215 | 9 719 | ||||||
| 2025-08-08 | 13F | OmniStar Financial Group, Inc. | 78 026 | 2,94 | 2 595 | 14,92 | ||||
| 2025-07-14 | 13F | Kfg Wealth Management, Llc | 1 048 503 | 7,57 | 34 873 | 20,22 | ||||
| 2025-07-18 | 13F | Childress Capital Advisors, Llc | 6 766 | −0,44 | 225 | 11,39 | ||||
| 2025-07-25 | 13F | Quantum Financial Planning Services, Inc. | 9 882 | 329 | ||||||
| 2025-08-04 | 13F | Assetmark, Inc | 2 924 | 2 065,93 | 97 | 2 325,00 | ||||
| 2025-07-24 | 13F | Us Bancorp \de\ | 1 756 | 0,00 | 58 | 11,54 | ||||
| 2025-07-17 | 13F | Emerald Advisors, LLC | 18 142 | 603 | ||||||
| 2025-04-29 | 13F | Financial Counselors Inc | 0 | −100,00 | 0 | −100,00 | ||||
| 2025-08-05 | 13F | Bank Of Montreal /can/ | 8 418 | 10,08 | 280 | 22,91 | ||||
| 2025-08-12 | 13F | LPL Financial LLC | 1 137 238 | 93,17 | 37 825 | 115,89 | ||||
| 2025-08-13 | 13F | Northwestern Mutual Wealth Management Co | 4 550 323 | 366,53 | 151 344 | 421,40 | ||||
| 2025-08-08 | 13F | Thoroughbred Financial Services, Llc | 17 692 | 97,85 | 1 | |||||
| 2025-08-08 | 13F | Schwarz Dygos Wheeler Investment Advisors Llc | 6 040 | 201 | ||||||
| 2025-07-30 | 13F | Roman Butler Fullerton & Co | 40 054 | 78,73 | 1 356 | 106,39 | ||||
| 2025-07-08 | 13F | Parallel Advisors, LLC | 2 206 | 0,00 | 73 | 12,31 | ||||
| 2025-08-06 | 13F | Forbes Financial Planning, Inc. | 233 435 | 318,93 | 7 764 | 368,28 | ||||
| 2025-08-06 | 13F | Commonwealth Equity Services, Llc | 2 263 280 | 72,98 | 75 | 97,37 | ||||
| 2025-08-22 | NP | Variable Insurance Products Fund V - FundsManager 85% Portfolio Investor Class | 768 866 | −0,85 | 25 572 | 10,81 | ||||
| 2025-08-14 | 13F | Comerica Bank | 546 | 18 | ||||||
| 2025-08-14 | 13F | Ausdal Financial Partners, Inc. | 10 245 | 10,05 | 341 | 22,74 | ||||
| 2025-08-22 | NP | Variable Insurance Products Fund V - Target Volatility Portfolio Service Class | 215 673 | −57,42 | 7 173 | −52,41 | ||||
| 2025-07-30 | 13F | Canvas Wealth Advisors, LLC | 70 159 | 35,51 | 2 336 | 50,81 | ||||
| 2025-08-14 | 13F | Integrated Wealth Concepts LLC | 107 388 | 15,77 | 3 572 | 29,38 | ||||
| 2025-08-18 | 13F | Geneos Wealth Management Inc. | 9 967 | 93,76 | 332 | 116,34 | ||||
| 2025-08-14 | 13F | Investmark Advisory Group LLC | 27 813 | 925 | ||||||
| 2025-08-01 | 13F | Anson Capital, Inc. | 6 680 | 222 | ||||||
| 2025-08-08 | 13F | Wealth Quarterback LLC | 103 147 | 14,02 | 3 431 | 27,41 | ||||
| 2025-08-01 | 13F | Schmidt P J Investment Management Inc | 31 598 | 283,10 | 1 051 | 328,57 | ||||
| 2025-05-12 | 13F | Sandy Spring Bank | 106 | 3 | ||||||
| 2025-08-05 | 13F | Huntington National Bank | 2 433 | 14,71 | ||||||
| 2025-05-14 | 13F | Kayne Anderson Rudnick Investment Management Llc | 0 | −100,00 | 0 | |||||
| 2025-07-30 | 13F | BG Investment Services, Inc. | 67 434 | 63,24 | 2 243 | 82,57 | ||||
| 2025-08-14 | 13F | Mariner, LLC | 109 933 | 6,77 | 3 656 | 19,32 | ||||
| 2025-08-14 | 13F | Royal Bank Of Canada | 133 858 | 719,20 | 4 452 | 816,05 | ||||
| 2025-08-06 | 13F | Atlantic Union Bankshares Corp | 106 | 4 | ||||||
| 2025-07-25 | 13F | Concurrent Investment Advisors, LLC | 315 511 | 539,55 | 10 494 | 614,78 | ||||
| 2025-08-19 | 13F | Asset Dedication, LLC | 2 136 | 10,33 | 71 | 24,56 | ||||
| 2025-07-10 | 13F | Wealth Enhancement Advisory Services, Llc | 48 152 | 205,94 | 1 602 | 242,09 | ||||
| 2025-08-13 | 13F | Lido Advisors, LLC | 27 935 | 97,95 | 929 | 121,19 | ||||
| 2025-07-22 | 13F | Beacon Financial Advisory LLC | 27 266 | 192,05 | 907 | 227,08 | ||||
| 2025-07-15 | 13F | FMA Wealth Management, LLC | 112 170 | 45,44 | 3 731 | 61,96 | ||||
| 2025-08-13 | 13F | VestGen Advisors, LLC | 7 768 | 258 | ||||||
| 2025-07-09 | 13F | Breakwater Capital Group | 39 677 | 10,56 | 1 320 | 23,50 | ||||
| 2025-07-28 | 13F | RFG Advisory, LLC | 249 502 | 8 298 | ||||||
| 2025-08-04 | 13F | Savvy Advisors, Inc. | 6 885 | 229 | ||||||
| 2025-08-26 | NP | EVCLX - The E-Valuator Conservative (15%-30%) RMS Fund Service Class Shares | 3 719 | 124 | ||||||
| 2025-08-08 | 13F | Larson Financial Group LLC | 0 | −100,00 | 0 | |||||
| 2025-07-21 | 13F | Ameriflex Group, Inc. | 2 193 | −38,16 | 72 | −31,43 | ||||
| 2025-08-13 | 13F | Congress Wealth Management LLC / DE / | 343 728 | 208,86 | 11 432 | 245,17 | ||||
| 2025-07-10 | 13F | Signal Advisors Wealth, LLC | 49 852 | 1 658 | ||||||
| 2025-08-15 | 13F | Morgan Stanley | 8 630 | −15,54 | 287 | −5,59 | ||||
| 2025-07-24 | 13F | Bryant Woods Investment Advisors, LLC | 187 793 | 44,85 | 6 246 | 61,87 | ||||
| 2025-08-07 | 13F | PFG Advisors | 104 370 | 168,12 | 3 471 | 199,74 | ||||
| 2025-08-14 | 13F | Core Wealth Advisors, Inc. | 516 768 | 0,41 | 17 188 | 12,22 | ||||
| 2025-08-15 | 13F | Equitable Holdings, Inc. | 33 001 | 43,08 | 1 098 | 59,91 | ||||
| 2025-08-06 | 13F | AE Wealth Management LLC | 1 451 | −40,44 | 48 | −33,33 | ||||
| 2025-07-14 | 13F | AdvisorNet Financial, Inc | 711 | 0,00 | 24 | 9,52 | ||||
| 2025-08-26 | NP | EVAGX - The E-Valuator Aggressive Growth (85%-99%) RMS Fund Service Class Shares | 86 354 | 2 872 | ||||||
| 2025-07-23 | 13F | InTrack Investment Management Inc | 160 904 | 366,90 | 5 352 | 422,05 | ||||
| 2025-08-15 | 13F | Northeast Financial Consultants Inc | 15 399 | 512 | ||||||
| 2025-08-22 | NP | Variable Insurance Products Fund V - FundsManager 40% Portfolio Service Class | 4 142 | 2,55 | 138 | 14,17 | ||||
| 2025-08-14 | 13F | LaSalle St. Investment Advisors, LLC | 11 155 | −5,20 | 0 | |||||
| 2025-07-29 | 13F | Tradewinds Capital Management, LLC | 88 | 0,00 | 3 | 0,00 | ||||
| 2025-08-11 | 13F | Principal Securities, Inc. | 84 375 | 401,07 | 2 806 | 506,05 | ||||
| 2025-08-14 | 13F | Qube Research & Technologies Ltd | 0 | −100,00 | 0 | |||||
| 2025-07-18 | 13F | Vicus Capital | 97 483 | 2,01 | 3 242 | 13,99 | ||||
| 2025-05-07 | 13F | Evermay Wealth Management Llc | 0 | −100,00 | 0 | −100,00 | ||||
| 2025-08-12 | 13F | Coston, McIsaac & Partners | 342 | 0 | ||||||
| 2025-07-09 | 13F | Pallas Capital Advisors LLC | 859 169 | 60,58 | 28 576 | 79,46 | ||||
| 2025-07-10 | 13F | Sovran Advisors, LLC | 6 273 | 208 | ||||||
| 2025-07-01 | 13F | Harbor Investment Advisory, Llc | 1 212 | −48,12 | 40 | −42,03 | ||||
| 2025-07-18 | 13F | PFG Investments, LLC | 10 433 | 16,30 | 347 | 30,08 | ||||
| 2025-07-16 | 13F | Evergreen Private Wealth LLC | 17 104 | −5,93 | 569 | 4,99 | ||||
| 2025-08-13 | 13F | Flow Traders U.s. Llc | 59 401 | 2 | ||||||
| 2025-08-14 | 13F | Williams Jones Wealth Management, LLC. | 9 664 | 321 | ||||||
| 2025-07-31 | 13F | Glass Jacobson Investment Advisors llc | 3 398 | 1,74 | 113 | 24,18 | ||||
| 2025-08-13 | 13F | EverSource Wealth Advisors, LLC | 384 | 0,00 | 13 | 9,09 |