Grundläggande statistik
| Institutionella ägare | 127 total, 123 long only, 1 short only, 3 long/short - change of 2,40% MRQ |
| Genomsnittlig portföljallokering | 0.2810 % - change of 7,24% MRQ |
| Institutionella aktier (lång) | 16 862 291 (ex 13D/G) - change of 0,51MM shares 3,09% MRQ |
| Institutionellt värde (lång) | $ 299 577 USD ($1000) |
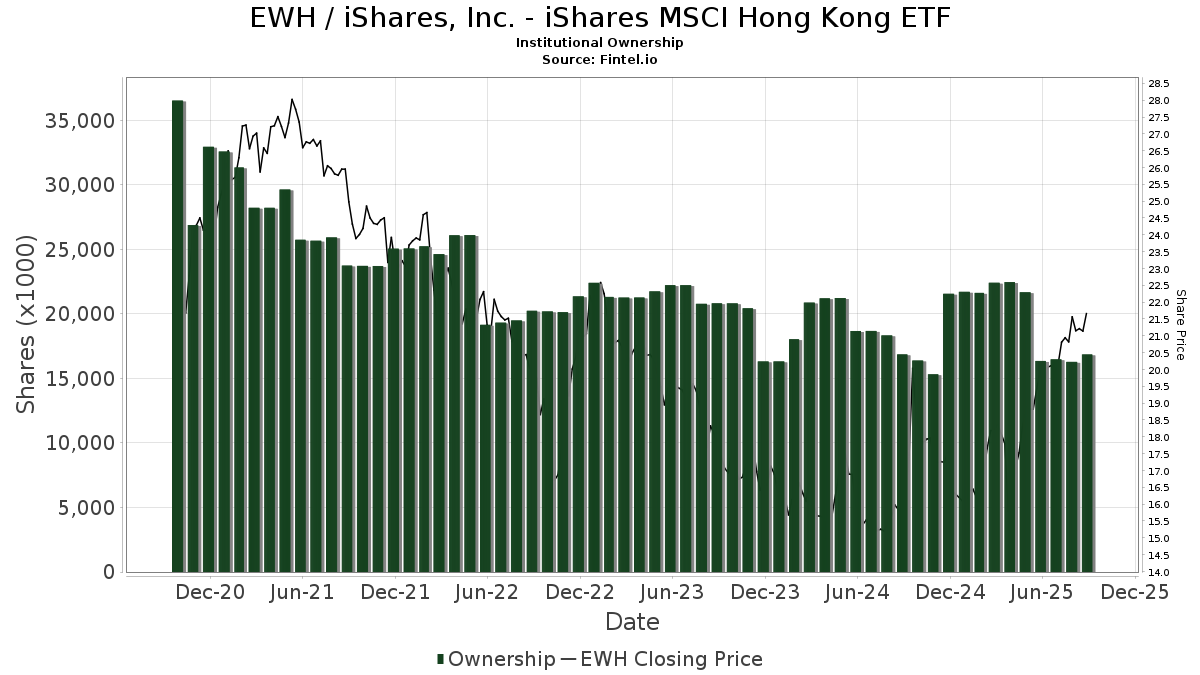
Institutionellt ägande och aktieägare
iShares, Inc. - iShares MSCI Hong Kong ETF (US:EWH) har 127 Institutionella ägare och aktieägare som har lämnat in 13D/G- eller 13F-formulär till Securities Exchange Commission (SEC). Dessa institut innehar totalt 16,862,291 aktier. Största aktieägare inkluderar Wright Fund Managment, LLC, Morgan Stanley, Bank Julius Baer & Co. Ltd, Zurich, SG Americas Securities, LLC, D. E. Shaw & Co., Inc., Catalyst Capital Advisors LLC, MBXAX - Catalyst/Millburn Hedge Strategy Fund Class A, Millburn Ridgefield Corp, Northern Lights Fund Trust - Sierra Tactical Risk Spectrum 50 Fund Investor Class, and Quadrature Capital Ltd .
iShares, Inc. - iShares MSCI Hong Kong ETF (ARCA:EWH) Institutionell ägarstruktur visar institutioners och fonders nuvarande positioner i företaget, samt de senaste förändringarna i positionernas storlek. Större aktieägare kan vara enskilda investerare, fonder, hedgefonder eller institutioner. Bilaga 13D visar att investeraren äger (eller ägde) mer än 5% av företaget och avser (eller avsåg) att aktivt eftersträva en förändring av affärsstrategin. Schedule 13G indikerar en passiv investering på över 5%.
The share price as of September 9, 2025 is 21,56 / share. Previously, on September 10, 2024, the share price was 15,72 / share. This represents an increase of 37,15% over that period.
Fondsentimentets poäng
Fondsentimentet poängen(fka Ägarackumulation-poäng) visar vilka aktier som är mest köpta av fonder. Det är resultatet av en sofistikerad kvantitativ flerfaktormodell som identifierar företag med de högsta nivåerna av institutionell ackumulering. Poängsättningsmodellen använder en kombination av den totala ökningen av redovisade ägare, förändringarna i portföljallokeringarna för dessa ägare och andra mått. Siffran sträcker sig från 0 till 100, där högre siffror indikerar en högre nivå av ackumulering i förhållande till sina konkurrenter, och 50 är genomsnittet.
Uppdateringsfrekvens: Dagligen
Se Ownership Explorer, som innehåller en lista över de högst rankade företagen.
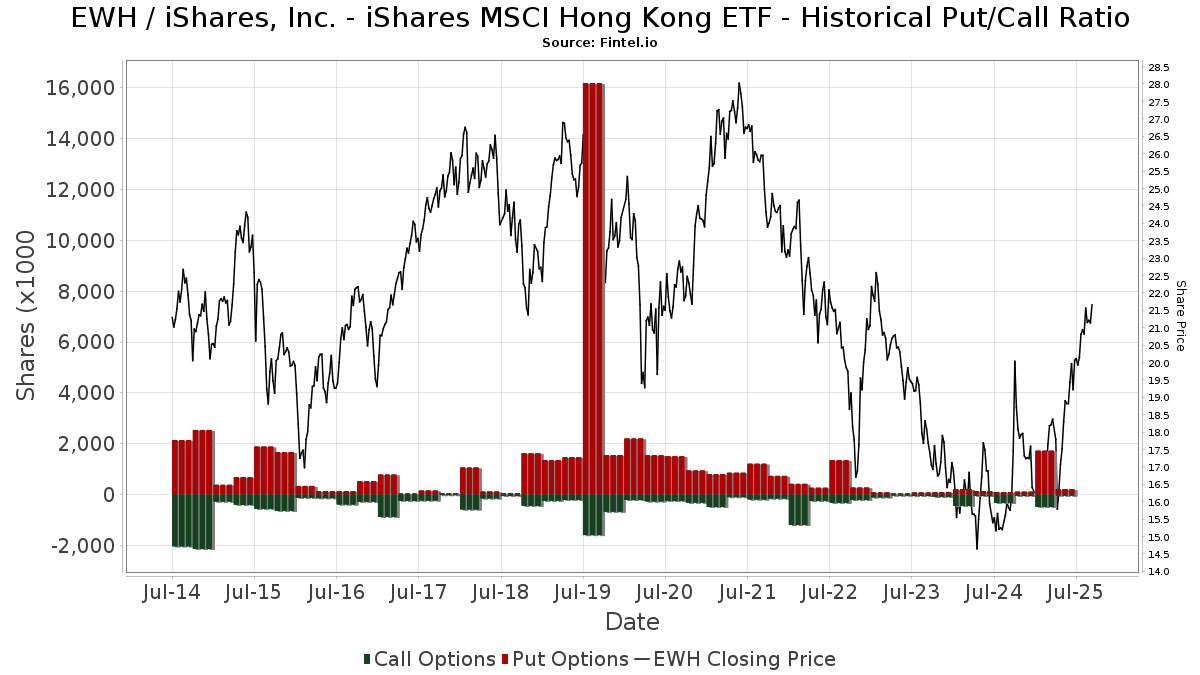
Institutionell sälj/köp-kvot
Förutom att rapportera vanliga eget kapital- och skuldemissioner måste institutioner med mer än 100MM tillgångar under förvaltning också avslöja sina innehav av sälj- och köpoptioner. Eftersom säljoptioner i allmänhet indikerar ett negativt sentiment och köpoptioner indikerar ett positivt sentiment, kan vi få en uppfattning om det övergripande institutionella sentimentet genom att plotta förhållandet mellan säljoptioner och köpoptioner. Diagrammet till höger visar det historiska förhållandet mellan sälj- och köpoptioner för detta instrument.
Genom att använda sälj/köp-kvoten som en indikator på aktieägarnas sentiment undviker man en av de största bristerna med att använda det totala institutionella ägandet, nämligen att en betydande del av de förvaltade tillgångarna investeras passivt för att följa index. Passivt förvaltade fonder köper vanligtvis inte optioner, så indikatorn för sälj/köp-kvoten ger en bättre bild av stämningen i aktivt förvaltade fonder.
13F- och NPORT-arkiveringar
Detaljer om 13F-arkiveringar är gratis. Detaljer om NP-arkiveringar kräver ett premiummedlemskap. Gröna rader indikerar nya positioner. Röda rader indikerar stängda positioner. Klicka på länk symbolen för att se hela transaktionshistoriken.
Uppgradera
för att låsa upp premiumdata och exportera till Excel ![]() .
.
| Fil Datum | Källa | Investerare | Typ | Genomsnittligt pris (beräknat) |
Aktier | Δ Aktier (%) |
Rapporterat värde (1000 USD) |
Δ Värde (%) |
Portföljallokering (%) |
|
|---|---|---|---|---|---|---|---|---|---|---|
| 2025-08-12 | 13F | MAI Capital Management | 208 | 1,96 | 4 | 33,33 | ||||
| 2025-07-08 | 13F | Parallel Advisors, LLC | 500 | 0,00 | 10 | 12,50 | ||||
| 2025-08-14 | 13F | SummitTX Capital, L.P. | 11 200 | 222 | ||||||
| 2025-08-14 | 13F | Wellington Management Group Llp | 54 028 | 243,62 | 1 073 | 289,82 | ||||
| 2025-08-13 | 13F | Barclays Plc | Put | 0 | −100,00 | 0 | ||||
| 2025-07-23 | 13F | Viewpoint Capital Management LLC | 6 241 | 0,00 | 124 | 12,84 | ||||
| 2025-08-14 | 13F | Ameriprise Financial Inc | 76 862 | −60,42 | 4 229 | 24,38 | ||||
| 2025-04-16 | 13F | Wealth Enhancement Advisory Services, Llc | Put | 0 | −100,00 | 0 | ||||
| 2025-08-12 | 13F | Zacks Investment Management | 21 664 | 430 | ||||||
| 2025-08-11 | 13F | Rahlfs Capital, Llc | 11 050 | 219 | ||||||
| 2025-07-10 | 13F | Wealth Enhancement Advisory Services, Llc | 15 937 | 0,31 | 321 | 15,47 | ||||
| 2025-08-14 | 13F | Fmr Llc | 5 916 | 8,91 | 117 | 23,16 | ||||
| 2025-08-13 | 13F | Scotia Capital Inc. | 16 352 | 325 | ||||||
| 2025-08-14 | 13F | Quantitative Investment Management, LLC | 59 004 | 1 | ||||||
| 2025-08-04 | 13F | JDM Financial Group LLC | 550 | 0,00 | 11 | 11,11 | ||||
| 2025-08-06 | 13F | Pekin Hardy Strauss, Inc. | 0 | −100,00 | 0 | |||||
| 2025-03-26 | NP | MNERX - MainStay Conservative ETF Allocation Fund Class R3 | 61 191 | 9,50 | 1 010 | 1,10 | ||||
| 2025-05-29 | NP | Northern Lights Fund Trust - Sierra Tactical Risk Spectrum 70 Fund Investor Class | 152 100 | 2 663 | ||||||
| 2025-08-13 | 13F | Korea Investment CORP | 132 000 | 0,00 | 2 622 | 13,41 | ||||
| 2025-07-21 | 13F | J. Safra Sarasin Holding AG | 0 | −100,00 | 0 | |||||
| 2025-07-31 | 13F | Wright Fund Managment, LLC | 1 407 375 | 0,00 | 24 643 | 0,00 | ||||
| 2025-08-12 | 13F | Elo Mutual Pension Insurance Co | 504 498 | 0,00 | 10 019 | 13,43 | ||||
| 2025-08-05 | 13F | Huntington National Bank | 0 | |||||||
| 2025-05-29 | NP | SIRAX - Sierra Tactical All Asset Fund Class A | 517 500 | 9 061 | ||||||
| 2025-07-29 | 13F | Tradewinds Capital Management, LLC | 102 | 0,00 | 2 | 100,00 | ||||
| 2025-07-31 | 13F | Glass Jacobson Investment Advisors llc | 1 925 | 0,00 | 38 | 18,75 | ||||
| 2025-08-14 | 13F/A | Bank Julius Baer & Co. Ltd, Zurich | 1 210 055 | 24 032 | ||||||
| 2025-07-22 | 13F | Chung Wu Investment Group, LLC | 8 500 | 169 | ||||||
| 2025-07-08 | 13F/A | Salem Investment Counselors Inc | 400 | 0,00 | 8 | 0,00 | ||||
| 2025-07-31 | 13F | Sharper & Granite LLC | 82 575 | −1,19 | 1 661 | 13,47 | ||||
| 2025-08-05 | 13F | Advisors Preferred, LLC | 1 411 | 28 | ||||||
| 2025-05-14 | 13F | Flow Traders U.s. Llc | 0 | −100,00 | 0 | |||||
| 2025-08-12 | 13F | CIBC Private Wealth Group, LLC | 0 | −100,00 | 0 | |||||
| 2025-08-14 | 13F | Federation des caisses Desjardins du Quebec | 144 176 | 3 780,92 | 2 863 | 4 373,44 | ||||
| 2025-08-13 | 13F | Mount Yale Investment Advisors, LLC | 138 | 3 | ||||||
| 2025-03-26 | NP | MWFQX - MainStay Equity ETF Allocation Fund Class R3 | 129 177 | 14,38 | 2 131 | 5,60 | ||||
| 2025-05-13 | 13F | HighTower Advisors, LLC | 0 | −100,00 | 0 | |||||
| 2025-05-02 | 13F | Whittier Trust Co | 0 | −100,00 | 0 | |||||
| 2025-08-14 | 13F | UBS Group AG | 428 667 | −45,34 | 8 513 | −38,01 | ||||
| 2025-07-07 | 13F | Upper Left Wealth Management, LLC | 14 066 | 2,55 | 279 | 16,25 | ||||
| 2025-04-22 | 13F | Cambridge Investment Research Advisors, Inc. | 0 | −100,00 | 0 | |||||
| 2025-07-30 | 13F | Exencial Wealth Advisors, Llc | 46 936 | 6,80 | 932 | 21,20 | ||||
| 2025-08-13 | 13F | Provida Pension Fund Administrator | 0 | −100,00 | 0 | −100,00 | ||||
| 2025-07-31 | 13F | Catalyst Capital Advisors LLC | 646 987 | −12,03 | 12 849 | −0,23 | ||||
| 2025-08-29 | NP | MBXAX - Catalyst/Millburn Hedge Strategy Fund Class A | 646 987 | −12,03 | 12 849 | −0,23 | ||||
| 2025-08-29 | NP | CGHIX - Timber Point Global Allocations Fund Institutional Class Shares | 10 000 | −50,00 | 199 | −43,43 | ||||
| 2025-08-15 | 13F | Morgan Stanley | 1 212 315 | −14,04 | 24 077 | −2,51 | ||||
| 2025-08-12 | 13F | Picton Mahoney Asset Management | 5 970 | −21,24 | 0 | |||||
| 2025-08-14 | 13F | Royal Bank Of Canada | 117 644 | 85,41 | 2 335 | 110,17 | ||||
| 2025-07-31 | 13F | United Community Bank | 0 | −100,00 | 0 | |||||
| 2025-08-12 | 13F | BlackRock, Inc. | 42 251 | −95,07 | 839 | −94,41 | ||||
| 2025-08-13 | 13F | Hsbc Holdings Plc | 12 720 | −4,68 | 253 | 8,15 | ||||
| 2025-08-13 | 13F | National Bank Of Canada /fi/ | 0 | −100,00 | 0 | |||||
| 2025-08-12 | 13F | LPL Financial LLC | 30 307 | −55,28 | 602 | −49,33 | ||||
| 2025-08-14 | 13F | Kovitz Investment Group Partners, LLC | 94 548 | 62,56 | 1 878 | 84,38 | ||||
| 2025-06-26 | NP | SSXU - Day Hagan/Ned Davis Research Smart Sector International ETF | 128 246 | 2 247 | ||||||
| 2025-07-11 | 13F | Farther Finance Advisors, LLC | 3 600 | 0,00 | 71 | 12,70 | ||||
| 2025-09-04 | 13F/A | Advisor Group Holdings, Inc. | 16 234 | 20,02 | 323 | 36,44 | ||||
| 2025-04-22 | 13F | Moisand Fitzgerald Tamayo, LLC | 0 | −100,00 | 0 | |||||
| 2025-08-12 | 13F | Prudential Plc | 199 443 | 3 961 | ||||||
| 2025-08-13 | 13F | Walleye Trading LLC | Put | 0 | −100,00 | 0 | ||||
| 2025-08-14 | 13F | D. E. Shaw & Co., Inc. | 742 520 | 284,26 | 14 746 | 335,89 | ||||
| 2025-08-08 | 13F | Larson Financial Group LLC | 0 | −100,00 | 0 | |||||
| 2025-08-11 | 13F | Aptus Capital Advisors, LLC | 268 | 5 | ||||||
| 2025-08-13 | 13F | Jones Financial Companies Lllp | 214 | −38,86 | 4 | −33,33 | ||||
| 2025-08-13 | 13F | Quadrature Capital Ltd | 564 759 | −13,02 | 11 219 | −1,39 | ||||
| 2025-08-14 | 13F | Prelude Capital Management, Llc | 0 | −100,00 | 0 | |||||
| 2025-08-14 | 13F | Citadel Advisors Llc | Put | 20 400 | 29,94 | 405 | 47,81 | |||
| 2025-05-08 | 13F | New York Life Investment Management Llc | 0 | −100,00 | 0 | |||||
| 2025-07-24 | 13F | Blair William & Co/il | 2 896 | −22,21 | 58 | −12,31 | ||||
| 2025-07-21 | 13F | Mirae Asset Global Investments Co., Ltd. | 27 834 | 316,74 | 553 | 371,79 | ||||
| 2025-07-10 | 13F | Contravisory Investment Management, Inc. | 25 720 | 511 | ||||||
| 2025-08-14 | 13F | Citadel Advisors Llc | Call | 16 800 | −93,32 | 334 | −92,44 | |||
| 2025-08-14 | 13F | Susquehanna International Group, Llp | Call | 0 | −100,00 | 0 | ||||
| 2025-08-28 | NP | TFAFX - Tactical Growth Allocation Fund Class I | 1 600 | 32 | ||||||
| 2025-08-05 | 13F | Harel Insurance Investments & Financial Services Ltd. | 5 000 | 108,33 | 0 | |||||
| 2025-08-14 | 13F | Raymond James Financial Inc | 322 199 | −16,08 | 6 399 | −4,82 | ||||
| 2025-07-16 | 13F | Banque Pictet & Cie Sa | 215 913 | 0,00 | 4 288 | 13,44 | ||||
| 2025-07-28 | 13F | Harbour Investments, Inc. | 556 | 0,00 | 11 | 22,22 | ||||
| 2025-08-06 | 13F | Golden State Wealth Management, LLC | 115 | 0,00 | 2 | 0,00 | ||||
| 2025-05-14 | 13F | Walleye Trading LLC | 0 | −100,00 | 0 | −100,00 | ||||
| 2025-08-12 | 13F | O'shaughnessy Asset Management, Llc | 220 | −37,85 | 4 | −33,33 | ||||
| 2025-08-06 | 13F | Commonwealth Equity Services, Llc | 26 525 | 12,75 | 1 | |||||
| 2025-08-08 | 13F | Foundations Investment Advisors, LLC | 0 | −100,00 | 0 | |||||
| 2025-06-26 | NP | BlackRock ETF Trust - iShares International Country Rotation Active ETF | 2 415 | −27,24 | 42 | −22,22 | ||||
| 2025-08-14 | 13F | CIBC World Markets Inc. | 476 469 | −1,35 | 9 463 | 11,88 | ||||
| 2025-08-28 | NP | ICCIX - Dynamic International Opportunity Fund Class I | 29 101 | −19,19 | 578 | −8,41 | ||||
| 2025-08-13 | 13F | Invesco Ltd. | 10 233 | −7,18 | 203 | 5,18 | ||||
| 2025-04-25 | 13F | Mmbg Investment Advisors Co. | 0 | −100,00 | 0 | |||||
| 2025-03-26 | NP | MDAKX - MainStay Moderate ETF Allocation Fund Class C | 194 616 | 11,09 | 3 211 | 2,59 | ||||
| 2025-08-18 | 13F | Wolverine Trading, Llc | Call | 0 | −100,00 | 0 | ||||
| 2025-07-23 | 13F | Vontobel Holding Ltd. | 333 736 | −1,18 | 6 628 | 12,08 | ||||
| 2025-07-28 | 13F | Twin Tree Management, LP | 0 | −100,00 | 0 | |||||
| 2025-08-06 | 13F | Texas Yale Capital Corp. | 0 | −100,00 | 0 | |||||
| 2025-08-12 | 13F | Rhumbline Advisers | 1 431 | 0,00 | 28 | 12,00 | ||||
| 2025-08-13 | 13F | Taikang Asset Management (Hong Kong) Co Ltd | 55 029 | 0,00 | 1 093 | 13,40 | ||||
| 2025-08-13 | 13F | Capital Fund Management S.a. | 33 788 | 49,29 | 671 | 69,44 | ||||
| 2025-08-05 | 13F | Sigma Planning Corp | 24 004 | 33,87 | 477 | 52,08 | ||||
| 2025-05-15 | 13F | Optiver Holding B.V. | 0 | −100,00 | 0 | −100,00 | ||||
| 2025-08-14 | 13F | Glen Eagle Advisors, LLC | 58 | 1 | ||||||
| 2025-08-11 | 13F | TD Waterhouse Canada Inc. | 1 455 | 0,00 | 29 | 12,00 | ||||
| 2025-08-12 | 13F | Steward Partners Investment Advisory, Llc | 616 | 0,00 | 12 | 20,00 | ||||
| 2025-07-22 | 13F | 4Thought Financial Group Inc. | 184 | 3,37 | 4 | 0,00 | ||||
| 2025-08-08 | 13F | Creative Planning | 10 553 | −0,01 | 210 | 13,59 | ||||
| 2025-08-14 | 13F | Susquehanna International Group, Llp | Put | 10 100 | −79,72 | 201 | −77,04 | |||
| 2025-08-05 | 13F | Castlekeep Investment Advisors Llc | 20 757 | −3,42 | 412 | 9,57 | ||||
| 2025-08-14 | 13F | Susquehanna International Group, Llp | 12 229 | −92,56 | 243 | −91,59 | ||||
| 2025-08-14 | 13F | Tudor Investment Corp Et Al | 0 | −100,00 | 0 | |||||
| 2025-08-13 | 13F | Capital Fund Management S.a. | Call | 14 400 | −54,29 | 286 | −48,28 | |||
| 2025-05-15 | 13F | Dai-ichi Life Holdings, Inc. | 0 | −100,00 | 0 | |||||
| 2025-08-14 | 13F | Hrt Financial Lp | 179 958 | 4 | ||||||
| 2025-08-08 | 13F | SG Americas Securities, LLC | 1 195 271 | 738,32 | 24 | 1 050,00 | ||||
| 2025-08-13 | 13F | Marshall Wace, Llp | 43 000 | 854 | ||||||
| 2025-07-14 | 13F | Legacy Capital Group California, Inc. | 25 470 | 506 | ||||||
| 2025-08-14 | 13F | Bnp Paribas Arbitrage, Sa | 63 032 | −49,05 | 1 252 | −42,24 | ||||
| 2025-08-11 | 13F | Covestor Ltd | 7 | 0,00 | 0 | |||||
| 2025-08-14 | 13F | Evergreen Capital Management Llc | 124 720 | 6,09 | 2 477 | 20,31 | ||||
| 2025-08-06 | 13F | Prospera Financial Services Inc | 0 | −100,00 | 0 | |||||
| 2025-08-12 | 13F | Barings Llc | 208 539 | −8,67 | 4 142 | 3,58 | ||||
| 2025-07-29 | 13F | Millburn Ridgefield Corp | 646 987 | −12,03 | 12 849 | −0,23 | ||||
| 2025-08-13 | 13F | Baker Avenue Asset Management, LP | Put | 150 000 | −55,88 | 8 | −97,92 | |||
| 2025-05-07 | 13F | Drive Wealth Management, Llc | 0 | −100,00 | 0 | |||||
| 2025-08-14 | 13F | Citadel Advisors Llc | 0 | −100,00 | 0 | |||||
| 2025-08-05 | 13F | Bank Of Montreal /can/ | 81 957 | 0,28 | 1 628 | 13,70 | ||||
| 2025-08-13 | 13F | Cresset Asset Management, LLC | 29 020 | 8,78 | 576 | 23,34 | ||||
| 2025-08-06 | 13F | Innealta Capital, Llc | 29 101 | −19,19 | 578 | −8,41 | ||||
| 2025-08-14 | 13F | Jane Street Group, Llc | 544 097 | −22,59 | 10 806 | −12,21 | ||||
| 2025-08-14 | 13F | Gotham Asset Management, LLC | 10 426 | 0,00 | 207 | 13,74 | ||||
| 2025-08-13 | 13F | Idaho Trust Bank | 29 514 | 25,87 | 586 | 42,93 | ||||
| 2025-08-14 | 13F | Group One Trading, L.p. | 9 036 | 179 | ||||||
| 2025-08-27 | 13F/A | Squarepoint Ops LLC | 48 311 | 29,52 | 959 | 46,86 | ||||
| 2025-08-14 | 13F | Old Mission Capital Llc | 0 | −100,00 | 0 | |||||
| 2025-08-15 | 13F | Tower Research Capital LLC (TRC) | 1 837 | −37,81 | 36 | −41,94 | ||||
| 2025-08-12 | 13F | Jpmorgan Chase & Co | 192 022 | −3,68 | 3 814 | 9,26 | ||||
| 2025-07-31 | 13F | GenTrust, LLC | 20 561 | 6,03 | 408 | 20,35 | ||||
| 2025-08-14 | 13F | Comerica Bank | 1 112 | 11,87 | 22 | 29,41 | ||||
| 2025-08-05 | 13F | Tsfg, Llc | 500 | 0,00 | 0 | |||||
| 2025-08-12 | 13F | Proequities, Inc. | 0 | 0 | ||||||
| 2025-08-13 | 13F | Walleye Trading LLC | Call | 0 | −100,00 | 0 | ||||
| 2025-08-08 | 13F | Abc Arbitrage Sa | 17 827 | −80,52 | 354 | −77,90 | ||||
| 2025-07-29 | NP | HFND - Unlimited HFND Multi-Strategy Return Tracker ETF | 2 959 | 866,99 | 56 | 1 020,00 | ||||
| 2025-08-14 | 13F | Qube Research & Technologies Ltd | 927 | −98,35 | 18 | −98,17 | ||||
| 2025-07-17 | 13F | Albion Financial Group /ut | 63 000 | 0,00 | 1 251 | 13,42 | ||||
| 2025-08-13 | 13F | Renaissance Technologies Llc | 434 900 | 76,22 | 8 637 | 99,88 | ||||
| 2025-08-11 | 13F | Citigroup Inc | 26 239 | −72,07 | 521 | −68,33 | ||||
| 2025-07-18 | 13F | USA Financial Portformulas Corp | 7 706 | −38,75 | 153 | −30,45 | ||||
| 2025-08-11 | 13F | Principal Securities, Inc. | 29 | 1 | ||||||
| 2025-03-26 | NP | MOEAX - MainStay Growth ETF Allocation Fund Class A | 163 359 | 11,17 | 2 695 | 2,67 | ||||
| 2025-08-05 | 13F | Gould Asset Management Llc /ca/ | 39 511 | −3,26 | 785 | 9,65 | ||||
| 2025-08-07 | 13F | Allworth Financial LP | 20 | 0,00 | 0 | |||||
| 2025-08-14 | 13F | Two Sigma Securities, Llc | 17 106 | −68,19 | 340 | −63,97 | ||||
| 2025-05-29 | NP | Northern Lights Fund Trust - Sierra Tactical Core Growth Fund Investor Class Shares | 26 075 | 457 | ||||||
| 2025-05-29 | NP | Northern Lights Fund Trust - Sierra Tactical Risk Spectrum 50 Fund Investor Class | 568 800 | 9 960 | ||||||
| 2025-08-14 | 13F | Jane Street Group, Llc | Put | 33 500 | 665 | |||||
| 2025-07-24 | 13F | Cyndeo Wealth Partners, LLC | 15 626 | −2,78 | 310 | 10,32 | ||||
| 2025-08-14 | 13F | Wells Fargo & Company/mn | 165 021 | 382,84 | 3 277 | 447,99 | ||||
| 2025-05-15 | 13F | Barclays Plc | 0 | −100,00 | 0 | |||||
| 2025-08-14 | 13F | Integrated Wealth Concepts LLC | 54 406 | −41,23 | 1 080 | −33,33 | ||||
| 2025-05-01 | 13F | Cwm, Llc | 0 | −100,00 | 0 | |||||
| 2025-08-12 | 13F | BlackRock, Inc. | Put | 0 | −100,00 | 0 | −100,00 | |||
| 2025-08-14 | 13F | Horizon Investments, LLC | 27 | 107,69 | 1 | |||||
| 2025-08-14 | 13F | Goldman Sachs Group Inc | 87 564 | −46,51 | 1 739 | −39,32 | ||||
| 2025-05-29 | NP | Northern Lights Fund Trust - Sierra Tactical Risk Spectrum 30 Fund Instl Class | 142 900 | 2 502 | ||||||
| 2025-08-08 | NP | QALTX - Quantified Alternative Investment Fund Investor Class Shares | 1 411 | 28 | ||||||
| 2025-08-13 | 13F | Amundi | 23 414 | 7,90 | 471 | 24,01 | ||||
| 2025-08-12 | 13F | Atlas Capital Advisors Llc | 0 | −100,00 | 0 | |||||
| 2025-08-14 | 13F | Bank Of America Corp /de/ | 70 005 | −21,62 | 1 390 | −11,07 | ||||
| 2025-08-12 | 13F | XTX Topco Ltd | 15 828 | 314 | ||||||
| 2025-08-14 | 13F | Headlands Technologies LLC | 0 | −100,00 | 0 | −100,00 | ||||
| 2025-04-28 | 13F | Pictet North America Advisors SA | 0 | −100,00 | 0 | |||||
| 2025-07-16 | 13F/A | CX Institutional | 584 | −32,56 | 0 | |||||
| 2025-05-15 | 13F | Crestline Management, LP | 0 | −100,00 | 0 |