Grundläggande statistik
| Institutionella ägare | 141 total, 141 long only, 0 short only, 0 long/short - change of −3,42% MRQ |
| Genomsnittlig portföljallokering | 0.1721 % - change of −9,14% MRQ |
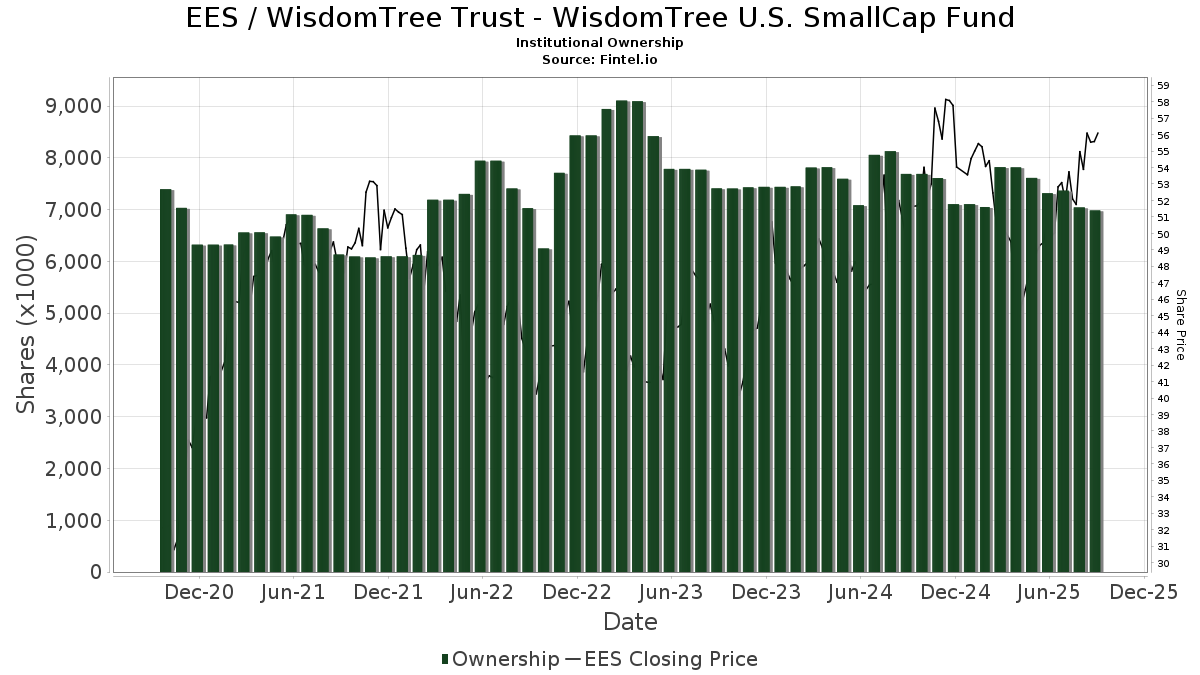
| Institutionella aktier (lång) | 6 986 679 (ex 13D/G) - change of −0,33MM shares −4,55% MRQ |
| Institutionellt värde (lång) | $ 335 745 USD ($1000) |
Institutionellt ägande och aktieägare
WisdomTree Trust - WisdomTree U.S. SmallCap Fund (US:EES) har 141 Institutionella ägare och aktieägare som har lämnat in 13D/G- eller 13F-formulär till Securities Exchange Commission (SEC). Dessa institut innehar totalt 6,986,679 aktier. Största aktieägare inkluderar Bank Of America Corp /de/, Morgan Stanley, UBS Group AG, LPL Financial LLC, Ameriprise Financial Inc, Cetera Investment Advisers, Shore Point Advisors, LLC, Key FInancial Inc, Savant Capital, LLC, and Laurel Wealth Advisors LLC .
WisdomTree Trust - WisdomTree U.S. SmallCap Fund (ARCA:EES) Institutionell ägarstruktur visar institutioners och fonders nuvarande positioner i företaget, samt de senaste förändringarna i positionernas storlek. Större aktieägare kan vara enskilda investerare, fonder, hedgefonder eller institutioner. Bilaga 13D visar att investeraren äger (eller ägde) mer än 5% av företaget och avser (eller avsåg) att aktivt eftersträva en förändring av affärsstrategin. Schedule 13G indikerar en passiv investering på över 5%.
The share price as of September 10, 2025 is 55,58 / share. Previously, on September 11, 2024, the share price was 49,75 / share. This represents an increase of 11,72% over that period.
Fondsentimentets poäng
Fondsentimentet poängen(fka Ägarackumulation-poäng) visar vilka aktier som är mest köpta av fonder. Det är resultatet av en sofistikerad kvantitativ flerfaktormodell som identifierar företag med de högsta nivåerna av institutionell ackumulering. Poängsättningsmodellen använder en kombination av den totala ökningen av redovisade ägare, förändringarna i portföljallokeringarna för dessa ägare och andra mått. Siffran sträcker sig från 0 till 100, där högre siffror indikerar en högre nivå av ackumulering i förhållande till sina konkurrenter, och 50 är genomsnittet.
Uppdateringsfrekvens: Dagligen
Se Ownership Explorer, som innehåller en lista över de högst rankade företagen.
Institutionell sälj/köp-kvot
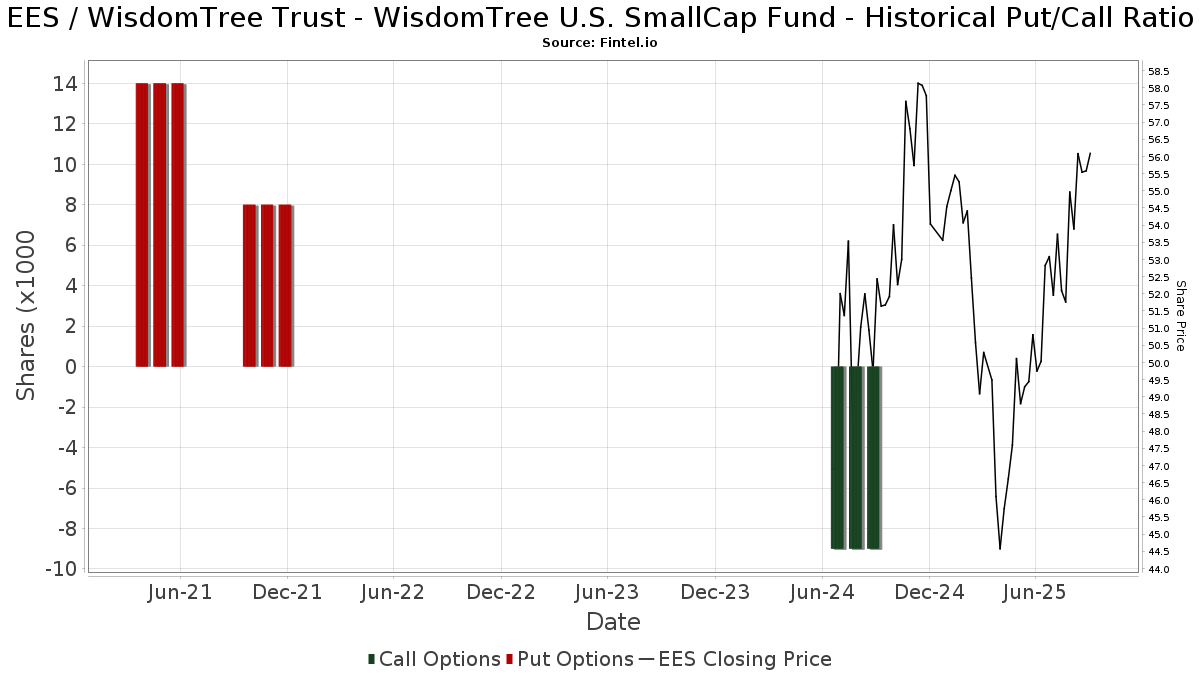
Förutom att rapportera vanliga eget kapital- och skuldemissioner måste institutioner med mer än 100MM tillgångar under förvaltning också avslöja sina innehav av sälj- och köpoptioner. Eftersom säljoptioner i allmänhet indikerar ett negativt sentiment och köpoptioner indikerar ett positivt sentiment, kan vi få en uppfattning om det övergripande institutionella sentimentet genom att plotta förhållandet mellan säljoptioner och köpoptioner. Diagrammet till höger visar det historiska förhållandet mellan sälj- och köpoptioner för detta instrument.
Genom att använda sälj/köp-kvoten som en indikator på aktieägarnas sentiment undviker man en av de största bristerna med att använda det totala institutionella ägandet, nämligen att en betydande del av de förvaltade tillgångarna investeras passivt för att följa index. Passivt förvaltade fonder köper vanligtvis inte optioner, så indikatorn för sälj/köp-kvoten ger en bättre bild av stämningen i aktivt förvaltade fonder.
13F- och NPORT-arkiveringar
Detaljer om 13F-arkiveringar är gratis. Detaljer om NP-arkiveringar kräver ett premiummedlemskap. Gröna rader indikerar nya positioner. Röda rader indikerar stängda positioner. Klicka på länk symbolen för att se hela transaktionshistoriken.
Uppgradera
för att låsa upp premiumdata och exportera till Excel ![]() .
.
| Fil Datum | Källa | Investerare | Typ | Genomsnittligt pris (beräknat) |
Aktier | Δ Aktier (%) |
Rapporterat värde (1000 USD) |
Δ Värde (%) |
Portföljallokering (%) |
|
|---|---|---|---|---|---|---|---|---|---|---|
| 2025-08-19 | 13F | Newbridge Financial Services Group, Inc. | 375 | 0,00 | 19 | 5,56 | ||||
| 2025-07-07 | 13F | Nova Wealth Management, Inc. | 118 | 81,54 | 6 | 100,00 | ||||
| 2025-07-10 | 13F | Wealth Enhancement Advisory Services, Llc | 6 512 | −13,84 | 345 | −6,50 | ||||
| 2025-08-06 | 13F | Golden State Wealth Management, LLC | 535 | 0,19 | 27 | 3,85 | ||||
| 2025-08-05 | 13F | NewSquare Capital LLC | 47 387 | 8,51 | 2 415 | 13,23 | ||||
| 2025-07-09 | 13F | Shore Point Advisors, LLC | 277 857 | 3,67 | 14 160 | 8,17 | ||||
| 2025-07-15 | 13F | Optima Capital Llc | 24 222 | 0,04 | 1 234 | 4,40 | ||||
| 2025-07-22 | 13F | Berger Financial Group, Inc | 5 436 | 0,00 | 277 | 4,53 | ||||
| 2025-08-11 | 13F | Lowe Brockenbrough & Co Inc | 1 200 | 61 | ||||||
| 2025-08-26 | 13F | Claris Financial LLC | 16 342 | −33,43 | 833 | −37,16 | ||||
| 2025-07-22 | 13F | Team Financial Group, LLC | 2 769 | 141 | ||||||
| 2025-07-29 | 13F | Smithbridge Asset Management Inc/de | 6 591 | −84,77 | 336 | −84,15 | ||||
| 2025-08-04 | 13F | Linscomb & Williams, Inc. | 171 819 | −2,18 | 8 756 | 2,06 | ||||
| 2025-08-12 | 13F | Steward Partners Investment Advisory, Llc | 21 854 | −64,36 | 1 114 | −62,83 | ||||
| 2025-08-15 | 13F | Kestra Advisory Services, LLC | 20 427 | 8,17 | 1 041 | 12,80 | ||||
| 2025-07-29 | 13F | Chicago Partners Investment Group LLC | 7 330 | 0,26 | 394 | 13,26 | ||||
| 2025-08-14 | 13F | Smartleaf Asset Management LLC | 17 957 | 3,61 | 916 | 8,03 | ||||
| 2025-08-11 | 13F | Rothschild Investment Llc | 1 400 | 0,00 | 71 | 4,41 | ||||
| 2025-08-12 | 13F | Coston, McIsaac & Partners | 100 | 0,00 | 0 | |||||
| 2025-08-11 | 13F | HighTower Advisors, LLC | 0 | −100,00 | 0 | |||||
| 2025-08-08 | 13F | Cetera Investment Advisers | 313 673 | −1,66 | 15 985 | 2,61 | ||||
| 2025-08-11 | 13F | Covestor Ltd | 109 | 15,96 | 0 | |||||
| 2025-07-08 | 13F | Nbc Securities, Inc. | 10 125 | 2,26 | 1 | |||||
| 2025-08-14 | 13F | UBS Group AG | 720 106 | −1,88 | 36 697 | 2,38 | ||||
| 2025-07-17 | 13F | Janney Montgomery Scott LLC | 4 810 | 0,00 | 0 | |||||
| 2025-08-08 | 13F | Larson Financial Group LLC | 16 507 | 0,35 | 841 | 4,73 | ||||
| 2025-08-13 | 13F | Transce3nd, LLC | 711 | −0,70 | 36 | 5,88 | ||||
| 2025-08-13 | 13F | Cheviot Value Management, LLC | 199 | 0,00 | 10 | 11,11 | ||||
| 2025-08-12 | 13F | CIBC Private Wealth Group, LLC | 10 740 | 0,00 | 547 | 19,96 | ||||
| 2025-07-14 | 13F | S.A. Mason LLC | 9 450 | 0,00 | 482 | 4,34 | ||||
| 2025-07-23 | 13F | Indiana Trust & Investment Management CO | 2 143 | 0,00 | 109 | 4,81 | ||||
| 2025-08-06 | 13F | Prospera Financial Services Inc | 15 653 | −22,01 | 799 | −18,65 | ||||
| 2025-08-11 | 13F | NewEdge Wealth, LLC | 0 | −100,00 | 0 | |||||
| 2025-07-21 | 13F | Ameriflex Group, Inc. | 0 | −100,00 | 0 | |||||
| 2025-08-12 | 13F | LPL Financial LLC | 510 962 | 7,63 | 26 039 | 12,31 | ||||
| 2025-04-09 | 13F | Graves-Light Private Wealth Management, Inc. | 0 | −100,00 | 0 | |||||
| 2025-08-15 | 13F | Equitable Holdings, Inc. | 4 795 | 244 | ||||||
| 2025-08-14 | 13F | Qube Research & Technologies Ltd | 133 | 0,00 | 7 | 0,00 | ||||
| 2025-08-08 | 13F | Creative Planning | 26 177 | 0,42 | 1 334 | 4,79 | ||||
| 2025-05-13 | 13F | EPG Wealth Management LLC | 0 | −100,00 | 0 | −100,00 | ||||
| 2025-07-24 | 13F | Us Bancorp \de\ | 8 577 | 0,00 | 437 | 4,55 | ||||
| 2025-08-12 | 13F | PSI Advisors, LLC | 5 971 | 0,00 | 304 | 4,47 | ||||
| 2025-08-04 | 13F | Assetmark, Inc | 777 | 432,19 | 40 | 457,14 | ||||
| 2025-08-11 | 13F | Citigroup Inc | 1 839 | 9,14 | 94 | 13,41 | ||||
| 2025-07-10 | 13F | Global Financial Private Client, LLC | 0 | −100,00 | 0 | |||||
| 2025-07-22 | 13F | DAVENPORT & Co LLC | 7 158 | 57,39 | 365 | 63,96 | ||||
| 2025-08-04 | 13F | Pensionmark Financial Group, Llc | 0 | −100,00 | 0 | |||||
| 2025-08-04 | 13F | Atria Investments Llc | 39 702 | 18,29 | 2 023 | 23,43 | ||||
| 2025-08-11 | 13F | Invenio Wealth Partners Llc | 0 | −100,00 | 0 | |||||
| 2025-08-12 | 13F | Clearwater Capital Advisors, LLC | 4 230 | −1,76 | 216 | 2,38 | ||||
| 2025-07-24 | 13F | Blair William & Co/il | 12 599 | −12,26 | 642 | −8,42 | ||||
| 2025-05-28 | 13F | Intrua Financial, LLC | 0 | −100,00 | 0 | −100,00 | ||||
| 2025-07-15 | 13F | FLP Wealth Management, LLC | 0 | −100,00 | 0 | |||||
| 2025-08-14 | 13F | Mariner, LLC | 5 407 | 6,37 | 276 | 10,89 | ||||
| 2025-07-08 | 13F | Arlington Trust Co LLC | 500 | 0,00 | 25 | 4,17 | ||||
| 2025-07-24 | 13F | Financial Connections Group, Inc. | 1 350 | 0,00 | 0 | |||||
| 2025-08-12 | 13F | Laurel Wealth Advisors LLC | 214 542 | 4 996,01 | 4 | −98,05 | ||||
| 2025-07-25 | 13F | Ruedi Wealth Management, Inc. | 0 | −100,00 | 0 | |||||
| 2025-07-30 | 13F | Insight Advisors, LLC/ PA | 40 118 | 4,60 | 2 044 | 9,13 | ||||
| 2025-07-31 | 13F | Cambridge Investment Research Advisors, Inc. | 18 553 | −4,04 | 1 | |||||
| 2025-07-10 | 13F | Kmg Fiduciary Partners, Llc | 10 334 | 11,43 | 527 | 16,37 | ||||
| 2025-08-11 | 13F | Culbertson A N & Co Inc | 62 454 | −1,45 | 3 183 | 2,81 | ||||
| 2025-03-14 | 13F | Leicht Financial Planning & Wealth Management, Inc. | 0 | −100,00 | 0 | |||||
| 2025-07-15 | 13F | Fifth Third Bancorp | 0 | −100,00 | 0 | |||||
| 2025-08-11 | 13F | Private Advisor Group, LLC | 64 768 | 5,03 | 3 301 | 9,60 | ||||
| 2025-08-14 | 13F | Royal Bank Of Canada | 111 081 | −1,16 | 5 660 | 3,12 | ||||
| 2025-08-07 | 13F | Allworth Financial LP | 638 | 16,00 | 33 | 28,00 | ||||
| 2025-08-14 | 13F/A | Rockefeller Capital Management L.P. | 11 375 | 0,02 | 580 | 4,32 | ||||
| 2025-07-21 | 13F | Precedent Wealth Partners, Llc | 8 079 | 0,90 | 412 | 5,12 | ||||
| 2025-08-14 | 13F/A | Forefront Analytics, LLC | 20 571 | −20,90 | 1 048 | −17,42 | ||||
| 2025-08-08 | 13F | Hartland & Co., LLC | 751 | 38 | ||||||
| 2025-07-28 | 13F | Frazier Financial Advisors, LLC | 133 | 0,00 | 7 | 0,00 | ||||
| 2025-07-15 | 13F | World Equity Group, Inc. | 5 751 | −2,13 | 293 | 0,69 | ||||
| 2025-08-14 | 13F | Susquehanna International Group, Llp | 27 966 | −79,01 | 1 425 | −78,10 | ||||
| 2025-08-15 | 13F | Captrust Financial Advisors | 3 945 | −23,10 | 201 | −19,60 | ||||
| 2025-07-24 | 13F | Jfs Wealth Advisors, Llc | 1 813 | 0,00 | 92 | 4,55 | ||||
| 2025-08-08 | 13F | Kingsview Wealth Management, LLC | 5 210 | −1,14 | 266 | 3,11 | ||||
| 2025-05-21 | 13F/A | Geneos Wealth Management Inc. | 0 | −100,00 | 0 | −100,00 | ||||
| 2025-07-23 | 13F | Defined Financial Planning LLC | 38 586 | 17,54 | 1 993 | 24,03 | ||||
| 2025-07-07 | 13F | Horizons Wealth Management | 832 | 0,00 | 42 | 5,00 | ||||
| 2025-07-29 | 13F | Uhlmann Price Securities, Llc | 4 587 | −5,03 | 234 | −0,85 | ||||
| 2025-08-14 | 13F | Mml Investors Services, Llc | 7 734 | −11,04 | 0 | |||||
| 2025-08-11 | 13F | Howard Wealth Management, Llc | 19 255 | 0,00 | 981 | 4,36 | ||||
| 2025-08-11 | 13F | Principal Securities, Inc. | 739 | −15,93 | 38 | −21,28 | ||||
| 2025-08-19 | 13F | Asset Dedication, LLC | 3 162 | 0,00 | 161 | 4,55 | ||||
| 2025-07-24 | 13F | Ronald Blue Trust, Inc. | 2 708 | 0,00 | 138 | 4,55 | ||||
| 2025-08-14 | 13F | Ancora Advisors, LLC | 95 | 0,00 | 5 | 0,00 | ||||
| 2025-04-10 | 13F | Cathy Pareto & Associates, Inc | 0 | −100,00 | 0 | |||||
| 2025-07-28 | 13F | Capital Management Corp /va | 5 427 | 3,37 | 277 | 7,81 | ||||
| 2025-08-05 | 13F | Dunhill Financial, LLC | 62 | 0,00 | 3 | 0,00 | ||||
| 2025-08-14 | 13F | Bank Of America Corp /de/ | 769 014 | −5,23 | 39 189 | −1,12 | ||||
| 2025-08-15 | 13F | Tower Research Capital LLC (TRC) | 20 | 566,67 | 1 | |||||
| 2025-07-25 | 13F | Concurrent Investment Advisors, LLC | 14 478 | 28,19 | 738 | 33,76 | ||||
| 2025-08-06 | 13F | Columbia River Financial Group, LLC | 10 080 | 0,24 | 1 | |||||
| 2025-08-13 | 13F | Oxler Private Wealth LLC | 13 164 | −8,96 | 671 | −5,10 | ||||
| 2025-08-04 | 13F | Amplius Wealth Advisors, LLC | 144 551 | 7 366 | ||||||
| 2025-08-12 | 13F | Proequities, Inc. | 0 | 0 | ||||||
| 2025-08-14 | 13F | Betterment LLC | 9 443 | 9,80 | 0 | |||||
| 2025-08-01 | 13F | Envestnet Asset Management Inc | 113 183 | 3,72 | 5 768 | 8,22 | ||||
| 2025-05-15 | 13F | D. E. Shaw & Co., Inc. | 0 | −100,00 | 0 | |||||
| 2025-07-11 | 13F | Essex Savings Bank | 4 200 | 0,00 | 214 | 3,90 | ||||
| 2025-07-10 | 13F | Moller Financial Services | 18 442 | 0,00 | 940 | 4,33 | ||||
| 2025-08-12 | 13F | Archer Investment Corp | 0 | −100,00 | 0 | |||||
| 2025-08-12 | 13F | Global Retirement Partners, LLC | 24 890 | −90,86 | 1 268 | −91,37 | ||||
| 2025-05-19 | 13F | Heck Capital Advisors, LLC | 0 | −100,00 | 0 | −100,00 | ||||
| 2025-07-15 | 13F | Herbst Group, Llc | 29 806 | −1,97 | 1 519 | 2,22 | ||||
| 2025-08-13 | 13F | Cresset Asset Management, LLC | 7 728 | 0,00 | 394 | 4,24 | ||||
| 2025-08-12 | 13F | Jpmorgan Chase & Co | 44 080 | −15,62 | 2 246 | −11,96 | ||||
| 2025-08-14 | 13F | Ameriprise Financial Inc | 488 696 | −0,15 | 24 909 | 4,44 | ||||
| 2025-07-11 | 13F | Pinnacle Bancorp, Inc. | 0 | −100,00 | 0 | |||||
| 2025-07-25 | 13F | Means Investment Co., Inc. | 12 836 | 0,10 | 654 | 4,47 | ||||
| 2025-07-31 | 13F | Kathleen S. Wright Associates Inc. | 134 700 | −1,71 | 6 864 | 2,57 | ||||
| 2025-08-06 | 13F | Commonwealth Equity Services, Llc | 104 907 | −8,76 | 5 | 0,00 | ||||
| 2025-08-14 | 13F | Blue Capital, Inc. | 0 | −100,00 | 0 | |||||
| 2025-07-30 | 13F | Eqis Capital Management, Inc. | 4 962 | −1,70 | 253 | 2,44 | ||||
| 2025-08-14 | 13F | Fmr Llc | 6 412 | 22,23 | 327 | 27,34 | ||||
| 2025-08-05 | 13F | Claro Advisors LLC | 8 199 | 3,12 | 418 | 7,47 | ||||
| 2025-08-12 | 13F | Nemes Rush Group LLC | 9 215 | −37,70 | 470 | −35,04 | ||||
| 2025-08-13 | 13F | Jones Financial Companies Lllp | 1 144 | 12,27 | 58 | 18,37 | ||||
| 2025-08-14 | 13F | Citadel Advisors Llc | 0 | −100,00 | 0 | |||||
| 2025-08-07 | 13F | Howard Bailey Securities, Llc | 48 781 | −0,52 | 2 486 | 3,76 | ||||
| 2025-08-14 | 13F | CoreCap Advisors, LLC | 2 434 | −0,65 | 124 | 4,20 | ||||
| 2025-08-14 | 13F | Stifel Financial Corp | 46 487 | 6,99 | 2 369 | 11,59 | ||||
| 2025-07-18 | 13F | Institute for Wealth Management, LLC. | 4 290 | 0,00 | 219 | 4,31 | ||||
| 2025-07-24 | 13F | IFP Advisors, Inc | 624 | 0,00 | 32 | 3,33 | ||||
| 2025-08-06 | 13F | Modera Wealth Management, LLC | 6 821 | 0,00 | 348 | 4,20 | ||||
| 2025-08-15 | 13F | Morgan Stanley | 726 470 | −3,13 | 37 021 | 1,07 | ||||
| 2025-08-12 | 13F | O'shaughnessy Asset Management, Llc | 3 417 | 125,10 | 174 | 135,14 | ||||
| 2025-09-04 | 13F/A | Advisor Group Holdings, Inc. | 48 005 | 44,22 | 2 447 | 50,52 | ||||
| 2025-07-25 | 13F | Cwm, Llc | 12 502 | 1,22 | 1 | |||||
| 2025-08-14 | 13F | Warren Averett Asset Management, LLC | 79 765 | 0,00 | 4 065 | 4,34 | ||||
| 2025-08-14 | 13F | Wiley Bros.-aintree Capital, Llc | 34 555 | 0,00 | 1 761 | 4,14 | ||||
| 2025-08-27 | NP | FFOX - FundX Future Fund Opportunities ETF | 1 078 | 55 | ||||||
| 2025-08-14 | 13F | Jane Street Group, Llc | 9 970 | 508 | ||||||
| 2025-08-07 | 13F | Addison Advisors LLC | 225 | 0,00 | 11 | 10,00 | ||||
| 2025-05-08 | 13F | FSA Advisors, Inc. | 0 | −100,00 | 0 | |||||
| 2025-08-14 | 13F | Colony Group, LLC | 3 975 | −37,15 | 203 | −34,42 | ||||
| 2025-05-01 | 13F | Quest 10 Wealth Builders, Inc. | 46 | −50,00 | 2 | −50,00 | ||||
| 2025-08-14 | 13F | Talon Private Wealth, LLC | 168 | 9 | ||||||
| 2025-08-13 | 13F | Beacon Pointe Advisors, LLC | 0 | −100,00 | 0 | |||||
| 2025-08-18 | 13F | Tyler-Stone Wealth Management | 18 197 | 0,12 | 927 | 4,51 | ||||
| 2025-04-29 | 13F | U.S. Capital Wealth Advisors, LLC | 0 | −100,00 | 0 | |||||
| 2025-08-07 | 13F | Parkside Financial Bank & Trust | 0 | −100,00 | 0 | |||||
| 2025-04-25 | 13F | Joel Isaacson & Co., LLC | 0 | −100,00 | 0 | |||||
| 2025-08-19 | 13F | Advisory Services Network, LLC | 5 167 | −2,18 | 266 | 3,50 | ||||
| 2025-05-12 | 13F | First Western Trust Bank | 0 | −100,00 | 0 | |||||
| 2025-08-14 | 13F | Goldman Sachs Group Inc | 15 029 | 0,00 | 766 | 4,22 | ||||
| 2025-05-07 | 13F | Motco | 0 | −100,00 | 0 | |||||
| 2025-08-13 | 13F | Luminist Capital LLC | 7 | 0,00 | 0 | |||||
| 2025-08-13 | 13F | Northwestern Mutual Wealth Management Co | 821 | 22,90 | 42 | 28,13 | ||||
| 2025-08-14 | 13F | Two Sigma Investments, Lp | 45 700 | −43,58 | 2 329 | −41,15 | ||||
| 2025-05-08 | 13F | Wellington Shields Capital Management, LLC | 0 | −100,00 | 0 | −100,00 | ||||
| 2025-08-14 | 13F | Raymond James Financial Inc | 106 755 | −0,52 | 5 440 | 3,80 | ||||
| 2025-08-14 | 13F | Comerica Bank | 2 905 | −20,13 | 148 | −16,38 | ||||
| 2025-08-14 | 13F | Wells Fargo & Company/mn | 124 571 | 73,19 | 6 348 | 80,75 | ||||
| 2025-07-10 | 13F | Envision Financial LLC | 4 632 | 0,00 | 236 | 4,42 | ||||
| 2025-07-28 | 13F | Harbour Investments, Inc. | 3 712 | 11,17 | 189 | 15,95 | ||||
| 2025-07-29 | 13F | Crux Wealth Advisors | 4 988 | −65,58 | 254 | −64,07 | ||||
| 2025-07-07 | 13F | Wilson & Boucher Capital Management, LLC | 5 400 | 0,00 | 275 | 4,56 | ||||
| 2025-08-08 | 13F | Pnc Financial Services Group, Inc. | 1 605 | 0,00 | 82 | 3,85 | ||||
| 2025-08-05 | 13F | Key FInancial Inc | 255 510 | −19,37 | 13 021 | −15,87 | ||||
| 2025-08-06 | 13F | Savant Capital, LLC | 215 894 | −7,90 | 11 002 | −3,90 | ||||
| 2025-08-04 | 13F | Flagship Harbor Advisors, Llc | 14 957 | 1,78 | 762 | 6,28 | ||||
| 2025-08-13 | 13F | Continuum Advisory, LLC | 0 | −100,00 | 0 | |||||
| 2025-08-14 | 13F | Essential Planning, LLC. | 7 803 | 0,01 | 398 | 4,20 | ||||
| 2025-07-02 | 13F | Lvm Capital Management Ltd/mi | 4 326 | −0,69 | 0 | |||||
| 2025-07-28 | 13F | RFG Advisory, LLC | 5 912 | −6,34 | 301 | −2,27 | ||||
| 2025-08-06 | 13F | AE Wealth Management LLC | 2 309 | −5,02 | 118 | −0,85 | ||||
| 2025-07-17 | 13F | New Perspectives, Inc | 25 905 | −16,30 | 1 320 | −12,64 | ||||
| 2025-07-10 | 13F | Exchange Traded Concepts, Llc | 669 | 34 | ||||||
| 2025-08-08 | 13F | Avantax Advisory Services, Inc. | 48 331 | −0,45 | 2 463 | 3,84 | ||||
| 2025-08-04 | 13F | Savvy Advisors, Inc. | 5 908 | 0,03 | 301 | 4,51 |
Other Listings
| MX:EES |