Grundläggande statistik
| Institutionella ägare | 170 total, 170 long only, 0 short only, 0 long/short - change of 6,92% MRQ |
| Genomsnittlig portföljallokering | 0.2140 % - change of −21,71% MRQ |
| Institutionella aktier (lång) | 16 073 254 (ex 13D/G) - change of 0,68MM shares 4,41% MRQ |
| Institutionellt värde (lång) | $ 443 240 USD ($1000) |
Institutionellt ägande och aktieägare
iShares, Inc. - iShares Emerging Markets Dividend ETF (US:DVYE) har 170 Institutionella ägare och aktieägare som har lämnat in 13D/G- eller 13F-formulär till Securities Exchange Commission (SEC). Dessa institut innehar totalt 16,073,254 aktier. Största aktieägare inkluderar Auto-Owners Insurance Co, Creative Planning, Bank Of America Corp /de/, Morgan Stanley, Keybank National Association/oh, Susquehanna International Group, Llp, UBS Group AG, BCJ Capital Management, LLC, Assetmark, Inc, and LPL Financial LLC .
iShares, Inc. - iShares Emerging Markets Dividend ETF (ARCA:DVYE) Institutionell ägarstruktur visar institutioners och fonders nuvarande positioner i företaget, samt de senaste förändringarna i positionernas storlek. Större aktieägare kan vara enskilda investerare, fonder, hedgefonder eller institutioner. Bilaga 13D visar att investeraren äger (eller ägde) mer än 5% av företaget och avser (eller avsåg) att aktivt eftersträva en förändring av affärsstrategin. Schedule 13G indikerar en passiv investering på över 5%.
The share price as of September 17, 2025 is 30,12 / share. Previously, on September 18, 2024, the share price was 27,39 / share. This represents an increase of 9,98% over that period.

Fondsentimentets poäng
Fondsentimentet poängen(fka Ägarackumulation-poäng) visar vilka aktier som är mest köpta av fonder. Det är resultatet av en sofistikerad kvantitativ flerfaktormodell som identifierar företag med de högsta nivåerna av institutionell ackumulering. Poängsättningsmodellen använder en kombination av den totala ökningen av redovisade ägare, förändringarna i portföljallokeringarna för dessa ägare och andra mått. Siffran sträcker sig från 0 till 100, där högre siffror indikerar en högre nivå av ackumulering i förhållande till sina konkurrenter, och 50 är genomsnittet.
Uppdateringsfrekvens: Dagligen
Se Ownership Explorer, som innehåller en lista över de högst rankade företagen.
Institutionell sälj/köp-kvot
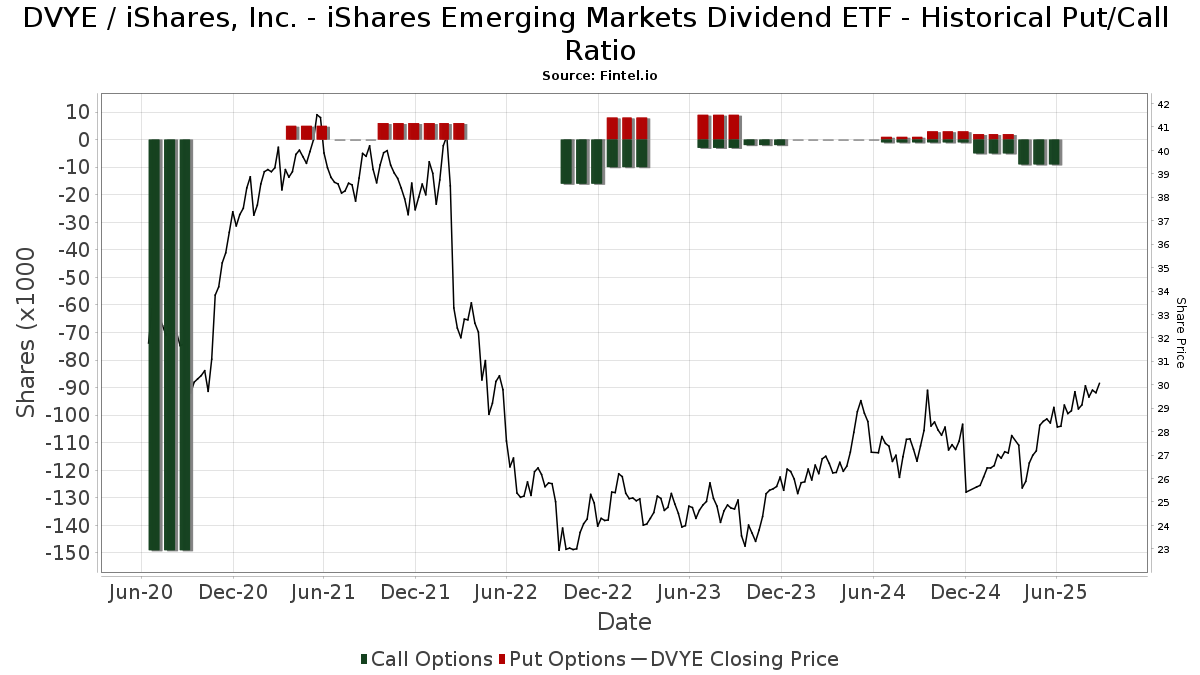
Förutom att rapportera vanliga eget kapital- och skuldemissioner måste institutioner med mer än 100MM tillgångar under förvaltning också avslöja sina innehav av sälj- och köpoptioner. Eftersom säljoptioner i allmänhet indikerar ett negativt sentiment och köpoptioner indikerar ett positivt sentiment, kan vi få en uppfattning om det övergripande institutionella sentimentet genom att plotta förhållandet mellan säljoptioner och köpoptioner. Diagrammet till höger visar det historiska förhållandet mellan sälj- och köpoptioner för detta instrument.
Genom att använda sälj/köp-kvoten som en indikator på aktieägarnas sentiment undviker man en av de största bristerna med att använda det totala institutionella ägandet, nämligen att en betydande del av de förvaltade tillgångarna investeras passivt för att följa index. Passivt förvaltade fonder köper vanligtvis inte optioner, så indikatorn för sälj/köp-kvoten ger en bättre bild av stämningen i aktivt förvaltade fonder.
13F- och NPORT-arkiveringar
Detaljer om 13F-arkiveringar är gratis. Detaljer om NP-arkiveringar kräver ett premiummedlemskap. Gröna rader indikerar nya positioner. Röda rader indikerar stängda positioner. Klicka på länk symbolen för att se hela transaktionshistoriken.
Uppgradera
för att låsa upp premiumdata och exportera till Excel ![]() .
.
| Fil Datum | Källa | Investerare | Typ | Genomsnittligt pris (beräknat) |
Aktier | Δ Aktier (%) |
Rapporterat värde (1000 USD) |
Δ Värde (%) |
Portföljallokering (%) |
|
|---|---|---|---|---|---|---|---|---|---|---|
| 2025-07-21 | 13F | Barrett & Company, Inc. | 20 458 | 0,86 | 586 | 5,97 | ||||
| 2025-07-10 | 13F | Wealth Enhancement Advisory Services, Llc | 47 050 | 48,98 | 1 374 | 59,58 | ||||
| 2025-08-08 | 13F | Larson Financial Group LLC | 0 | −100,00 | 0 | |||||
| 2025-08-12 | 13F | MAI Capital Management | 1 764 | 0,00 | 51 | 4,17 | ||||
| 2025-08-13 | 13F | Northwestern Mutual Wealth Management Co | 36 806 | 41,25 | 1 054 | 48,24 | ||||
| 2025-09-04 | 13F/A | Advisor Group Holdings, Inc. | 83 770 | 19,72 | 2 391 | 25,20 | ||||
| 2025-07-15 | 13F | Revisor Wealth Management LLC | 254 778 | 0,52 | 7 386 | 6,77 | ||||
| 2025-08-06 | 13F | Golden State Wealth Management, LLC | 98 | 3 | ||||||
| 2025-08-08 | 13F | Glassman Wealth Services | 13 | 0,00 | 0 | |||||
| 2025-08-14 | 13F | Fmr Llc | 630 | −46,88 | 18 | −43,75 | ||||
| 2025-07-17 | 13F | Janney Montgomery Scott LLC | 32 513 | 34,77 | 1 | |||||
| 2025-08-14 | 13F | IHT Wealth Management, LLC | 10 587 | 1,44 | 303 | 6,69 | ||||
| 2025-08-04 | 13F | REDW Wealth LLC | 10 496 | 0,00 | 301 | 4,90 | ||||
| 2025-08-11 | 13F | Strategic Wealth Partners, Ltd. | 1 | 0 | ||||||
| 2025-08-14 | 13F | Federation des caisses Desjardins du Quebec | 61 | 0,00 | 2 | 0,00 | ||||
| 2025-08-06 | 13F | Vantage Financial Partners, LLC | 33 029 | 2,42 | 946 | 7,50 | ||||
| 2025-07-28 | 13F | Axxcess Wealth Management, Llc | 8 197 | 1,54 | 235 | 6,36 | ||||
| 2025-08-14 | 13F | Mercer Global Advisors Inc /adv | 192 622 | −8,94 | 5 519 | −4,40 | ||||
| 2025-07-25 | 13F | Concord Asset Management, LLC/VA | 83 365 | 6,20 | 2 388 | 14,15 | ||||
| 2025-07-14 | 13F | Sweeney & Michel, Llc | 17 694 | −2,42 | 514 | 18,20 | ||||
| 2025-05-15 | 13F | BTG Pactual Asset Management US LLC | 0 | −100,00 | 0 | |||||
| 2025-08-14 | 13F | Comerica Bank | 13 368 | −3,98 | 383 | 0,79 | ||||
| 2025-08-14 | 13F/A | Barclays Plc | 93 | 0,00 | 0 | |||||
| 2025-08-08 | 13F | Cetera Investment Advisers | 81 379 | −12,25 | 2 332 | −7,87 | ||||
| 2025-07-24 | 13F | Blair William & Co/il | 1 625 | 0,00 | 47 | 4,55 | ||||
| 2025-08-14 | 13F | Diversify Advisory Services, LLC | 7 321 | 218 | ||||||
| 2025-08-04 | 13F | Keybank National Association/oh | 836 637 | 12,23 | 23 970 | 17,82 | ||||
| 2025-08-14 | 13F | Citadel Advisors Llc | Put | 0 | −100,00 | 0 | ||||
| 2025-07-31 | 13F | Wealthfront Advisers Llc | 32 648 | −8,97 | 935 | −4,40 | ||||
| 2025-04-29 | 13F | Financial Network Wealth Management LLC | 1 304 | 0 | ||||||
| 2025-08-14 | 13F/A | Rockefeller Capital Management L.P. | 44 807 | 0,02 | 1 284 | 4,99 | ||||
| 2025-08-14 | 13F | Stifel Financial Corp | 145 187 | −7,43 | 4 160 | −2,80 | ||||
| 2025-07-02 | 13F | Crumly & Associates Inc. | 8 630 | 247 | ||||||
| 2025-08-14 | 13F | Mariner, LLC | 60 614 | −10,07 | 1 737 | −5,60 | ||||
| 2025-08-14 | 13F | Ameriprise Financial Inc | 10 159 | −40,66 | 291 | −37,69 | ||||
| 2025-07-21 | 13F | Empirical Financial Services, LLC d.b.a. Empirical Wealth Management | 8 182 | 234 | ||||||
| 2025-08-12 | 13F | LPL Financial LLC | 441 218 | 88,97 | 12 641 | 98,40 | ||||
| 2025-07-14 | 13F | AdvisorNet Financial, Inc | 806 | 0,00 | 23 | 9,52 | ||||
| 2025-08-14 | 13F | Sunbelt Securities, Inc. | 25 | 0,00 | 1 | |||||
| 2025-08-14 | 13F | Raymond James Financial Inc | 84 822 | 6,43 | 2 430 | 11,78 | ||||
| 2025-08-18 | 13F/A | National Bank Of Canada /fi/ | 11 558 | 90,73 | 331 | 100,00 | ||||
| 2025-07-28 | 13F | Harbour Investments, Inc. | 1 363 | 0,00 | 39 | 5,41 | ||||
| 2025-07-31 | 13F | 3EDGE Asset Management, LP | 174 088 | 0,73 | 4 988 | 5,75 | ||||
| 2025-08-12 | 13F | Change Path, LLC | 13 584 | 389 | ||||||
| 2025-07-29 | 13F | Stephens Inc /ar/ | 82 742 | 4,65 | 2 371 | 9,87 | ||||
| 2025-08-14 | 13F | Wharton Business Group, LLC | 0 | −100,00 | 0 | |||||
| 2025-04-09 | 13F | Sanders Morris Harris Llc | 0 | −100,00 | 0 | |||||
| 2025-04-29 | 13F | Element Wealth, LLC | 0 | −100,00 | 0 | |||||
| 2025-08-15 | 13F | Equitable Holdings, Inc. | 64 470 | 28,17 | 1 847 | 34,62 | ||||
| 2025-07-25 | 13F | Apollon Wealth Management, LLC | 8 426 | −15,09 | 241 | −10,74 | ||||
| 2025-08-06 | 13F | Pekin Hardy Strauss, Inc. | 7 735 | 222 | ||||||
| 2025-07-31 | 13F | 180 Wealth Advisors, Llc | 39 206 | 6,97 | 1 123 | 12,30 | ||||
| 2025-07-23 | 13F | Joel Isaacson & Co., LLC | 12 071 | 2,45 | 346 | 7,48 | ||||
| 2025-08-14 | 13F | Smartleaf Asset Management LLC | 1 012 | 29 | ||||||
| 2025-07-21 | 13F | Ameritas Advisory Services, LLC | 5 926 | −20,65 | 170 | −16,75 | ||||
| 2025-08-14 | 13F | Hancock Whitney Corp | 42 568 | −0,27 | 1 220 | 4,73 | ||||
| 2025-08-06 | 13F | Raelipskie Partnership | 21 470 | −0,92 | 615 | 4,06 | ||||
| 2025-08-13 | 13F | Lido Advisors, LLC | 52 250 | −0,81 | 1 497 | 4,11 | ||||
| 2025-07-25 | 13F | Concurrent Investment Advisors, LLC | 15 100 | 0,00 | 433 | 4,85 | ||||
| 2025-08-12 | 13F | Integrated Advisors Network LLC | 93 558 | 5,89 | 2 680 | 11,16 | ||||
| 2025-07-21 | 13F | Abundance Wealth Counselors | 7 865 | 0,31 | 0 | |||||
| 2025-07-29 | 13F | Balboa Wealth Partners | 13 809 | 1,72 | 396 | 6,76 | ||||
| 2025-08-11 | 13F | Wealthspire Advisors, LLC | 51 658 | 0,00 | 1 480 | 5,04 | ||||
| 2025-08-07 | 13F | Cascade Financial Partners, LLC | 33 399 | 0,01 | 957 | 4,94 | ||||
| 2025-07-24 | 13F | IFP Advisors, Inc | 4 280 | 4,16 | 123 | 8,93 | ||||
| 2025-08-14 | 13F | Wiley Bros.-aintree Capital, Llc | 134 213 | 2,11 | 3 845 | 7,04 | ||||
| 2025-08-07 | 13F | Grange Capital, LLC | 106 247 | −1,02 | 3 044 | 3,89 | ||||
| 2025-08-08 | 13F | Intrua Financial, LLC | 7 500 | 0,00 | 215 | 4,90 | ||||
| 2025-08-05 | 13F | Peregrine Asset Advisers, Inc. | 38 705 | −0,88 | 1 109 | 4,04 | ||||
| 2025-07-16 | 13F | Strategic Investment Solutions, Inc. /IL | 160 | 0,00 | 5 | 0,00 | ||||
| 2025-07-29 | 13F | Private Trust Co Na | 193 | 6 | ||||||
| 2025-08-14 | 13F | Bank Of America Corp /de/ | 1 055 657 | 6,43 | 30 245 | 11,73 | ||||
| 2025-08-13 | 13F | BCJ Capital Management, LLC | 537 629 | 9,54 | 15 403 | 15,01 | ||||
| 2025-07-11 | 13F | Pinnacle Bancorp, Inc. | 5 800 | 0,00 | 166 | 5,06 | ||||
| 2025-08-14 | 13F | Citadel Advisors Llc | Call | 9 600 | 62,71 | 275 | 70,81 | |||
| 2025-08-19 | 13F | Asset Dedication, LLC | 6 166 | −3,04 | 177 | 1,73 | ||||
| 2025-07-14 | 13F | Painted Porch Advisors LLC | 185 | 0,00 | 5 | 0,00 | ||||
| 2025-08-08 | 13F | Pnc Financial Services Group, Inc. | 1 495 | −0,47 | 43 | 2,44 | ||||
| 2025-07-31 | 13F | City State Bank | 185 | 0,00 | 5 | 0,00 | ||||
| 2025-08-12 | 13F | Howe & Rusling Inc | 0 | −100,00 | 0 | |||||
| 2025-07-31 | 13F | Optimum Investment Advisors | 11 041 | 0,12 | 316 | 5,33 | ||||
| 2025-08-11 | 13F | Regal Investment Advisors LLC | 10 177 | −7,88 | 292 | −3,32 | ||||
| 2025-07-25 | 13F | Cwm, Llc | 230 | 0,00 | 0 | |||||
| 2025-08-14 | 13F | Citadel Advisors Llc | 16 820 | −20,57 | 482 | −16,64 | ||||
| 2025-07-29 | 13F | Signature Estate & Investment Advisors Llc | 38 579 | 0,78 | 1 105 | 5,84 | ||||
| 2025-08-12 | 13F | Jpmorgan Chase & Co | 168 700 | 33,27 | 4 833 | 39,92 | ||||
| 2025-07-30 | 13F | Securian Asset Management, Inc | 250 000 | 0,00 | 7 162 | 4,98 | ||||
| 2025-05-14 | 13F | Brown Brothers Harriman & Co | 0 | −100,00 | 0 | |||||
| 2025-07-21 | 13F | DHJJ Financial Advisors, Ltd. | 6 | 0,00 | 0 | |||||
| 2025-08-13 | 13F | Marshall Wace, Llp | 169 742 | 225,26 | 4 863 | 241,50 | ||||
| 2025-08-06 | 13F | Ipsen Advisor Group LLC | 46 835 | 8,70 | 1 342 | 14,13 | ||||
| 2025-08-11 | 13F | Principal Securities, Inc. | 350 | −60,09 | 10 | −54,55 | ||||
| 2025-07-17 | 13F | Sound Income Strategies, LLC | 86 | 0,00 | 2 | 0,00 | ||||
| 2025-08-07 | 13F | Argent Advisors, Inc. | 242 344 | 1,31 | 6 943 | 6,36 | ||||
| 2025-08-13 | 13F | Baird Financial Group, Inc. | 52 755 | 4,71 | 1 511 | 9,97 | ||||
| 2025-08-14 | 13F | Susquehanna International Group, Llp | 830 564 | 63,90 | 23 796 | 72,07 | ||||
| 2025-08-28 | NP | GPMIX - GuidePath(R) Multi-Asset Income Allocation Fund Service Shares | 176 795 | −3,82 | 5 065 | 0,98 | ||||
| 2025-07-10 | 13F | Wedmont Private Capital | 8 122 | 2,45 | 234 | 14,22 | ||||
| 2025-08-04 | 13F | Pensionmark Financial Group, Llc | 26 658 | −0,04 | 764 | 4,95 | ||||
| 2025-08-14 | 13F | CIBC World Markets Inc. | 0 | −100,00 | 0 | |||||
| 2025-08-01 | 13F | Envestnet Asset Management Inc | 162 431 | −3,63 | 4 654 | 1,17 | ||||
| 2025-08-13 | 13F | Rsm Us Wealth Management Llc | 7 013 | 201 | ||||||
| 2025-08-05 | 13F | Cherry Tree Wealth Management, LLC | 281 | 0,00 | 8 | 14,29 | ||||
| 2025-07-23 | 13F | Eagle Strategies LLC | 16 310 | −56,47 | 467 | −54,31 | ||||
| 2025-08-08 | 13F | Thrive Capital Management, LLC | 78 011 | 2 235 | ||||||
| 2025-08-14 | 13F | EP Wealth Advisors, Inc. | 0 | −100,00 | 0 | |||||
| 2025-08-14 | 13F | UBS Group AG | 824 572 | 5,57 | 23 624 | 10,82 | ||||
| 2025-08-08 | 13F | Marble Harbor Investment Counsel, LLC | 25 300 | 0,00 | 725 | 4,93 | ||||
| 2025-05-12 | 13F | Nomura Asset Management Co Ltd | 0 | −100,00 | 0 | |||||
| 2025-08-13 | 13F | Crescent Grove Advisors, LLC | 131 280 | 7,41 | 3 761 | 12,77 | ||||
| 2025-08-14 | 13F | CIBC Asset Management Inc | 8 315 | 0,00 | 238 | 5,31 | ||||
| 2025-07-08 | 13F | Lowe Wealth Advisors, LLC | 22 725 | 2,25 | 651 | 7,43 | ||||
| 2025-08-08 | 13F | Creative Planning | 1 091 204 | −1,09 | 31 263 | 3,85 | ||||
| 2025-08-14 | 13F | Jane Street Group, Llc | 45 368 | 243,98 | 1 300 | 261,84 | ||||
| 2025-08-11 | 13F | FSA Wealth Management LLC | 18 | −81,63 | 2 | −88,89 | ||||
| 2025-07-30 | 13F | Blume Capital Management, Inc. | 625 | 8,70 | 18 | 13,33 | ||||
| 2025-07-25 | 13F | LRI Investments, LLC | 0 | −100,00 | 0 | |||||
| 2025-05-15 | 13F | Benchmark Investment Advisors LLC | 47 410 | 5,57 | 1 294 | 11,47 | ||||
| 2025-08-14 | 13F | Kovitz Investment Group Partners, LLC | 72 798 | 2 086 | ||||||
| 2025-07-29 | 13F | Sowa Financial Group, Inc. | 13 744 | −50,01 | 0 | |||||
| 2025-08-08 | 13F | Advyzon Investment Management, LLC | 11 783 | 23,84 | 338 | 30,12 | ||||
| 2025-07-22 | 13F | Iron Horse Wealth Management, LLC | 10 | 0,00 | 0 | |||||
| 2025-08-14 | 13F | State Of Wisconsin Investment Board | 267 953 | 0,00 | 7 677 | 4,98 | ||||
| 2025-07-30 | 13F | Whittier Trust Co | 488 | 0,00 | 14 | 0,00 | ||||
| 2025-08-13 | 13F | Jones Financial Companies Lllp | 10 116 | 58,78 | 288 | 64,94 | ||||
| 2025-07-18 | 13F | Truist Financial Corp | 65 306 | −26,99 | 1 871 | −23,32 | ||||
| 2025-08-04 | 13F | Assetmark, Inc | 443 692 | −1,53 | 12 712 | 3,38 | ||||
| 2025-08-13 | 13F | Continuum Advisory, LLC | 0 | −100,00 | 0 | |||||
| 2025-07-29 | NP | GINX - SGI Enhanced Global Income ETF | 89 009 | −7,88 | 2 517 | −1,10 | ||||
| 2025-08-12 | 13F | Global Retirement Partners, LLC | 91 | 3 | ||||||
| 2025-08-28 | NP | GPIGX - GuidePath(R) Growth and Income Fund | 190 610 | 1,36 | 5 461 | 6,41 | ||||
| 2025-08-12 | 13F | BlackRock, Inc. | 5 490 | 47,90 | 157 | 55,45 | ||||
| 2025-04-15 | 13F | Transform Wealth, LLC | 72 073 | −12,32 | 1 967 | −7,40 | ||||
| 2025-08-12 | 13F | Financial Advocates Investment Management | 16 847 | −6,76 | 483 | −2,23 | ||||
| 2025-07-17 | 13F | Wolff Wiese Magana Llc | 0 | −100,00 | 0 | |||||
| 2025-07-29 | 13F | Angeles Wealth Management, Llc | 5 797 | 0,00 | 166 | 5,06 | ||||
| 2025-07-25 | 13F | Concord Wealth Partners | 83 365 | 9,46 | 2 388 | 14,92 | ||||
| 2025-08-15 | 13F | Morgan Stanley | 893 254 | −17,15 | 25 592 | −13,02 | ||||
| 2025-08-11 | 13F | HighTower Advisors, LLC | 0 | −100,00 | 0 | |||||
| 2025-08-08 | 13F | Capital Investment Advisory Services, LLC | 2 445 | 0,00 | 70 | 6,06 | ||||
| 2025-08-14 | 13F | Old Mission Capital Llc | 7 919 | 227 | ||||||
| 2025-07-29 | 13F | Morgan Dempsey Capital Management Llc | 1 839 | 53 | ||||||
| 2025-08-11 | 13F | Private Advisor Group, LLC | 43 417 | −18,83 | 1 244 | −14,80 | ||||
| 2025-07-29 | 13F | TFC Financial Management | 2 344 | 0,00 | 67 | 6,35 | ||||
| 2025-08-14 | 13F | Mission Creek Capital Partners, Inc. | 12 391 | 1,63 | 355 | 6,63 | ||||
| 2025-08-06 | 13F | AE Wealth Management LLC | 857 | 0,00 | 25 | 4,35 | ||||
| 2025-08-12 | 13F | Proequities, Inc. | 0 | 0 | ||||||
| 2025-07-14 | 13F | Armstrong Advisory Group, Inc | 27 256 | 781 | ||||||
| 2025-08-05 | 13F | Crestwood Advisors Group LLC | 42 647 | 3,03 | 1 222 | 8,15 | ||||
| 2025-08-01 | 13F | Anson Capital, Inc. | 43 529 | −16,23 | 1 247 | −12,06 | ||||
| 2025-04-15 | 13F | Noble Wealth Management PBC | 0 | −100,00 | 0 | |||||
| 2025-08-06 | 13F | Commonwealth Equity Services, Llc | 193 626 | 12,43 | 6 | 25,00 | ||||
| 2025-05-12 | 13F | Independent Advisor Alliance | 0 | −100,00 | 0 | |||||
| 2025-07-17 | 13F | Eagle Bluffs Wealth Management LLC | 15 709 | 1,35 | 450 | 6,64 | ||||
| 2025-08-11 | 13F | United Capital Financial Advisers, Llc | 53 435 | −12,95 | 1 531 | −8,66 | ||||
| 2025-08-05 | 13F | Sigma Planning Corp | 9 070 | 4,30 | 260 | 9,28 | ||||
| 2025-08-14 | 13F | Glenmede Investment Management, LP | 16 000 | 458 | ||||||
| 2025-08-05 | 13F | Bank of New York Mellon Corp | 221 610 | 42,12 | 6 349 | 49,21 | ||||
| 2025-08-13 | 13F | bLong Financial, LLC | 57 404 | 1 645 | ||||||
| 2025-07-28 | 13F | DORVAL Corp | 30 611 | 35,05 | 877 | 46,90 | ||||
| 2025-08-14 | 13F | 10Elms LLP | 24 006 | 4,21 | 688 | 9,39 | ||||
| 2025-08-01 | 13F | Solstein Capital, LLC | 58 | 0,00 | 2 | 0,00 | ||||
| 2025-08-14 | 13F | BCS Private Wealth Management, Inc. | 23 230 | 1 | ||||||
| 2025-07-30 | 13F | Whittier Trust Co Of Nevada Inc | 271 | 0,00 | 8 | 0,00 | ||||
| 2025-08-12 | 13F | Steward Partners Investment Advisory, Llc | 107 336 | −5,64 | 3 075 | −0,93 | ||||
| 2025-08-14 | 13F | Mml Investors Services, Llc | 15 514 | −6,48 | 0 | |||||
| 2025-08-18 | 13F | Geneos Wealth Management Inc. | 939 | −9,62 | 27 | −7,14 | ||||
| 2025-04-30 | 13F | Synergy Investment Management, LLC | 0 | −100,00 | 0 | |||||
| 2025-08-11 | 13F | CFS Investment Advisory Services, LLC | 192 192 | 44,55 | 6 | 66,67 | ||||
| 2025-05-13 | 13F | Thrivent Financial For Lutherans | 0 | −100,00 | 0 | |||||
| 2025-08-14 | 13F | Qube Research & Technologies Ltd | 39 | 0,00 | 1 | 0,00 | ||||
| 2025-08-05 | 13F | GPS Wealth Strategies Group, LLC | 40 | 2,56 | 1 | 0,00 | ||||
| 2025-08-12 | 13F | Summit Global Investments | 89 179 | −0,74 | 3 | 0,00 | ||||
| 2025-08-13 | 13F | Cresset Asset Management, LLC | 372 105 | 2 155,46 | 10 661 | 2 268,89 | ||||
| 2025-05-15 | 13F | CAPROCK Group, Inc. | 24 712 | 674 | ||||||
| 2025-08-12 | 13F | CIBC Private Wealth Group, LLC | 0 | −100,00 | 0 | |||||
| 2025-08-14 | 13F | Ariadne Wealth Management, LP | 73 201 | 0,00 | 2 192 | 8,89 | ||||
| 2025-08-14 | 13F | Royal Bank Of Canada | 232 639 | 8,43 | 6 665 | 13,83 | ||||
| 2025-05-15 | 13F | Glenmede Trust Co Na | 16 000 | 0,00 | 437 | 5,57 | ||||
| 2025-07-30 | 13F | Eqis Capital Management, Inc. | 7 594 | −1,96 | 218 | 2,84 | ||||
| 2025-08-12 | 13F | Gladstone Institutional Advisory LLC | 7 022 | 201 | ||||||
| 2025-08-14 | 13F | GWM Advisors LLC | 256 538 | 25,57 | 7 350 | 31,82 | ||||
| 2025-08-12 | 13F | Winnow Wealth Llc | 0 | −100,00 | 0 | −100,00 | ||||
| 2025-07-30 | 13F | D.a. Davidson & Co. | 22 365 | 60,21 | 641 | 68,42 | ||||
| 2025-08-01 | 13F | Auto-Owners Insurance Co | 1 750 000 | −31,70 | 50 138 | −83,32 | ||||
| 2025-08-01 | 13F | Ashton Thomas Private Wealth, LLC | 11 536 | −10,50 | 331 | −5,98 | ||||
| 2025-08-13 | 13F | Virtus ETF Advisers LLC | 72 | 2 | ||||||
| 2025-08-13 | 13F | Consultiva Wealth Management, Corp. | 630 | 0,00 | 18 | 5,88 | ||||
| 2025-08-05 | 13F | Bank Of Montreal /can/ | 3 199 | 41,30 | 92 | 49,18 | ||||
| 2025-08-12 | 13F | Wood Tarver Financial Group, LLC | 184 | 0 | ||||||
| 2025-07-10 | 13F | Security National Bank | 4 947 | 0,69 | 142 | 5,22 | ||||
| 2025-07-31 | 13F | Cambridge Investment Research Advisors, Inc. | 29 065 | −4,00 | 1 | |||||
| 2025-08-14 | 13F | Wells Fargo & Company/mn | 8 409 | 0,01 | 241 | 4,80 |