Grundläggande statistik
| Institutionella ägare | 197 total, 197 long only, 0 short only, 0 long/short - change of 2,59% MRQ |
| Genomsnittlig portföljallokering | 0.1575 % - change of 1,34% MRQ |
| Institutionella aktier (lång) | 4 803 841 (ex 13D/G) - change of −0,18MM shares −3,60% MRQ |
| Institutionellt värde (lång) | $ 348 805 USD ($1000) |
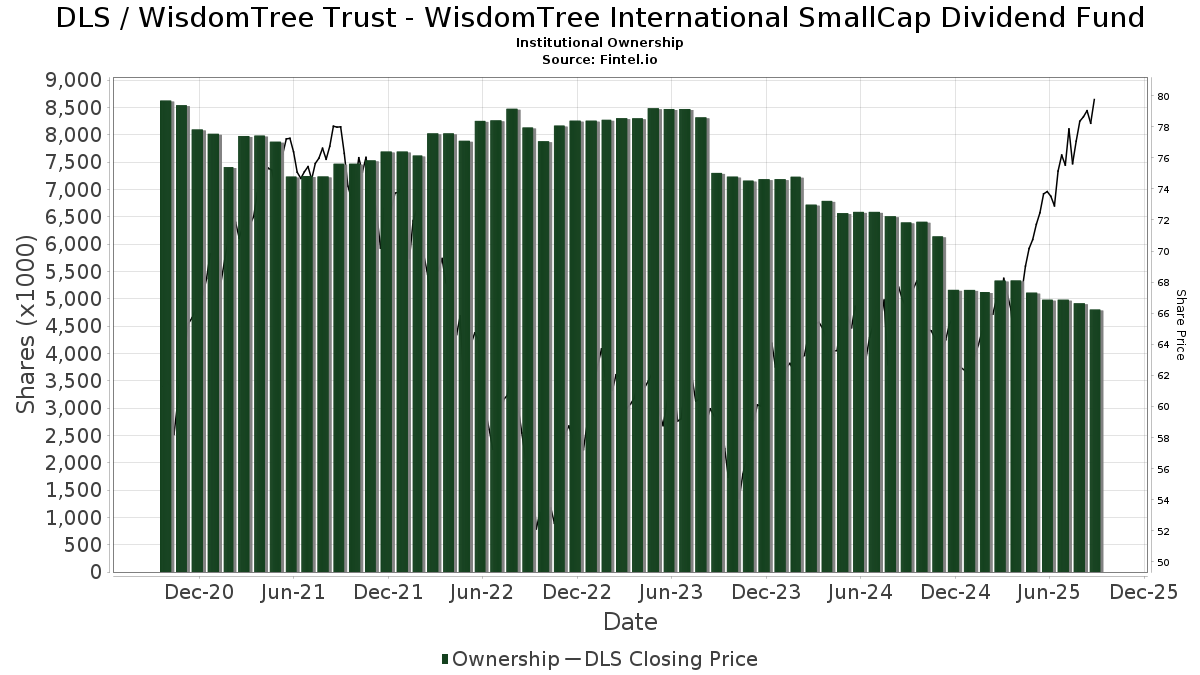
Institutionellt ägande och aktieägare
WisdomTree Trust - WisdomTree International SmallCap Dividend Fund (US:DLS) har 197 Institutionella ägare och aktieägare som har lämnat in 13D/G- eller 13F-formulär till Securities Exchange Commission (SEC). Dessa institut innehar totalt 4,803,841 aktier. Största aktieägare inkluderar Savant Capital, LLC, BIP Wealth, LLC, LRI Investments, LLC, Bank Of America Corp /de/, Morgan Stanley, HighTower Advisors, LLC, MAI Capital Management, Congress Wealth Management LLC / DE /, Raymond James Financial Inc, and UBS Group AG .
WisdomTree Trust - WisdomTree International SmallCap Dividend Fund (ARCA:DLS) Institutionell ägarstruktur visar institutioners och fonders nuvarande positioner i företaget, samt de senaste förändringarna i positionernas storlek. Större aktieägare kan vara enskilda investerare, fonder, hedgefonder eller institutioner. Bilaga 13D visar att investeraren äger (eller ägde) mer än 5% av företaget och avser (eller avsåg) att aktivt eftersträva en förändring av affärsstrategin. Schedule 13G indikerar en passiv investering på över 5%.
The share price as of September 11, 2025 is 80,68 / share. Previously, on September 12, 2024, the share price was 66,96 / share. This represents an increase of 20,49% over that period.
Fondsentimentets poäng
Fondsentimentet poängen(fka Ägarackumulation-poäng) visar vilka aktier som är mest köpta av fonder. Det är resultatet av en sofistikerad kvantitativ flerfaktormodell som identifierar företag med de högsta nivåerna av institutionell ackumulering. Poängsättningsmodellen använder en kombination av den totala ökningen av redovisade ägare, förändringarna i portföljallokeringarna för dessa ägare och andra mått. Siffran sträcker sig från 0 till 100, där högre siffror indikerar en högre nivå av ackumulering i förhållande till sina konkurrenter, och 50 är genomsnittet.
Uppdateringsfrekvens: Dagligen
Se Ownership Explorer, som innehåller en lista över de högst rankade företagen.
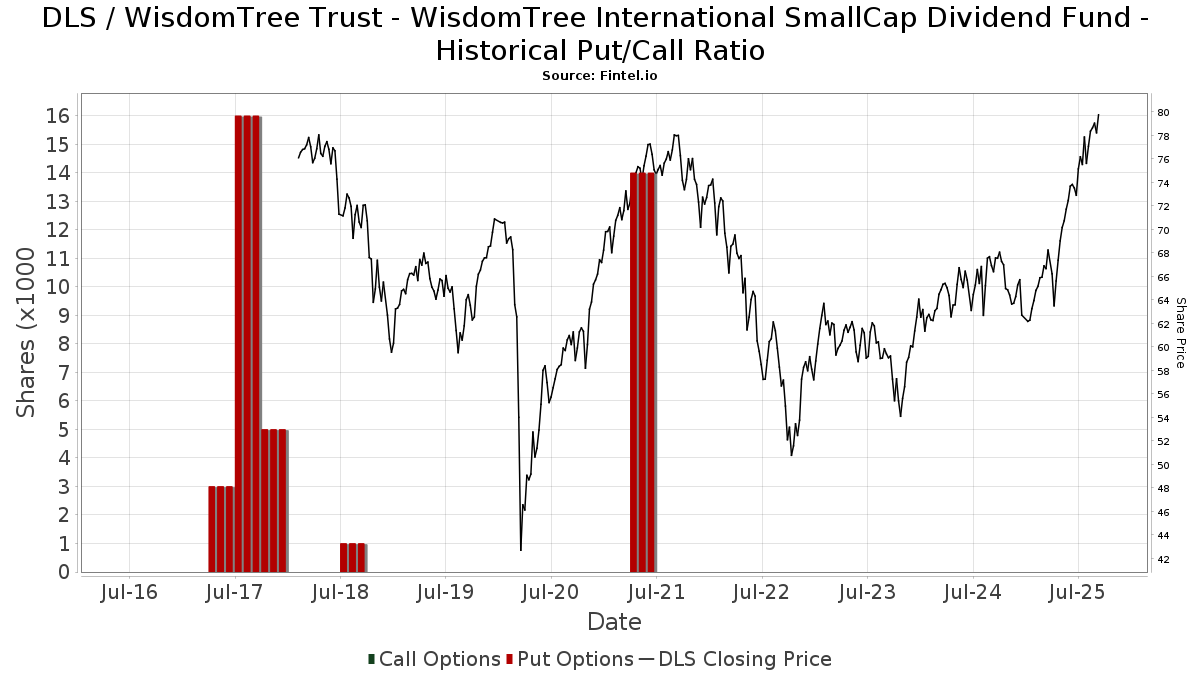
Institutionell sälj/köp-kvot
Förutom att rapportera vanliga eget kapital- och skuldemissioner måste institutioner med mer än 100MM tillgångar under förvaltning också avslöja sina innehav av sälj- och köpoptioner. Eftersom säljoptioner i allmänhet indikerar ett negativt sentiment och köpoptioner indikerar ett positivt sentiment, kan vi få en uppfattning om det övergripande institutionella sentimentet genom att plotta förhållandet mellan säljoptioner och köpoptioner. Diagrammet till höger visar det historiska förhållandet mellan sälj- och köpoptioner för detta instrument.
Genom att använda sälj/köp-kvoten som en indikator på aktieägarnas sentiment undviker man en av de största bristerna med att använda det totala institutionella ägandet, nämligen att en betydande del av de förvaltade tillgångarna investeras passivt för att följa index. Passivt förvaltade fonder köper vanligtvis inte optioner, så indikatorn för sälj/köp-kvoten ger en bättre bild av stämningen i aktivt förvaltade fonder.
13F- och NPORT-arkiveringar
Detaljer om 13F-arkiveringar är gratis. Detaljer om NP-arkiveringar kräver ett premiummedlemskap. Gröna rader indikerar nya positioner. Röda rader indikerar stängda positioner. Klicka på länk symbolen för att se hela transaktionshistoriken.
Uppgradera
för att låsa upp premiumdata och exportera till Excel ![]() .
.
| Fil Datum | Källa | Investerare | Typ | Genomsnittligt pris (beräknat) |
Aktier | Δ Aktier (%) |
Rapporterat värde (1000 USD) |
Δ Värde (%) |
Portföljallokering (%) |
|
|---|---|---|---|---|---|---|---|---|---|---|
| 2025-08-19 | 13F | Newbridge Financial Services Group, Inc. | 100 | 0,00 | 8 | 16,67 | ||||
| 2025-08-12 | 13F | Global Retirement Partners, LLC | 2 850 | 119,23 | 214 | 164,20 | ||||
| 2025-04-30 | 13F | Dogwood Wealth Management LLC | 0 | −100,00 | 0 | |||||
| 2025-07-22 | 13F | Berger Financial Group, Inc | 2 782 | −21,90 | 209 | −11,49 | ||||
| 2025-07-29 | 13F | Signature Estate & Investment Advisors Llc | 8 360 | 1,42 | 628 | 15,26 | ||||
| 2025-07-23 | 13F | REAP Financial Group, LLC | 51 | 0,00 | 4 | 0,00 | ||||
| 2025-07-15 | 13F | FLP Wealth Management, LLC | 0 | −100,00 | 0 | |||||
| 2025-07-16 | 13F | Cove Private Wealth, LLC | 18 325 | 83,25 | 1 376 | 108,48 | ||||
| 2025-08-14 | 13F | Mariner, LLC | 0 | −100,00 | 0 | |||||
| 2025-07-30 | 13F | Princeton Global Asset Management LLC | 653 | −5,77 | 49 | 8,89 | ||||
| 2025-07-21 | 13F | Empirical Financial Services, LLC d.b.a. Empirical Wealth Management | 56 768 | −1,27 | 4 264 | 12,36 | ||||
| 2025-04-28 | 13F | Great Point Wealth Advisors, LLC | 78 914 | −1,18 | 5 209 | 3,60 | ||||
| 2025-07-21 | 13F | Ameritas Advisory Services, LLC | 59 | 4 | ||||||
| 2025-08-13 | 13F | Smith, Moore & Co. | 28 219 | 0,00 | 2 120 | 13,80 | ||||
| 2025-08-14 | 13F | Smartleaf Asset Management LLC | 6 | 0,00 | 0 | |||||
| 2025-08-15 | 13F | Equitable Holdings, Inc. | 12 260 | 2,19 | 921 | 16,31 | ||||
| 2025-08-14 | 13F | Atomi Financial Group, Inc. | 86 162 | −0,90 | 6 472 | 12,77 | ||||
| 2025-07-17 | 13F | Camelot Portfolios, LLC | 7 661 | −8,73 | 575 | 3,79 | ||||
| 2025-08-08 | 13F | Cetera Investment Advisers | 5 364 | −7,36 | 403 | 5,24 | ||||
| 2025-08-13 | 13F | Transce3nd, LLC | 668 | 0,00 | 50 | 13,64 | ||||
| 2025-07-17 | 13F | Sound Income Strategies, LLC | 98 | 0,00 | 7 | 16,67 | ||||
| 2025-05-01 | 13F | Bleakley Financial Group, LLC | 0 | −100,00 | 0 | −100,00 | ||||
| 2025-08-14 | 13F | Colony Group, LLC | 3 091 | −19,59 | 232 | −8,30 | ||||
| 2025-08-12 | 13F | MAI Capital Management | 113 605 | −1,82 | 8 533 | 11,72 | ||||
| 2025-08-14 | 13F | Qube Research & Technologies Ltd | 122 | 0,00 | 9 | 12,50 | ||||
| 2025-08-12 | 13F | SRS Capital Advisors, Inc. | 147 | 11 | ||||||
| 2025-07-24 | 13F | Us Bancorp \de\ | 300 | −76,92 | 23 | −74,12 | ||||
| 2025-08-12 | 13F | Shakespeare Wealth Management, Inc. | 11 376 | −8,79 | 854 | 3,77 | ||||
| 2025-08-12 | 13F | BlackRock, Inc. | 4 099 | 5 593,06 | 308 | 7 575,00 | ||||
| 2025-07-31 | 13F | Buckingham Strategic Partners | 48 366 | −7,88 | 3 633 | 4,82 | ||||
| 2025-08-11 | 13F | Strategic Wealth Partners, Ltd. | 0 | 0 | ||||||
| 2025-08-15 | 13F | Morgan Stanley | 162 461 | −1,74 | 12 202 | 11,82 | ||||
| 2025-07-15 | 13F | Mather Group, Llc. | 7 445 | 0,00 | 559 | 13,85 | ||||
| 2025-08-07 | 13F | WESCAP Management Group, Inc. | 61 499 | −8,25 | 4 619 | 4,41 | ||||
| 2025-07-24 | 13F | Blair William & Co/il | 3 245 | 0,09 | 244 | 13,55 | ||||
| 2025-07-28 | 13F | Ritholtz Wealth Management | 20 818 | −1,23 | 1 564 | 12,37 | ||||
| 2025-08-04 | 13F | Waterfront Wealth Inc. | 54 175 | 1,65 | 4 069 | 15,70 | ||||
| 2025-07-15 | 13F | Bannerman Wealth Management Group, Llc | 3 994 | −4,70 | 300 | 8,33 | ||||
| 2025-07-16 | 13F | Highline Wealth Partners Llc | 171 | 1,79 | 13 | 9,09 | ||||
| 2025-08-06 | 13F | Longview Financial Advisors LLC | 9 992 | −0,37 | 750 | 13,46 | ||||
| 2025-07-15 | 13F | McAdam, LLC | 3 459 | −6,56 | 260 | 6,15 | ||||
| 2025-07-25 | 13F | Cwm, Llc | 617 | 0 | ||||||
| 2025-07-22 | 13F | Windward Private Wealth Management Inc. | 10 425 | −10,04 | 783 | 2,49 | ||||
| 2025-08-11 | 13F | Private Advisor Group, LLC | 4 810 | 13,74 | 361 | 29,39 | ||||
| 2025-08-14 | 13F | AllSquare Wealth Management LLC | 7 280 | 0,00 | 547 | 13,75 | ||||
| 2025-08-11 | 13F | Wealthspire Advisors, LLC | 4 021 | 0,42 | 302 | 14,02 | ||||
| 2025-07-17 | 13F | Alpine Bank Wealth Management | 207 | 16 | ||||||
| 2025-08-15 | 13F | CI Private Wealth, LLC | 57 886 | 100,15 | 4 335 | 127,15 | ||||
| 2025-08-11 | 13F | Principal Securities, Inc. | 562 | −16,99 | 42 | 0,00 | ||||
| 2025-07-14 | 13F | Financial Harvest, LLC | 2 771 | 208 | ||||||
| 2025-08-13 | 13F | IAG Wealth Partners, LLC | 3 596 | −20,76 | 270 | −9,70 | ||||
| 2025-07-24 | 13F | Jfs Wealth Advisors, Llc | 4 378 | 0,53 | 329 | 14,29 | ||||
| 2025-08-13 | 13F | Capital Analysts, Inc. | 11 919 | 21,39 | 1 | |||||
| 2025-08-12 | 13F | Proequities, Inc. | 0 | 0 | ||||||
| 2025-07-23 | 13F | Sachetta, LLC | 0 | −100,00 | 0 | |||||
| 2025-04-17 | 13F | Nbt Bank N A /ny | 0 | −100,00 | 0 | |||||
| 2025-08-14 | 13F | Betterment LLC | 16 028 | 6,63 | 1 | |||||
| 2025-08-18 | 13F/A | National Bank Of Canada /fi/ | 415 | 137,14 | 31 | 181,82 | ||||
| 2025-07-07 | 13F | Discipline Wealth Solutions, LLC | 4 722 | 355 | ||||||
| 2025-08-18 | 13F | Front Row Advisors LLC | 1 664 | 125 | ||||||
| 2025-07-15 | 13F | Fifth Third Bancorp | 3 589 | 0,00 | 270 | 13,98 | ||||
| 2025-08-05 | 13F | Cherry Tree Wealth Management, LLC | 3 189 | −0,72 | 240 | 13,27 | ||||
| 2025-08-14 | 13F | IHT Wealth Management, LLC | 6 078 | −10,72 | 457 | 1,56 | ||||
| 2025-07-09 | 13F | Beacon Financial Group | 2 929 | 220 | ||||||
| 2025-07-24 | 13F | Costello Asset Management, INC | 0 | −100,00 | 0 | |||||
| 2025-08-12 | 13F | Jpmorgan Chase & Co | 3 725 | −46,60 | 280 | −39,35 | ||||
| 2025-08-14 | 13F | Bank Of America Corp /de/ | 181 465 | −7,75 | 13 630 | 4,98 | ||||
| 2025-07-21 | 13F | DHJJ Financial Advisors, Ltd. | 470 | 35 | ||||||
| 2025-08-05 | 13F | GHP Investment Advisors, Inc. | 25 080 | −5,71 | 1 884 | 7,29 | ||||
| 2025-08-14 | 13F | CoreCap Advisors, LLC | 13 640 | −0,48 | 1 025 | 13,27 | ||||
| 2025-08-07 | 13F | Cahill Financial Advisors Inc | 8 131 | 0,84 | 611 | 14,66 | ||||
| 2025-05-28 | 13F/A | Modern Wealth Management, LLC | 3 223 | 206 | ||||||
| 2025-07-15 | 13F | Family Wealth Partners, Llc | 38 685 | −0,21 | 2 906 | 13,57 | ||||
| 2025-07-24 | 13F | True Link Financial Advisors, LLC | 0 | −100,00 | 0 | |||||
| 2025-07-21 | 13F | Crews Bank & Trust | 1 220 | 0,00 | 92 | 13,75 | ||||
| 2025-08-14 | 13F | Fmr Llc | 2 975 | 16,85 | 223 | 32,74 | ||||
| 2025-08-08 | 13F | Creative Planning | 41 691 | −9,17 | 3 131 | 3,37 | ||||
| 2025-08-13 | 13F | Jones Financial Companies Lllp | 19 838 | 2,54 | 1 483 | 14,71 | ||||
| 2025-04-09 | 13F | St Germain D J Co Inc | 0 | 0 | ||||||
| 2025-04-30 | 13F | M&t Bank Corp | 0 | −100,00 | 0 | |||||
| 2025-07-17 | 13F | Montis Financial, LLC | 3 062 | −1,70 | 230 | 11,71 | ||||
| 2025-07-22 | 13F | Checchi Capital Advisers, LLC | 92 096 | −26,87 | 6 917 | −16,77 | ||||
| 2025-08-11 | 13F | Independent Advisor Alliance | 3 000 | 225 | ||||||
| 2025-08-06 | 13F | Modera Wealth Management, LLC | 3 531 | −2,05 | 265 | 11,81 | ||||
| 2025-08-07 | 13F | Howard Bailey Securities, Llc | 38 595 | −3,16 | 2 899 | 10,19 | ||||
| 2025-08-08 | 13F | Larson Financial Group LLC | 21 331 | −15,91 | 1 602 | −4,30 | ||||
| 2025-04-16 | 13F | Smithbridge Asset Management Inc/de | 0 | −100,00 | 0 | |||||
| 2025-07-11 | 13F | Pinnacle Bancorp, Inc. | 170 | 0,00 | 13 | 9,09 | ||||
| 2025-08-04 | 13F | Bristlecone Advisors, LLC | 21 877 | 3,33 | 1 643 | 17,61 | ||||
| 2025-07-15 | 13F | Evanson Asset Management, LLC | 84 915 | 0,33 | 6 378 | 14,16 | ||||
| 2025-09-04 | 13F/A | Advisor Group Holdings, Inc. | 38 283 | 1,15 | 2 877 | 15,13 | ||||
| 2025-08-05 | 13F | Bank Of Montreal /can/ | 64 917 | −3,06 | 4 876 | 10,32 | ||||
| 2025-08-12 | 13F | LPL Financial LLC | 50 013 | −2,52 | 3 756 | 10,93 | ||||
| 2025-05-08 | 13F | Geneos Wealth Management Inc. | 0 | −100,00 | 0 | |||||
| 2025-05-01 | 13F | Quest 10 Wealth Builders, Inc. | 46 | −19,30 | 3 | 0,00 | ||||
| 2025-07-31 | 13F | Glass Jacobson Investment Advisors llc | 0 | −100,00 | 0 | |||||
| 2025-08-12 | 13F | Bokf, Na | 0 | −100,00 | 0 | |||||
| 2025-08-18 | 13F | Hollencrest Capital Management | 1 449 | 0,00 | 109 | 13,68 | ||||
| 2025-08-27 | NP | FFOX - FundX Future Fund Opportunities ETF | 700 | 53 | ||||||
| 2025-08-14 | 13F | Comerica Bank | 4 608 | −5,81 | 346 | 7,45 | ||||
| 2025-08-13 | 13F | Invesco Ltd. | 4 035 | −7,71 | 303 | 5,21 | ||||
| 2025-08-11 | 13F | Bellwether Advisors, LLC | 1 225 | 0,00 | 92 | 15,00 | ||||
| 2025-08-13 | 13F | Congress Wealth Management LLC / DE / | 110 966 | 0,38 | 8 335 | 14,23 | ||||
| 2025-07-25 | 13F | LRI Investments, LLC | 200 354 | −0,99 | 15 049 | 12,68 | ||||
| 2025-08-13 | 13F | Flow Traders U.s. Llc | 0 | −100,00 | 0 | |||||
| 2025-08-05 | 13F | Key FInancial Inc | 400 | 0,00 | 30 | 15,38 | ||||
| 2025-08-06 | 13F | Savant Capital, LLC | 762 754 | −2,80 | 57 290 | 10,62 | ||||
| 2025-08-12 | 13F | Tradition Wealth Management, LLC | 4 447 | 0,00 | 334 | 13,99 | ||||
| 2025-07-08 | 13F | Parallel Advisors, LLC | 500 | 0,00 | 38 | 12,12 | ||||
| 2025-04-09 | 13F | Compass Investment Advisers LLC | 3 342 | 210 | ||||||
| 2025-07-28 | 13F | Harbour Investments, Inc. | 27 898 | 1,77 | 2 095 | 15,81 | ||||
| 2025-08-07 | 13F | Addison Advisors LLC | 17 551 | −9,11 | 1 318 | 3,45 | ||||
| 2025-07-21 | 13F | Ameriflex Group, Inc. | 17 | 0,00 | 1 | 0,00 | ||||
| 2025-04-28 | 13F | Redmont Wealth Advisors Llc | 42 | 3 | ||||||
| 2025-05-13 | 13F | EPG Wealth Management LLC | 0 | −100,00 | 0 | |||||
| 2025-08-06 | 13F | AE Wealth Management LLC | 1 432 | −9,99 | 108 | 2,88 | ||||
| 2025-07-24 | 13F | Morton Brown Family Wealth, LLC | 1 820 | 0,00 | 137 | 13,33 | ||||
| 2025-08-01 | 13F | Liberty Wealth Management Llc | 0 | −100,00 | 0 | |||||
| 2025-08-05 | 13F | Dunhill Financial, LLC | 609 | 46 | ||||||
| 2025-07-17 | 13F | Elwood & Goetz Wealth Advisory Group, LLC | 57 593 | 0,87 | 4 326 | 14,78 | ||||
| 2025-07-25 | 13F | Sequoia Financial Advisors, LLC | 8 635 | −8,85 | 649 | 3,68 | ||||
| 2025-08-14 | 13F | Beaird Harris Wealth Management, LLC | 16 805 | −0,47 | 1 262 | 13,29 | ||||
| 2025-08-14 | 13F | Operose Advisors LLC | 81 | 0,00 | 6 | 20,00 | ||||
| 2025-07-10 | 13F | Wealth Enhancement Advisory Services, Llc | 11 595 | 102,07 | 875 | 131,48 | ||||
| 2025-08-14 | 13F | UBS Group AG | 105 467 | −0,45 | 7 922 | 13,29 | ||||
| 2025-04-21 | 13F | PSI Advisors, LLC | 0 | −100,00 | 0 | |||||
| 2025-08-12 | 13F | Steward Partners Investment Advisory, Llc | 133 | −17,90 | 10 | −10,00 | ||||
| 2025-07-28 | 13F | Fairman Group, LLC | 1 784 | 1,88 | 134 | 22,94 | ||||
| 2025-08-04 | 13F | Creative Financial Designs Inc /adv | 221 | −19,34 | 17 | −11,11 | ||||
| 2025-08-11 | 13F | Synergy Investment Management, LLC | 0 | −100,00 | 0 | |||||
| 2025-07-07 | 13F | Investors Research Corp | 4 756 | −78,71 | 357 | −75,78 | ||||
| 2025-05-08 | 13F | Armis Advisers, LLC | 0 | −100,00 | 0 | |||||
| 2025-08-08 | 13F | Tortoise Investment Management, LLC | 14 319 | 0,00 | 1 076 | 13,76 | ||||
| 2025-08-12 | 13F | Howe & Rusling Inc | 14 | 0,00 | 1 | |||||
| 2025-07-16 | 13F | TCI Wealth Advisors, Inc. | 4 014 | −8,50 | 301 | 4,15 | ||||
| 2025-05-14 | 13F | Wescott Financial Advisory Group, LLC | 0 | −100,00 | 0 | |||||
| 2025-08-12 | 13F | CIBC Private Wealth Group, LLC | 2 398 | −5,29 | 180 | 19,21 | ||||
| 2025-07-08 | 13F | Nbc Securities, Inc. | 206 | 0,00 | 0 | |||||
| 2025-07-17 | 13F | Janney Montgomery Scott LLC | 27 616 | −3,66 | 2 | 100,00 | ||||
| 2025-07-14 | 13F | AdvisorNet Financial, Inc | 59 | 0,00 | 4 | 33,33 | ||||
| 2025-07-03 | 13F | McLean Asset Management Corp | 21 746 | −3,14 | 1 634 | 21,49 | ||||
| 2025-08-06 | 13F | Prospera Financial Services Inc | 18 035 | 1,31 | 1 355 | 15,33 | ||||
| 2025-07-29 | 13F | Marathon Strategic Advisors, LLC | 23 953 | 1,93 | 1 799 | 16,06 | ||||
| 2025-08-29 | 13F | Evolution Wealth Management Inc. | 2 341 | 176 | ||||||
| 2025-08-12 | 13F | O'shaughnessy Asset Management, Llc | 1 511 | −34,53 | 113 | −25,66 | ||||
| 2025-07-25 | 13F | NorthRock Partners, LLC | 0 | −100,00 | 0 | |||||
| 2025-07-24 | 13F | Capital Advisors, Ltd. LLC | 552 | 0,00 | 0 | |||||
| 2025-08-13 | 13F | Russell Investments Group, Ltd. | 106 | 51,43 | 8 | 75,00 | ||||
| 2025-08-11 | 13F | Citigroup Inc | 15 984 | 0,08 | 1 201 | 13,85 | ||||
| 2025-05-15 | 13F | Hrt Financial Lp | 0 | −100,00 | 0 | |||||
| 2025-08-14 | 13F | Citadel Advisors Llc | 31 106 | 376,06 | 2 336 | 442,00 | ||||
| 2025-08-06 | 13F | Commonwealth Equity Services, Llc | 20 568 | −6,70 | 2 | 0,00 | ||||
| 2025-08-08 | 13F | Pinney & Scofield, Inc. | 86 | 0,00 | 6 | 20,00 | ||||
| 2025-07-30 | 13F | Insight Advisors, LLC/ PA | 4 130 | −35,55 | 310 | −26,54 | ||||
| 2025-07-15 | 13F | Total Wealth Planning, Llc | 3 276 | −10,71 | 246 | 1,65 | ||||
| 2025-08-06 | 13F | Csenge Advisory Group | 94 789 | −2,28 | 6 891 | 7,22 | ||||
| 2025-07-17 | 13F | Neumann Capital Management, LLC | 69 221 | −1,76 | 5 199 | 11,81 | ||||
| 2025-07-28 | 13F | Frazier Financial Advisors, LLC | 2 505 | 0,40 | 188 | 14,63 | ||||
| 2025-08-14 | 13F | Susquehanna International Group, Llp | 7 186 | −30,88 | 540 | −21,43 | ||||
| 2025-07-09 | 13F | Hardin Capital Partners, LLC | 5 114 | 31,13 | 383 | 48,64 | ||||
| 2025-07-23 | 13F | Joel Isaacson & Co., LLC | 5 286 | 0,00 | 397 | 14,08 | ||||
| 2025-08-15 | 13F | Kestra Advisory Services, LLC | 44 162 | 9,69 | 3 317 | 24,84 | ||||
| 2025-08-15 | 13F | Captrust Financial Advisors | 2 713 | 204 | ||||||
| 2025-08-05 | 13F | Telos Capital Management, Inc. | 82 581 | 0,58 | 6 203 | 14,45 | ||||
| 2025-08-07 | 13F | Allworth Financial LP | 28 965 | −1,11 | 2 176 | 8,97 | ||||
| 2025-08-19 | 13F | Asset Dedication, LLC | 93 | −28,46 | 7 | −25,00 | ||||
| 2025-07-11 | 13F | Farther Finance Advisors, LLC | 9 984 | −2,91 | 750 | 10,31 | ||||
| 2025-08-13 | 13F | Colonial Trust Co / SC | 568 | −6,73 | 42 | 5,00 | ||||
| 2025-08-12 | 13F | Coldstream Capital Management Inc | 2 773 | 0,00 | 208 | 13,66 | ||||
| 2025-08-14 | 13F | Royal Bank Of Canada | 39 862 | −7,18 | 2 994 | 5,61 | ||||
| 2025-04-24 | 13F | Decker Retirement Planning Inc. | 0 | −100,00 | 0 | |||||
| 2025-07-30 | 13F | Cullen/frost Bankers, Inc. | 1 373 | 0,00 | 103 | 14,44 | ||||
| 2025-08-04 | 13F | Atria Investments Llc | 24 832 | 1,98 | 1 865 | 16,05 | ||||
| 2025-08-08 | 13F | Avantax Advisory Services, Inc. | 9 402 | −5,50 | 706 | 7,62 | ||||
| 2025-08-08 | 13F | Pnc Financial Services Group, Inc. | 0 | −100,00 | 0 | |||||
| 2025-07-25 | 13F | Wealth Architects, LLC | 34 933 | −1,04 | 2 624 | 12,62 | ||||
| 2025-08-13 | 13F | Grove Street Fiduciary, LLC | 51 553 | −6,20 | 3 872 | 6,75 | ||||
| 2025-07-18 | 13F | Impact Capital Partners LLC | 20 738 | 0,84 | 1 558 | 14,74 | ||||
| 2025-08-14 | 13F | Ameriprise Financial Inc | 4 938 | −23,89 | 371 | −13,55 | ||||
| 2025-07-16 | 13F | Vestia Personal Wealth Advisors | 3 321 | 1,31 | 249 | 15,28 | ||||
| 2025-08-13 | 13F | Baird Financial Group, Inc. | 2 954 | 222 | ||||||
| 2025-08-06 | 13F | Quadrant Private Wealth Management, LLC | 5 167 | 0,25 | 388 | 14,12 | ||||
| 2025-08-11 | 13F | Aptus Capital Advisors, LLC | 547 | 0,00 | 41 | 13,89 | ||||
| 2025-08-12 | 13F | Founders Financial Alliance, LLC | 73 | 8,96 | 5 | 25,00 | ||||
| 2025-07-31 | 13F | Kathleen S. Wright Associates Inc. | 29 189 | −0,06 | 2 192 | 13,75 | ||||
| 2025-08-11 | 13F | HighTower Advisors, LLC | 116 177 | −0,13 | 8 726 | 13,65 | ||||
| 2025-08-01 | 13F | Envestnet Asset Management Inc | 14 135 | −6,55 | 1 062 | 6,31 | ||||
| 2025-08-05 | 13F | Integrity Financial Corp /WA | 0 | −100,00 | 0 | |||||
| 2025-07-09 | 13F | Bruce G. Allen Investments, LLC | 14 221 | 0,30 | 1 068 | 14,22 | ||||
| 2025-07-24 | 13F | IFP Advisors, Inc | 1 747 | 0,00 | 131 | 13,91 | ||||
| 2025-07-24 | 13F | Ronald Blue Trust, Inc. | 2 061 | 0,00 | 155 | 13,24 | ||||
| 2025-07-24 | 13F | Williams & Novak, LLC | 5 483 | −0,63 | 412 | 12,91 | ||||
| 2025-08-07 | 13F | Tillman Hartley LLC | 6 492 | 0,03 | 488 | 13,79 | ||||
| 2025-08-08 | 13F | Emerald Investment Partners, Llc | 1 089 | −2,51 | 82 | 10,96 | ||||
| 2025-08-14 | 13F | Stifel Financial Corp | 6 105 | 1,16 | 459 | 15,08 | ||||
| 2025-07-15 | 13F | SJS Investment Consulting Inc. | 39 | 3 | ||||||
| 2025-07-30 | 13F | Crewe Advisors LLC | 245 | 0,00 | 18 | 12,50 | ||||
| 2025-08-08 | 13F | Capital Investment Advisory Services, LLC | 106 | 8 | ||||||
| 2025-08-14 | 13F | Raymond James Financial Inc | 107 315 | 0,62 | 8 060 | 14,50 | ||||
| 2025-08-14 | 13F | Wells Fargo & Company/mn | 72 135 | 14,83 | 5 418 | 30,68 | ||||
| 2025-07-11 | 13F | SILVER OAK SECURITIES, Inc | 12 181 | −5,10 | 915 | 6,65 | ||||
| 2025-07-24 | 13F | Lester Murray Antman dba SimplyRich | 7 896 | 0,00 | 1 | |||||
| 2025-08-04 | 13F | Spire Wealth Management | 12 134 | 0,92 | 911 | 14,88 | ||||
| 2025-08-07 | 13F | Tacita Capital Inc | 1 105 | −11,95 | 83 | 0,00 | ||||
| 2025-08-13 | 13F | Cerity Partners LLC | 6 087 | 10,25 | 457 | 25,55 | ||||
| 2025-07-14 | 13F | Sound Stewardship, LLC | 8 645 | 0,00 | 649 | 13,86 | ||||
| 2025-07-15 | 13F | Alpha Omega Wealth Management LLC | 53 848 | 1,43 | 4 045 | 15,44 | ||||
| 2025-08-13 | 13F | Northwestern Mutual Wealth Management Co | 13 110 | 4,58 | 985 | 18,98 | ||||
| 2025-08-14 | 13F | Warren Averett Asset Management, LLC | 21 668 | −0,39 | 1 627 | 13,38 | ||||
| 2025-08-08 | 13F | Hartland & Co., LLC | 3 828 | 2,41 | 288 | 16,67 | ||||
| 2025-07-25 | 13F | PrairieView Partners, LLC | 59 532 | 13,25 | 4 | 33,33 | ||||
| 2025-08-11 | 13F | One Capital Management, LLC | 5 437 | −11,55 | 408 | 0,74 | ||||
| 2025-08-11 | 13F | Rockbridge Investment Management, LCC | 3 398 | −0,38 | 255 | 13,33 | ||||
| 2025-08-27 | 13F | Stonebridge Wealth Management, LLC | 10 853 | 815 | ||||||
| 2025-08-05 | 13F | Bank of New York Mellon Corp | 2 795 | 210 | ||||||
| 2025-07-14 | 13F | GAMMA Investing LLC | 460 | −46,39 | 35 | −39,29 | ||||
| 2025-07-31 | 13F | Sharper & Granite LLC | 23 910 | −8,91 | 1 797 | 3,70 | ||||
| 2025-08-14 | 13F | Jane Street Group, Llc | 24 373 | −48,17 | 1 831 | −41,02 | ||||
| 2025-07-22 | 13F | Tandem Investment Partners LLC | 28 295 | 2,56 | 2 125 | 16,76 | ||||
| 2025-08-12 | 13F | AlphaCore Capital LLC | 185 | −75,50 | 14 | −73,47 | ||||
| 2025-08-12 | 13F | Heartland Advisors Inc | 0 | −100,00 | 0 | |||||
| 2025-07-23 | 13F | Viewpoint Capital Management LLC | 6 441 | −0,46 | 484 | 13,11 | ||||
| 2025-07-31 | 13F | BIP Wealth, LLC | 274 694 | −2,92 | 20 632 | 10,49 | ||||
| 2025-07-10 | 13F | Envision Financial LLC | 9 127 | 1,18 | 686 | 15,13 | ||||
| 2025-05-08 | 13F | FSA Advisors, Inc. | 0 | −100,00 | 0 | −100,00 | ||||
| 2025-07-08 | 13F | Apella Capital, LLC | 5 706 | 0,00 | 426 | 17,68 | ||||
| 2025-08-19 | 13F | Advisory Services Network, LLC | 5 992 | −2,87 | 452 | 10,81 |