Grundläggande statistik
| Institutionella ägare | 214 total, 212 long only, 0 short only, 2 long/short - change of 21,59% MRQ |
| Genomsnittlig portföljallokering | 0.2188 % - change of 70,17% MRQ |
| Institutionella aktier (lång) | 12 382 994 (ex 13D/G) - change of 3,22MM shares 35,10% MRQ |
| Institutionellt värde (lång) | $ 345 858 USD ($1000) |
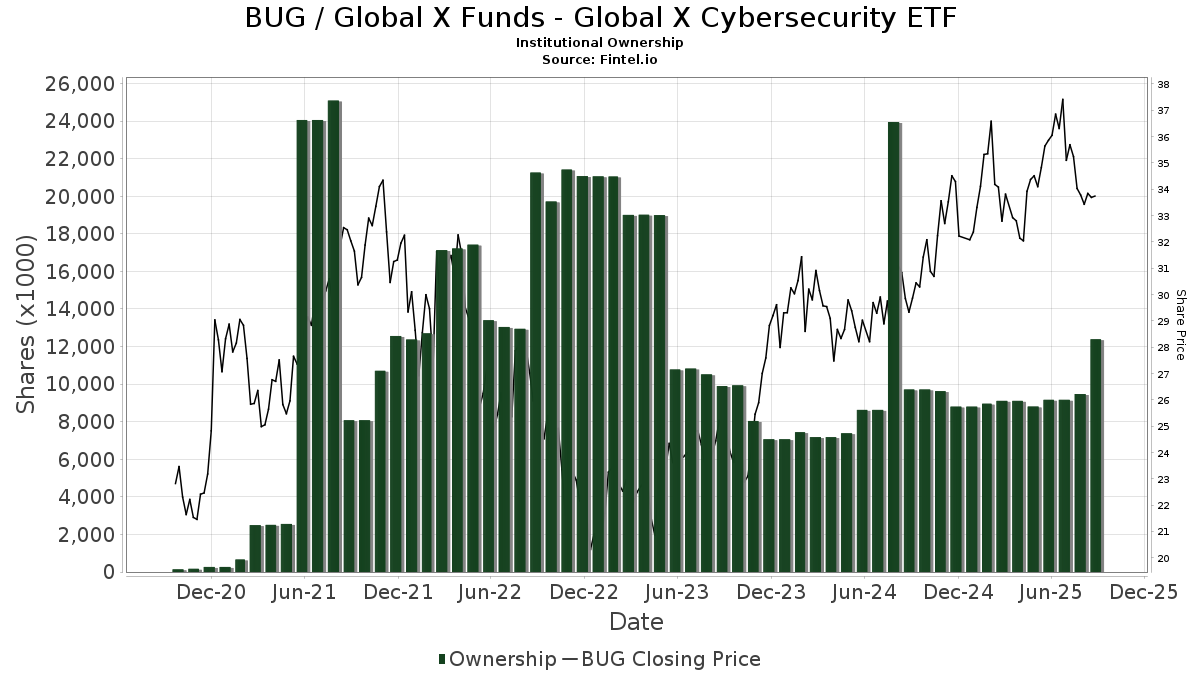
Institutionellt ägande och aktieägare
Global X Funds - Global X Cybersecurity ETF (US:BUG) har 214 Institutionella ägare och aktieägare som har lämnat in 13D/G- eller 13F-formulär till Securities Exchange Commission (SEC). Dessa institut innehar totalt 12,382,994 aktier. Största aktieägare inkluderar Clal Insurance Enterprises Holdings Ltd, Moss Adams Wealth Advisors LLC, Morgan Stanley, LPL Financial LLC, Edmond De Rothschild Holding S.a., Raymond James Financial Inc, Mirae Asset Global Investments Co., Ltd., Bank Of America Corp /de/, Cetera Investment Advisers, and Royal Bank Of Canada .
Global X Funds - Global X Cybersecurity ETF (NasdaqGM:BUG) Institutionell ägarstruktur visar institutioners och fonders nuvarande positioner i företaget, samt de senaste förändringarna i positionernas storlek. Större aktieägare kan vara enskilda investerare, fonder, hedgefonder eller institutioner. Bilaga 13D visar att investeraren äger (eller ägde) mer än 5% av företaget och avser (eller avsåg) att aktivt eftersträva en förändring av affärsstrategin. Schedule 13G indikerar en passiv investering på över 5%.
The share price as of September 8, 2025 is 34,74 / share. Previously, on September 9, 2024, the share price was 29,01 / share. This represents an increase of 19,75% over that period.
Fondsentimentets poäng
Fondsentimentet poängen(fka Ägarackumulation-poäng) visar vilka aktier som är mest köpta av fonder. Det är resultatet av en sofistikerad kvantitativ flerfaktormodell som identifierar företag med de högsta nivåerna av institutionell ackumulering. Poängsättningsmodellen använder en kombination av den totala ökningen av redovisade ägare, förändringarna i portföljallokeringarna för dessa ägare och andra mått. Siffran sträcker sig från 0 till 100, där högre siffror indikerar en högre nivå av ackumulering i förhållande till sina konkurrenter, och 50 är genomsnittet.
Uppdateringsfrekvens: Dagligen
Se Ownership Explorer, som innehåller en lista över de högst rankade företagen.
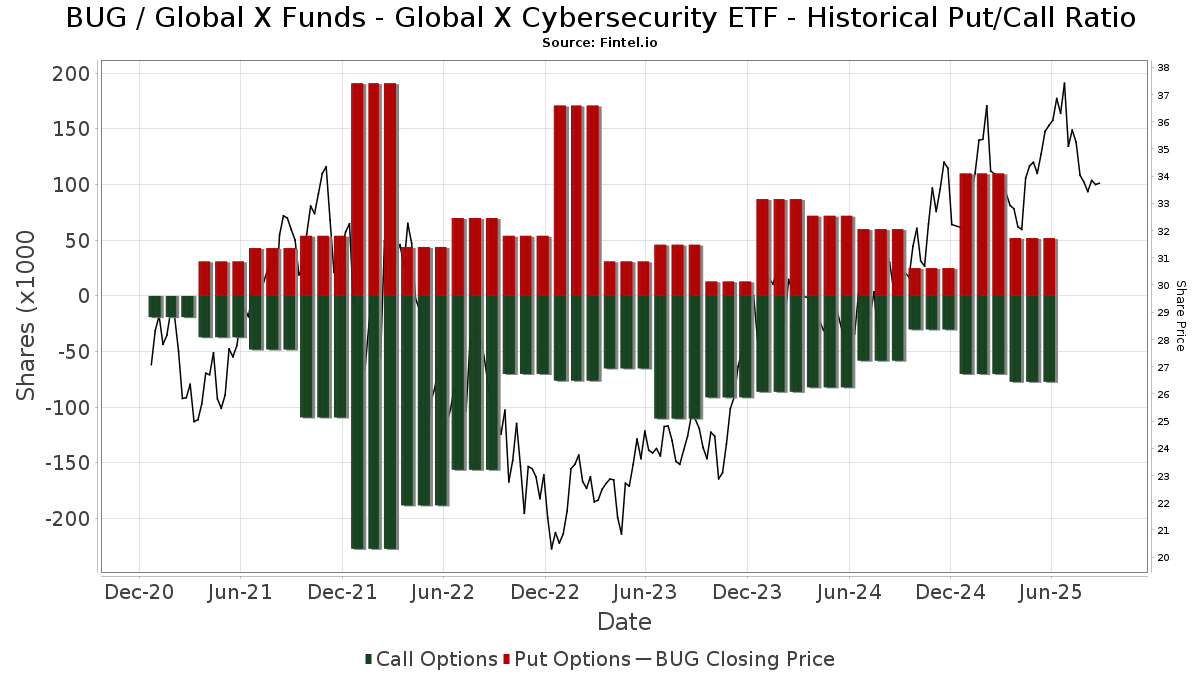
Institutionell sälj/köp-kvot
Förutom att rapportera vanliga eget kapital- och skuldemissioner måste institutioner med mer än 100MM tillgångar under förvaltning också avslöja sina innehav av sälj- och köpoptioner. Eftersom säljoptioner i allmänhet indikerar ett negativt sentiment och köpoptioner indikerar ett positivt sentiment, kan vi få en uppfattning om det övergripande institutionella sentimentet genom att plotta förhållandet mellan säljoptioner och köpoptioner. Diagrammet till höger visar det historiska förhållandet mellan sälj- och köpoptioner för detta instrument.
Genom att använda sälj/köp-kvoten som en indikator på aktieägarnas sentiment undviker man en av de största bristerna med att använda det totala institutionella ägandet, nämligen att en betydande del av de förvaltade tillgångarna investeras passivt för att följa index. Passivt förvaltade fonder köper vanligtvis inte optioner, så indikatorn för sälj/köp-kvoten ger en bättre bild av stämningen i aktivt förvaltade fonder.
13F- och NPORT-arkiveringar
Detaljer om 13F-arkiveringar är gratis. Detaljer om NP-arkiveringar kräver ett premiummedlemskap. Gröna rader indikerar nya positioner. Röda rader indikerar stängda positioner. Klicka på länk symbolen för att se hela transaktionshistoriken.
Uppgradera
för att låsa upp premiumdata och exportera till Excel ![]() .
.
| Fil Datum | Källa | Investerare | Typ | Genomsnittligt pris (beräknat) |
Aktier | Δ Aktier (%) |
Rapporterat värde (1000 USD) |
Δ Värde (%) |
Portföljallokering (%) |
|
|---|---|---|---|---|---|---|---|---|---|---|
| 2025-08-12 | 13F | Integras Partners LLC | 12 151 | 42,67 | 451 | 63,64 | ||||
| 2025-07-18 | 13F | Truist Financial Corp | 7 424 | 275 | ||||||
| 2025-08-14 | 13F | IHT Wealth Management, LLC | 14 910 | 3,81 | 553 | 19,18 | ||||
| 2025-07-17 | 13F | Archford Capital Strategies, LLC | 6 503 | −41,35 | 241 | −32,68 | ||||
| 2025-08-14 | 13F | Qube Research & Technologies Ltd | 17 024 | 632 | ||||||
| 2025-08-12 | 13F | Stelac Advisory Services LLC | 7 709 | −24,83 | 286 | −13,60 | ||||
| 2025-07-21 | 13F | Sterling Investment Counsel, LLC | 18 922 | −13,99 | 702 | −1,27 | ||||
| 2025-08-05 | 13F | C2P Capital Advisory Group, LLC d.b.a. Prosperity Capital Advisors | 11 967 | 14,06 | 444 | 29,53 | ||||
| 2025-05-09 | 13F | GeoWealth Management, LLC | 0 | −100,00 | 0 | |||||
| 2025-08-12 | 13F | Jpmorgan Chase & Co | 125 424 | 36,76 | 4 653 | 56,93 | ||||
| 2025-08-18 | 13F | Wolverine Trading, Llc | 0 | −100,00 | 0 | −100,00 | ||||
| 2025-07-31 | 13F | Guardian Asset Advisors, LLC | 13 921 | −2,98 | 517 | 11,21 | ||||
| 2025-08-06 | 13F | Atlantic Union Bankshares Corp | 775 | 29 | ||||||
| 2025-05-16 | 13F | Jones Financial Companies Lllp | 0 | −100,00 | 0 | |||||
| 2025-08-01 | 13F | Oarsman Capital, Inc. | 65 579 | 29,97 | 2 433 | 49,11 | ||||
| 2025-07-30 | 13F | Caliber Wealth Management, LLC / KS | 11 750 | 0,00 | 436 | 14,78 | ||||
| 2025-08-11 | 13F | Private Advisor Group, LLC | 23 961 | 8,13 | 889 | 24,02 | ||||
| 2025-07-25 | 13F | Concurrent Investment Advisors, LLC | 9 158 | 340 | ||||||
| 2025-08-14 | 13F | Paragon Private Wealth Management, LLC | 9 589 | 356 | ||||||
| 2025-08-29 | 13F | Total Investment Management Inc | 306 | 11 | ||||||
| 2025-07-16 | 13F | Ayalon Holdings Ltd. | 10 169 | 0,00 | 0 | |||||
| 2025-07-21 | 13F | Ameriflex Group, Inc. | 1 656 | −77,36 | 61 | −74,15 | ||||
| 2025-07-03 | 13F | Garde Capital, Inc. | 26 | 0,00 | 1 | |||||
| 2025-08-14 | 13F | Ameriprise Financial Inc | 62 996 | −8,02 | 2 337 | 5,60 | ||||
| 2025-04-21 | 13F | ERn Financial, LLC | 0 | −100,00 | 0 | |||||
| 2025-08-13 | 13F | Continuum Advisory, LLC | 0 | −100,00 | 0 | |||||
| 2025-08-04 | 13F | Spire Wealth Management | 23 252 | −6,34 | 863 | 7,48 | ||||
| 2025-07-31 | 13F | Cambridge Investment Research Advisors, Inc. | 74 311 | −9,78 | 3 | 0,00 | ||||
| 2025-08-15 | 13F | Equitable Holdings, Inc. | 5 486 | −38,50 | 204 | −29,51 | ||||
| 2025-08-07 | 13F | Resources Investment Advisors, LLC. | 25 863 | 9,80 | 960 | 26,02 | ||||
| 2025-08-05 | 13F | Bank Of Montreal /can/ | 6 587 | −13,47 | 244 | −0,81 | ||||
| 2025-08-05 | 13F | Dunhill Financial, LLC | 60 | 0,00 | 2 | 100,00 | ||||
| 2025-08-12 | 13F | MAI Capital Management | 7 643 | 7,04 | 284 | 23,04 | ||||
| 2025-07-08 | 13F | Parallel Advisors, LLC | 531 | −39,38 | 20 | −32,14 | ||||
| 2025-07-10 | 13F | Wealth Enhancement Advisory Services, Llc | 13 561 | 504 | ||||||
| 2025-07-17 | 13F | Spectrum Strategic Capital Management, LLC | 40 869 | 1 516 | ||||||
| 2025-08-14 | 13F | Ancora Advisors, LLC | 2 121 | 0,00 | 79 | 14,71 | ||||
| 2025-08-08 | 13F | Phoenix Wealth Advisors | 30 903 | −0,97 | 1 147 | 13,58 | ||||
| 2025-08-11 | 13F | HighTower Advisors, LLC | 145 101 | 3,95 | 5 383 | 19,25 | ||||
| 2025-07-16 | 13F | Dakota Wealth Management | 32 938 | −12,21 | 1 222 | 0,74 | ||||
| 2025-07-16 | 13F | Perigon Wealth Management, LLC | 6 142 | 228 | ||||||
| 2025-08-14 | 13F | Citadel Advisors Llc | Put | 19 300 | 9,66 | 716 | 25,83 | |||
| 2025-07-11 | 13F | WealthBridge Investment Counsel Inc. | 99 100 | 1,75 | 4 | 0,00 | ||||
| 2025-08-14 | 13F | Citadel Advisors Llc | Call | 26 600 | 95,59 | 987 | 124,60 | |||
| 2025-07-07 | 13F | OMNI 360 Wealth, Inc. | 9 603 | 356 | ||||||
| 2025-08-14 | 13F | Citadel Advisors Llc | 9 907 | −47,66 | 368 | −40,03 | ||||
| 2025-07-28 | 13F | Harbour Investments, Inc. | 1 254 | −35,53 | 47 | −25,81 | ||||
| 2025-08-13 | 13F | VestGen Advisors, LLC | 10 264 | −8,75 | 353 | −2,75 | ||||
| 2025-08-04 | 13F | Whalen Wealth Management Inc. | 0 | −100,00 | 0 | |||||
| 2025-08-11 | 13F | TD Waterhouse Canada Inc. | 0 | −100,00 | 0 | |||||
| 2025-04-30 | 13F | Alpha Cubed Investments, LLC | 0 | −100,00 | 0 | |||||
| 2025-08-08 | 13F | Cetera Investment Advisers | 258 043 | 18,71 | 9 573 | 36,19 | ||||
| 2025-08-18 | 13F | Wolverine Trading, Llc | Call | 10 600 | 388 | |||||
| 2025-08-12 | 13F | Trexquant Investment LP | 7 454 | −10,12 | 277 | 2,99 | ||||
| 2025-07-18 | 13F | Trust Co Of Vermont | 44 | 0,00 | 2 | 0,00 | ||||
| 2025-08-07 | 13F | Nwam Llc | 93 881 | 3 308 | ||||||
| 2025-07-24 | 13F | Us Bancorp \de\ | 337 | 0,00 | 13 | 20,00 | ||||
| 2025-08-18 | 13F | Geneos Wealth Management Inc. | 185 | 0,00 | 7 | 20,00 | ||||
| 2025-07-24 | 13F | IFP Advisors, Inc | 9 591 | −7,60 | 356 | 5,97 | ||||
| 2025-08-18 | 13F | Wolverine Trading, Llc | Put | 0 | −100,00 | 0 | −100,00 | |||
| 2025-05-09 | 13F | Delta Financial Group, Inc. | 8 783 | −0,55 | 0 | |||||
| 2025-08-08 | 13F | SBI Securities Co., Ltd. | 7 025 | −0,69 | 261 | 14,04 | ||||
| 2025-07-17 | 13F | Albion Financial Group /ut | 80 | 0,00 | 3 | 0,00 | ||||
| 2025-07-30 | 13F | Bleakley Financial Group, LLC | 23 608 | 8,86 | 876 | 24,82 | ||||
| 2025-08-13 | 13F | Northwestern Mutual Wealth Management Co | 114 077 | 3,89 | 4 232 | 19,21 | ||||
| 2025-05-15 | 13F | Tower Research Capital LLC (TRC) | 0 | −100,00 | 0 | |||||
| 2025-08-14 | 13F | CoreCap Advisors, LLC | 624 | 488,68 | 23 | 666,67 | ||||
| 2025-07-14 | 13F | Sowell Financial Services LLC | 83 077 | 423,91 | 3 082 | 501,95 | ||||
| 2025-08-05 | 13F | Fourth Dimension Wealth, LLC | 4 | 0,00 | 0 | |||||
| 2025-07-24 | 13F | Robertson Stephens Wealth Management, LLC | 8 641 | −1,26 | 321 | 13,07 | ||||
| 2025-08-12 | 13F | Fairscale Capital, LLC | 747 | 0,00 | 26 | 4,17 | ||||
| 2025-09-04 | 13F/A | Advisor Group Holdings, Inc. | 94 797 | −36,21 | 3 515 | −26,88 | ||||
| 2025-08-08 | 13F | Capital Investment Advisory Services, LLC | 1 300 | 0,00 | 48 | 14,29 | ||||
| 2025-08-14 | 13F | Raymond James Financial Inc | 398 117 | 1,46 | 14 770 | 16,39 | ||||
| 2025-08-14 | 13F | TCG Advisory Services, LLC | 11 583 | −7,13 | 430 | 6,45 | ||||
| 2025-08-14 | 13F | Snowden Capital Advisors LLC | 8 968 | −35,75 | 333 | −26,39 | ||||
| 2025-04-25 | 13F | Joel Isaacson & Co., LLC | 0 | −100,00 | 0 | |||||
| 2025-07-30 | 13F | Insight Advisors, LLC/ PA | 16 361 | −12,96 | 607 | −0,16 | ||||
| 2025-08-13 | 13F | Cresset Asset Management, LLC | 13 187 | 9,24 | 489 | 25,38 | ||||
| 2025-08-12 | 13F | Laurel Wealth Advisors LLC | 7 420 | 3 610,00 | 0 | −100,00 | ||||
| 2025-08-12 | 13F | FourThought Financial Partners, LLC | 10 772 | 0,00 | 400 | 14,66 | ||||
| 2025-08-14 | 13F | Comerica Bank | 4 484 | 3,08 | 166 | 18,57 | ||||
| 2025-08-14 | 13F | Gerber Kawasaki Wealth & Investment Management | 5 636 | 209 | ||||||
| 2025-08-14 | 13F | MIRAE ASSET GLOBAL ETFS HOLDINGS Ltd. | 102 289 | 118,35 | 3 795 | 150,43 | ||||
| 2025-07-16 | 13F | Advisors Management Group Inc /adv | 28 522 | −0,08 | 1 | |||||
| 2025-08-14 | 13F | CIBC World Markets Inc. | 130 429 | 1,88 | 4 839 | 16,86 | ||||
| 2025-08-12 | 13F | Deutsche Bank Ag\ | 30 | 1 | ||||||
| 2025-07-25 | 13F | Atria Wealth Solutions, Inc. | 0 | −100,00 | 0 | |||||
| 2025-05-15 | 13F | Glenmede Trust Co Na | 1 740 | 0,00 | 56 | 1,82 | ||||
| 2025-08-14 | 13F | Mariner, LLC | 41 575 | 5,67 | 1 542 | 21,23 | ||||
| 2025-05-16 | 13F | Coordinated Financial Services, Inc./CO | 0 | −100,00 | 0 | |||||
| 2025-07-15 | 13F | Fifth Third Bancorp | 9 244 | 0,00 | 343 | 14,77 | ||||
| 2025-08-13 | 13F | Twin Peaks Wealth Advisors, LLC | 1 016 | 34 | ||||||
| 2025-08-13 | 13F | Empire Financial Management Company, LLC | 10 056 | −40,85 | 373 | −32,06 | ||||
| 2025-08-13 | 13F | Mount Yale Investment Advisors, LLC | 801 | 30 | ||||||
| 2025-05-14 | 13F | CIBC Private Wealth Group, LLC | 0 | −100,00 | 0 | −100,00 | ||||
| 2025-08-13 | 13F | Scotia Capital Inc. | 21 688 | 805 | ||||||
| 2025-07-16 | 13F | TigerOak Management, L.L.C. | 96 632 | −0,03 | 3 585 | 14,72 | ||||
| 2025-08-12 | 13F | Proequities, Inc. | 0 | 0 | ||||||
| 2025-05-16 | 13F | McIlrath & Eck, LLC | 0 | −100,00 | 0 | |||||
| 2025-07-14 | 13F | Painted Porch Advisors LLC | 22 | −67,65 | 1 | −100,00 | ||||
| 2025-04-21 | 13F | Trivant Custom Portfolio Group, LLC | 0 | −100,00 | 0 | |||||
| 2025-08-14 | 13F | Mml Investors Services, Llc | 49 945 | −33,90 | 2 | −50,00 | ||||
| 2025-08-13 | 13F | Russell Investments Group, Ltd. | 23 | 1 | ||||||
| 2025-07-29 | 13F | Werba Rubin Papier Wealth Management | 5 396 | 200 | ||||||
| 2025-08-15 | 13F | Morgan Stanley | 1 116 401 | 24,19 | 41 419 | 42,47 | ||||
| 2025-05-20 | 13F/A | Colony Group, LLC | 0 | −100,00 | 0 | |||||
| 2025-08-15 | 13F | Provenance Wealth Advisors, LLC | 18 526 | 134,77 | 687 | 169,41 | ||||
| 2025-07-11 | 13F | Farther Finance Advisors, LLC | 0 | −100,00 | 0 | |||||
| 2025-08-29 | 13F | Centaurus Financial, Inc. | 4 952 | 0 | ||||||
| 2025-08-14 | 13F | Susquehanna International Group, Llp | 0 | −100,00 | 0 | |||||
| 2025-07-25 | 13F | Hazlett, Burt & Watson, Inc. | 17 983 | −1,19 | 1 | |||||
| 2025-05-12 | 13F | Citigroup Inc | 0 | −100,00 | 0 | |||||
| 2025-08-14 | 13F | Group One Trading, L.p. | 4 507 | 347,57 | 167 | 421,88 | ||||
| 2025-08-14 | 13F/A | Rockefeller Capital Management L.P. | 11 359 | 2,39 | 421 | 17,60 | ||||
| 2025-07-30 | 13F | Brookstone Capital Management | 16 177 | 143,26 | 600 | 179,07 | ||||
| 2025-05-09 | 13F | McClarren Financial Advisors, Inc. | 0 | −100,00 | 0 | |||||
| 2025-08-12 | 13F | Calton & Associates, Inc. | 5 905 | 219 | ||||||
| 2025-04-25 | 13F | Verity Asset Management, Inc. | 0 | −100,00 | 0 | −100,00 | ||||
| 2025-07-31 | 13F | Pinnacle Wealth Management Group, Inc. | 74 137 | 2,60 | 2 750 | 17,72 | ||||
| 2025-08-14 | 13F | NCM Capital Management, LLC | 30 826 | 6,80 | 1 140 | 22,19 | ||||
| 2025-07-23 | 13F | Eagle Strategies LLC | 21 955 | −0,17 | 815 | 14,49 | ||||
| 2025-08-14 | 13F | Camden Capital, LLC | 25 360 | 0,00 | 941 | 14,63 | ||||
| 2025-08-11 | 13F/A | Purus Wealth Management, LLC | 6 351 | −0,83 | 236 | 13,53 | ||||
| 2025-08-11 | 13F | Intrepid Financial Planning Group LLC | 13 203 | −3,61 | 490 | 10,63 | ||||
| 2025-08-14 | 13F | Wells Fargo & Company/mn | 1 177 | 503,59 | 44 | 616,67 | ||||
| 2025-07-14 | 13F | Park Avenue Securities Llc | 34 366 | −28,32 | 1 | 0,00 | ||||
| 2025-07-28 | 13F | Triton Wealth Management, PLLC | 18 350 | 653 | ||||||
| 2025-08-05 | 13F | GPS Wealth Strategies Group, LLC | 3 729 | 153,16 | 138 | 193,62 | ||||
| 2025-07-22 | 13F | Team Financial Group, LLC | 2 566 | 95 | ||||||
| 2025-08-05 | 13F | EPG Wealth Management LLC | 0 | −100,00 | 0 | |||||
| 2025-08-08 | 13F | Pnc Financial Services Group, Inc. | 74 500 | −7,82 | 2 764 | 5,74 | ||||
| 2025-07-15 | 13F | Aspire Capital Advisors LLC | 60 238 | 2 235 | ||||||
| 2025-08-04 | 13F | Creative Financial Designs Inc /adv | 4 734 | −24,18 | 176 | −12,94 | ||||
| 2025-08-01 | 13F | GoalVest Advisory LLC | 50 | 0,00 | 2 | 0,00 | ||||
| 2025-08-07 | 13F | Winch Advisory Services, LLC | 576 | 0,00 | 21 | 16,67 | ||||
| 2025-08-12 | 13F | O'shaughnessy Asset Management, Llc | 420 | −13,40 | 16 | 0,00 | ||||
| 2025-08-14 | 13F | Jupiter Wealth Management LLC | 5 000 | 169 | ||||||
| 2025-08-12 | 13F | Franklin Resources Inc | 7 628 | 0,00 | 283 | 14,63 | ||||
| 2025-08-26 | NP | USAF - Atlas America Fund | 12 674 | 470 | ||||||
| 2025-07-21 | 13F | Credential Qtrade Securities Inc. | 0 | −100,00 | 0 | −100,00 | ||||
| 2025-08-19 | 13F | Advisory Services Network, LLC | 17 414 | 20,40 | 603 | 29,12 | ||||
| 2025-08-04 | 13F | Migdal Insurance & Financial Holdings Ltd. | 19 000 | −24,00 | 1 | |||||
| 2025-07-29 | 13F | Stratos Wealth Partners, LTD. | 48 654 | 2,50 | 1 805 | 17,59 | ||||
| 2025-08-12 | 13F | Global Retirement Partners, LLC | 761 | −6,17 | 28 | 7,69 | ||||
| 2025-08-14 | 13F | Goldman Sachs Group Inc | 11 983 | 445 | ||||||
| 2025-08-05 | 13F | Harel Insurance Investments & Financial Services Ltd. | 1 | 0,00 | 0 | |||||
| 2025-07-14 | 13F | Armstrong Advisory Group, Inc | 2 028 | 75 | ||||||
| 2025-08-04 | 13F | L.m. Kohn & Company | 5 532 | 205 | ||||||
| 2025-08-12 | 13F | Edmond De Rothschild Holding S.a. | 403 016 | 3,71 | 14 952 | 18,97 | ||||
| 2025-08-12 | 13F | AlphaCore Capital LLC | 200 | 7 | ||||||
| 2025-07-09 | 13F | WealthCare Investment Partners, LLC | 5 530 | 205 | ||||||
| 2025-08-11 | 13F | Principal Securities, Inc. | 1 198 | 32,08 | 44 | 51,72 | ||||
| 2025-08-06 | 13F | Black Swift Group, LLC | 15 360 | −20,66 | 570 | −9,11 | ||||
| 2025-05-15 | 13F | Vident Advisory, LLC | 0 | −100,00 | 0 | −100,00 | ||||
| 2025-07-24 | 13F | Stonebridge Financial Group, LLC | 0 | −100,00 | 0 | |||||
| 2025-07-22 | 13F | Accel Wealth Management | 21 512 | −4,76 | 798 | 9,32 | ||||
| 2025-08-13 | 13F | Beacon Pointe Advisors, LLC | 11 022 | 0,00 | 409 | 14,61 | ||||
| 2025-08-04 | 13F | Atria Investments Llc | 6 119 | 227 | ||||||
| 2025-08-06 | 13F | Golden State Wealth Management, LLC | 500 | 0,00 | 19 | 12,50 | ||||
| 2025-08-14 | 13F | Cubist Systematic Strategies, LLC | 28 964 | 1 075 | ||||||
| 2025-08-13 | 13F | Cheviot Value Management, LLC | 600 | 100,00 | 19 | 90,00 | ||||
| 2025-08-04 | 13F | Joseph P. Lucia & Associates, LLC | 20 825 | 17,54 | 773 | 34,97 | ||||
| 2025-08-12 | 13F | BlackRock, Inc. | 650 | 24 | ||||||
| 2025-08-13 | 13F | Smith, Moore & Co. | 5 721 | 212 | ||||||
| 2025-08-11 | 13F | Farrow Financial Inc. | 75 779 | −0,65 | 2 811 | 13,99 | ||||
| 2025-07-21 | 13F | Ameritas Advisory Services, LLC | 7 793 | 16,07 | 289 | 34,42 | ||||
| 2025-07-17 | 13F | Grandview Asset Management LLC | 34 887 | 90,31 | 1 | |||||
| 2025-08-14 | 13F | Harwood Advisory Group, LLC | 279 | −1,06 | 10 | 11,11 | ||||
| 2025-07-30 | 13F | Atlantic Edge Private Wealth Management, LLC | 100 | 4 | ||||||
| 2025-08-07 | 13F | Greystone Financial Group, LLC | 12 331 | −0,34 | 457 | 14,25 | ||||
| 2025-08-06 | 13F | Commonwealth Equity Services, Llc | 102 973 | 8,66 | 4 | 0,00 | ||||
| 2025-08-15 | 13F | Captrust Financial Advisors | 5 926 | 220 | ||||||
| 2025-08-05 | 13F | Simplex Trading, Llc | 7 131 | 22,84 | 0 | |||||
| 2025-07-15 | 13F | North Star Investment Management Corp. | 6 320 | 9,53 | 234 | 25,81 | ||||
| 2025-08-14 | 13F | Bank Of America Corp /de/ | 310 249 | −10,96 | 11 510 | 2,16 | ||||
| 2025-05-12 | 13F | Founders Financial Alliance, LLC | 0 | −100,00 | 0 | −100,00 | ||||
| 2025-08-14 | 13F | Glenmede Investment Management, LP | 1 740 | 65 | ||||||
| 2025-08-14 | 13F | Stifel Financial Corp | 51 762 | 24,72 | 1 920 | 43,07 | ||||
| 2025-08-14 | 13F | UBS Group AG | 123 401 | 40,42 | 4 578 | 61,08 | ||||
| 2025-08-26 | 13F | Nautilus Advisors LLC | 10 640 | 395 | ||||||
| 2025-08-01 | 13F | Bessemer Group Inc | 0 | −100,00 | 0 | |||||
| 2025-07-18 | 13F | O'ROURKE & COMPANY, Inc | 17 275 | 0,25 | 641 | 14,90 | ||||
| 2025-07-25 | 13F | Cwm, Llc | 5 391 | 0,00 | 0 | |||||
| 2025-07-29 | 13F | Ballast, Inc. | 20 825 | 773 | ||||||
| 2025-08-13 | 13F | Congress Wealth Management LLC / DE / | 20 007 | 2,82 | 742 | 15,22 | ||||
| 2025-05-02 | 13F | Bogart Wealth, LLC | 0 | 0 | ||||||
| 2025-08-07 | 13F | Allworth Financial LP | 5 385 | 12,12 | 200 | 25,95 | ||||
| 2025-08-07 | 13F | Parkside Financial Bank & Trust | 40 | 0,00 | 1 | 0,00 | ||||
| 2025-08-05 | 13F | Claro Advisors LLC | 6 710 | −1,54 | 249 | 12,73 | ||||
| 2025-08-08 | 13F | Tortoise Investment Management, LLC | 100 | 4 | ||||||
| 2025-08-13 | 13F | Marshall Wace, Llp | 11 403 | −10,23 | 423 | 3,17 | ||||
| 2025-08-12 | 13F | Change Path, LLC | 19 073 | −21,57 | 708 | −10,05 | ||||
| 2025-08-12 | 13F | LPL Financial LLC | 903 796 | 60,29 | 33 531 | 83,89 | ||||
| 2025-08-01 | 13F | Envestnet Asset Management Inc | 114 313 | 29,10 | 4 241 | 48,13 | ||||
| 2025-08-14 | 13F | Sei Investments Co | 6 463 | 240 | ||||||
| 2025-07-31 | 13F | CVA Family Office, LLC | 30 | 0,00 | 1 | |||||
| 2025-08-06 | 13F | AE Wealth Management LLC | 126 | −93,23 | 5 | −93,33 | ||||
| 2025-08-14 | 13F | Potentia Wealth | 0 | −100,00 | 0 | |||||
| 2025-08-15 | 13F | Northeast Financial Consultants Inc | 40 450 | 0,00 | 1 501 | 14,68 | ||||
| 2025-08-14 | 13F | Fmr Llc | 6 414 | −14,31 | 238 | −2,07 | ||||
| 2025-07-02 | 13F | HBW Advisory Services LLC | 16 608 | −2,09 | 616 | 12,41 | ||||
| 2025-07-17 | 13F | Guyasuta Investment Advisors Inc | 6 200 | 230 | ||||||
| 2025-04-21 | 13F | Nelson, Van Denburg & Campbell Wealth Management Group, LLC | 0 | −100,00 | 0 | |||||
| 2025-07-30 | 13F | Phoenix Holdings Ltd. | 12 834 | −56,81 | 476 | −50,42 | ||||
| 2025-07-08 | 13F | Granite Bay Wealth Management, LLC | 41 204 | −27,99 | 2 | 0,00 | ||||
| 2025-07-24 | 13F | Aurora Private Wealth, Inc. | 0 | −100,00 | 0 | |||||
| 2025-08-11 | 13F | Aptus Capital Advisors, LLC | 1 092 | 0,00 | 41 | 14,29 | ||||
| 2025-08-12 | 13F | Archer Investment Corp | 349 | 0,00 | 13 | 9,09 | ||||
| 2025-08-12 | 13F | Clal Insurance Enterprises Holdings Ltd | 2 500 000 | 93 | ||||||
| 2025-08-12 | 13F | Steward Partners Investment Advisory, Llc | 5 024 | 34,15 | 186 | 53,72 | ||||
| 2025-04-17 | 13F | Copia Wealth Management | 0 | −100,00 | 0 | |||||
| 2025-07-30 | 13F | Eqis Capital Management, Inc. | 12 263 | −1,27 | 455 | 13,22 | ||||
| 2025-07-22 | 13F | Merit Financial Group, LLC | 101 304 | −46,36 | 3 758 | −38,47 | ||||
| 2025-07-24 | 13F | Bernard Wealth Management Corp. | 17 | 0,00 | 1 | |||||
| 2025-08-14 | 13F | Turim 21 Investimentos Ltda. | 5 393 | 0,00 | 200 | 14,94 | ||||
| 2025-07-14 | 13F | U.S. Capital Wealth Advisors, LLC | 32 024 | −0,08 | 1 188 | 14,67 | ||||
| 2025-08-11 | 13F | NewEdge Wealth, LLC | 21 283 | −8,47 | 698 | −7,19 | ||||
| 2025-07-16 | 13F | Crown Wealth Group, LLC | 173 234 | 6 427 | ||||||
| 2025-07-16 | 13F | Owen LaRue, LLC | 8 550 | 0,00 | 317 | 14,86 | ||||
| 2025-07-08 | 13F | Nbc Securities, Inc. | 3 824 | 25,67 | 0 | |||||
| 2025-07-16 | 13F | BOS Asset Management, LLC | 6 522 | 242 | ||||||
| 2025-08-12 | 13F | Howe & Rusling Inc | 600 | 22 | ||||||
| 2025-08-14 | 13F | Ssi Investment Management Llc | 9 248 | 44,05 | 343 | 65,70 | ||||
| 2025-07-08 | 13F | Apella Capital, LLC | 0 | −100,00 | 0 | |||||
| 2025-08-08 | 13F | Creative Planning | 6 233 | 231 | ||||||
| 2025-07-23 | NP | PSWD - Xtrackers Cybersecurity Select Equity ETF | 160 | −88,61 | 6 | −89,36 | ||||
| 2025-08-13 | 13F | EverSource Wealth Advisors, LLC | 36 | 1 | ||||||
| 2025-07-17 | 13F | Moss Adams Wealth Advisors LLC | 1 421 225 | 1,57 | 52 727 | 16,52 | ||||
| 2025-08-14 | 13F | Susquehanna International Group, Llp | Call | 40 000 | −30,07 | 1 484 | −19,74 | |||
| 2025-07-28 | 13F | Essex LLC | 24 789 | −10,96 | 920 | 2,11 | ||||
| 2025-08-14 | 13F | Susquehanna International Group, Llp | Put | 33 400 | −61,25 | 1 239 | −55,54 | |||
| 2025-07-21 | 13F | Mirae Asset Global Investments Co., Ltd. | 363 900 | −7,94 | 13 501 | 4,00 | ||||
| 2025-08-01 | 13F | Biltmore Family Office, LLC | 162 436 | 2,51 | 6 026 | 17,60 | ||||
| 2025-08-12 | 13F | J.w. Cole Advisors, Inc. | 7 578 | 281 | ||||||
| 2025-08-08 | 13F | Avantax Advisory Services, Inc. | 18 997 | 18,01 | 705 | 35,38 | ||||
| 2025-08-14 | 13F | GWM Advisors LLC | 11 920 | 434,77 | 442 | 513,89 | ||||
| 2025-08-13 | 13F | Level Four Advisory Services, Llc | 133 561 | 1,51 | 4 955 | 16,45 | ||||
| 2025-08-14 | 13F | Royal Bank Of Canada | 212 091 | 0,12 | 7 868 | 14,84 | ||||
| 2025-04-18 | 13F | Financial Freedom, LLC | 0 | −100,00 | 0 | |||||
| 2025-05-12 | 13F | Sandy Spring Bank | 775 | 0,00 | 25 | 4,17 | ||||
| 2025-07-23 | 13F | Bellevue Asset Management, Llc | 398 | 0,00 | 15 | 16,67 | ||||
| 2025-08-11 | 13F | Y.D. More Investments Ltd | 1 400 | 0,00 | 52 | 13,33 | ||||
| 2025-07-17 | 13F | Robbins Farley Llc | 10 | 400,00 | 0 | |||||
| 2025-05-12 | 13F | Independent Advisor Alliance | 0 | −100,00 | 0 | |||||
| 2025-08-15 | 13F | Kestra Advisory Services, LLC | 201 113 | −14,06 | 7 461 | −1,40 | ||||
| 2025-08-14 | 13F | Federation des caisses Desjardins du Quebec | 29 077 | 15,91 | 1 079 | 32,92 | ||||
| 2025-07-14 | 13F | Opal Wealth Advisors, LLC | 2 431 | −5,88 | 90 | 8,43 | ||||
| 2025-07-16 | 13F | West Branch Capital LLC | 0 | −100,00 | 0 | |||||
| 2025-08-14 | 13F | Synovus Financial Corp | 9 394 | −0,49 | 349 | 14,10 | ||||
| 2025-07-29 | 13F | Private Trust Co Na | 537 | 0,00 | 20 | 11,76 | ||||
| 2025-08-11 | 13F | Blue Bell Private Wealth Management, Llc | 6 | 0,00 | 0 | |||||
| 2025-08-14 | 13F | AllSquare Wealth Management LLC | 1 702 | 161,04 | 63 | 200,00 | ||||
| 2025-07-30 | NP | GXDW - Global X Thematic Growth ETF This fund is a listed as child fund of Mirae Asset Global Investments Co., Ltd. and if that institution has disclosed ownership in this security, then these positions will not be double counted when calculating total shares and total value | 53 774 | 1 877 | ||||||
| 2025-08-01 | 13F | Bank of Jackson Hole Trust | 650 | 0,00 | 24 | 9,09 |