Grundläggande statistik
| Institutionella ägare | 137 total, 137 long only, 0 short only, 0 long/short - change of 0,73% MRQ |
| Genomsnittlig portföljallokering | 0.3950 % - change of 8,28% MRQ |
| Institutionella aktier (lång) | 16 185 211 (ex 13D/G) - change of −0,93MM shares −5,41% MRQ |
| Institutionellt värde (lång) | $ 508 841 USD ($1000) |
Institutionellt ägande och aktieägare
GraniteShares Gold Trust (US:BAR) har 137 Institutionella ägare och aktieägare som har lämnat in 13D/G- eller 13F-formulär till Securities Exchange Commission (SEC). Dessa institut innehar totalt 16,185,211 aktier. Största aktieägare inkluderar Bank Of America Corp /de/, Richard Bernstein Advisors LLC, Envestnet Asset Management Inc, Royal Bank Of Canada, LPL Financial LLC, Rockefeller Capital Management L.P., Brandywine Oak Private Wealth Llc, Lake Street Financial Llc, Cetera Investment Advisers, and Advyzon Investment Management, LLC .
GraniteShares Gold Trust (ARCA:BAR) Institutionell ägarstruktur visar institutioners och fonders nuvarande positioner i företaget, samt de senaste förändringarna i positionernas storlek. Större aktieägare kan vara enskilda investerare, fonder, hedgefonder eller institutioner. Bilaga 13D visar att investeraren äger (eller ägde) mer än 5% av företaget och avser (eller avsåg) att aktivt eftersträva en förändring av affärsstrategin. Schedule 13G indikerar en passiv investering på över 5%.
The share price as of September 10, 2025 is 35,92 / share. Previously, on September 11, 2024, the share price was 24,82 / share. This represents an increase of 44,72% over that period.

Fondsentimentets poäng
Fondsentimentet poängen(fka Ägarackumulation-poäng) visar vilka aktier som är mest köpta av fonder. Det är resultatet av en sofistikerad kvantitativ flerfaktormodell som identifierar företag med de högsta nivåerna av institutionell ackumulering. Poängsättningsmodellen använder en kombination av den totala ökningen av redovisade ägare, förändringarna i portföljallokeringarna för dessa ägare och andra mått. Siffran sträcker sig från 0 till 100, där högre siffror indikerar en högre nivå av ackumulering i förhållande till sina konkurrenter, och 50 är genomsnittet.
Uppdateringsfrekvens: Dagligen
Se Ownership Explorer, som innehåller en lista över de högst rankade företagen.
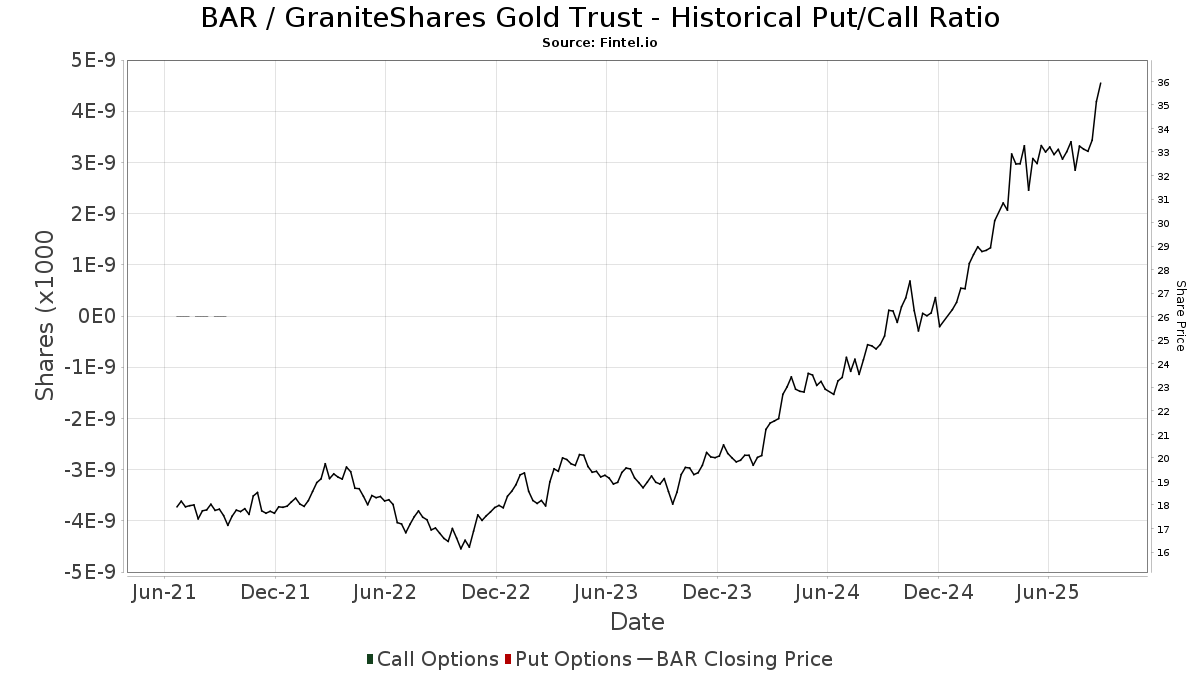
Institutionell sälj/köp-kvot
Förutom att rapportera vanliga eget kapital- och skuldemissioner måste institutioner med mer än 100MM tillgångar under förvaltning också avslöja sina innehav av sälj- och köpoptioner. Eftersom säljoptioner i allmänhet indikerar ett negativt sentiment och köpoptioner indikerar ett positivt sentiment, kan vi få en uppfattning om det övergripande institutionella sentimentet genom att plotta förhållandet mellan säljoptioner och köpoptioner. Diagrammet till höger visar det historiska förhållandet mellan sälj- och köpoptioner för detta instrument.
Genom att använda sälj/köp-kvoten som en indikator på aktieägarnas sentiment undviker man en av de största bristerna med att använda det totala institutionella ägandet, nämligen att en betydande del av de förvaltade tillgångarna investeras passivt för att följa index. Passivt förvaltade fonder köper vanligtvis inte optioner, så indikatorn för sälj/köp-kvoten ger en bättre bild av stämningen i aktivt förvaltade fonder.
13F- och NPORT-arkiveringar
Detaljer om 13F-arkiveringar är gratis. Detaljer om NP-arkiveringar kräver ett premiummedlemskap. Gröna rader indikerar nya positioner. Röda rader indikerar stängda positioner. Klicka på länk symbolen för att se hela transaktionshistoriken.
Uppgradera
för att låsa upp premiumdata och exportera till Excel ![]() .
.
| Fil Datum | Källa | Investerare | Typ | Genomsnittligt pris (beräknat) |
Aktier | Δ Aktier (%) |
Rapporterat värde (1000 USD) |
Δ Värde (%) |
Portföljallokering (%) |
|
|---|---|---|---|---|---|---|---|---|---|---|
| 2025-07-11 | 13F | Brendel Financial Advisors LLC | 151 280 | 1,04 | 5 | 0,00 | ||||
| 2025-07-17 | 13F | Clear Point Advisors Inc. | 97 126 | 0,62 | 3 110 | 4,47 | ||||
| 2025-08-14 | 13F | Clg Llc | 12 000 | 0,00 | 392 | 5,68 | ||||
| 2025-08-14 | 13F | Stifel Financial Corp | 228 073 | −11,65 | 7 444 | −6,49 | ||||
| 2025-08-05 | 13F | Bank of New York Mellon Corp | 158 366 | 45,66 | 5 169 | 54,16 | ||||
| 2025-08-13 | 13F | Lido Advisors, LLC | 6 277 | 205 | ||||||
| 2025-08-14 | 13F | Boston Private Wealth Llc | 0 | −100,00 | 0 | |||||
| 2025-08-14 | 13F | Sunbelt Securities, Inc. | 325 | 0,00 | 8 | −20,00 | ||||
| 2025-04-21 | 13F | Nelson, Van Denburg & Campbell Wealth Management Group, LLC | 0 | −100,00 | 0 | |||||
| 2025-07-09 | 13F | Reyes Financial Architecture, Inc. | 10 630 | 347 | ||||||
| 2025-08-11 | 13F | Semus Wealth Partners LLC | 33 384 | 0,00 | 1 090 | 5,83 | ||||
| 2025-08-14 | 13F/A | Skopos Labs, Inc. | 663 | 34,21 | 22 | 40,00 | ||||
| 2025-07-24 | 13F | Ronald Blue Trust, Inc. | 10 021 | 1,25 | 327 | 7,21 | ||||
| 2025-08-12 | 13F | LPL Financial LLC | 646 000 | −5,11 | 21 085 | 0,43 | ||||
| 2025-07-16 | 13F | Patron Partners Advisors, Llc | 12 824 | −6,88 | 419 | −1,42 | ||||
| 2025-08-06 | 13F | Cherry Creek Investment Advisors, Inc. | 77 228 | 1,49 | 2 521 | 7,42 | ||||
| 2025-08-13 | 13F | Cerity Partners LLC | 10 725 | 0,00 | 350 | 6,06 | ||||
| 2025-07-17 | 13F | LexAurum Advisors, LLC | 9 733 | 0,00 | 318 | 5,67 | ||||
| 2025-08-14 | 13F | Raymond James Financial Inc | 273 161 | 22,26 | 8 916 | 29,39 | ||||
| 2025-07-09 | 13F | Inspirion Wealth Advisors, Llc | 45 365 | 13,37 | 1 481 | 19,94 | ||||
| 2025-07-17 | 13F | Janney Montgomery Scott LLC | 11 467 | −18,64 | 0 | |||||
| 2025-05-06 | 13F | Venturi Wealth Management, LLC | 0 | −100,00 | 0 | −100,00 | ||||
| 2025-05-09 | 13F | Headlands Technologies LLC | 0 | −100,00 | 0 | |||||
| 2025-05-15 | 13F | Betterment LLC | 0 | −100,00 | 0 | |||||
| 2025-07-18 | 13F | Truist Financial Corp | 11 227 | −3,69 | 366 | 1,95 | ||||
| 2025-08-13 | 13F | Renaissance Technologies Llc | 155 100 | −72,29 | 5 062 | −70,67 | ||||
| 2025-08-14 | 13F | Visionary Wealth Advisors | 7 863 | 0,00 | 257 | 5,79 | ||||
| 2025-08-15 | 13F | Morgan Stanley | 65 177 | −34,21 | 2 127 | −30,38 | ||||
| 2025-07-24 | 13F | Leo Wealth, LLC | 16 907 | 562 | ||||||
| 2025-08-06 | 13F | AE Wealth Management LLC | 67 209 | −15,18 | 2 194 | −10,23 | ||||
| 2025-08-06 | 13F | Richard Bernstein Advisors LLC | 2 703 358 | −7,92 | 88 238 | −2,54 | ||||
| 2025-08-13 | 13F | Virtue Capital Management, LLC | 33 281 | 5,21 | 1 086 | 11,38 | ||||
| 2025-08-08 | 13F | Creative Planning | 14 576 | 64,09 | 476 | 73,99 | ||||
| 2025-08-12 | 13F | Proequities, Inc. | 0 | 0 | ||||||
| 2025-08-08 | 13F | Avantax Advisory Services, Inc. | 6 780 | 221 | ||||||
| 2025-07-23 | 13F | DMG Group, LLC | 11 840 | 23,49 | 386 | 30,85 | ||||
| 2025-08-07 | 13F | Cypress Capital Management LLC (WY) | 485 | 0,00 | 16 | 7,14 | ||||
| 2025-07-30 | 13F | Whittier Trust Co Of Nevada Inc | 1 317 | 0,00 | 43 | 5,00 | ||||
| 2025-08-01 | 13F | Envestnet Asset Management Inc | 767 379 | −9,10 | 25 047 | −3,80 | ||||
| 2025-05-14 | 13F | Ieq Capital, Llc | 0 | −100,00 | 0 | |||||
| 2025-08-12 | 13F | Inscription Capital, LLC | 0 | −100,00 | 0 | |||||
| 2025-08-11 | 13F | Advisor Resource Council | 0 | −100,00 | 0 | |||||
| 2025-04-17 | 13F | Life Planning Partners, Inc | 0 | −100,00 | 0 | −100,00 | ||||
| 2025-08-14 | 13F | IHT Wealth Management, LLC | 16 021 | 523 | ||||||
| 2025-07-24 | 13F | Trust Co Of Toledo Na /oh/ | 115 | 4 | ||||||
| 2025-08-14 | 13F | Citadel Advisors Llc | 0 | −100,00 | 0 | |||||
| 2025-07-10 | 13F | Redhawk Wealth Advisors, Inc. | 11 031 | 0,00 | 360 | 5,88 | ||||
| 2025-08-11 | 13F | Pineridge Advisors LLC | 5 255 | −4,49 | 172 | 1,18 | ||||
| 2025-08-08 | 13F | Kingsview Wealth Management, LLC | 13 642 | −0,20 | 445 | 5,70 | ||||
| 2025-07-17 | 13F | Sound Income Strategies, LLC | 2 548 | 0,00 | 83 | 6,41 | ||||
| 2025-04-28 | NP | MPAY - Akros Monthly Payout ETF | 5 875 | 7,35 | 166 | 15,38 | ||||
| 2025-08-11 | 13F | TD Waterhouse Canada Inc. | 0 | −100,00 | 0 | |||||
| 2025-08-13 | 13F | ASB Consultores, LLC | 7 584 | 248 | ||||||
| 2025-08-13 | 13F | Smith, Moore & Co. | 30 859 | 2,32 | 1 007 | 8,28 | ||||
| 2025-07-16 | 13F | Maridea Wealth Management LLC | 198 800 | 6 489 | ||||||
| 2025-08-14 | 13F | CoreCap Advisors, LLC | 1 246 | 0,00 | 41 | 5,26 | ||||
| 2025-08-12 | 13F | Jaffetilchin Investment Partners, LLC | 17 067 | −4,03 | 557 | 1,64 | ||||
| 2025-08-14 | 13F | Wells Fargo & Company/mn | 12 180 | 69,03 | 398 | 78,83 | ||||
| 2025-07-18 | 13F | Institute for Wealth Management, LLC. | 6 789 | 2,40 | 222 | 8,33 | ||||
| 2025-07-10 | 13F | Capital Advisory Group Advisory Services, LLC | 77 820 | 4,31 | 2 540 | 10,43 | ||||
| 2025-08-13 | 13F | Cambria Investment Management, L.P. | 307 471 | −20,20 | 10 036 | −15,54 | ||||
| 2025-08-08 | 13F | Pnc Financial Services Group, Inc. | 35 | 0,00 | 1 | 0,00 | ||||
| 2025-07-23 | 13F | Defined Financial Planning LLC | 41 930 | 1 377 | ||||||
| 2025-07-31 | 13F | WFA Asset Management Corp | 1 500 | 0,00 | 34 | 6,25 | ||||
| 2025-08-01 | 13F | Transcend Wealth Collective, Llc | 0 | −100,00 | 0 | |||||
| 2025-08-11 | 13F | Private Advisor Group, LLC | 14 960 | −3,11 | 488 | 2,52 | ||||
| 2025-08-07 | 13F | PFG Advisors | 18 352 | 0,00 | 599 | 6,02 | ||||
| 2025-05-14 | 13F | Flow Traders U.s. Llc | 0 | −100,00 | 0 | |||||
| 2025-07-14 | 13F | Crew Capital Management, Ltd. | 10 493 | 342 | ||||||
| 2025-09-04 | 13F/A | Advisor Group Holdings, Inc. | 147 624 | 0,28 | 4 818 | 6,15 | ||||
| 2025-07-08 | 13F | Ehrlich Financial Group | 16 066 | −5,93 | 524 | −0,38 | ||||
| 2025-07-16 | 13F | Essex Financial Services, Inc. | 15 627 | −3,76 | 510 | 2,00 | ||||
| 2025-08-14 | 13F | Comerica Bank | 8 797 | −2,66 | 287 | 3,24 | ||||
| 2025-07-29 | 13F | Kraft, Davis & Associates, LLC | 12 767 | 0,00 | 418 | −1,88 | ||||
| 2025-07-31 | 13F | Cambridge Investment Research Advisors, Inc. | 44 685 | −0,15 | 1 | 0,00 | ||||
| 2025-07-31 | 13F | Brinker Capital Investments, LLC | 0 | −100,00 | 0 | −100,00 | ||||
| 2025-08-11 | 13F | Nations Financial Group Inc, /ia/ /adv | 227 510 | 120,29 | 7 426 | 133,12 | ||||
| 2025-08-14 | 13F | Ausdal Financial Partners, Inc. | 188 363 | 6 148 | ||||||
| 2025-05-12 | 13F | Virtu Financial LLC | 0 | −100,00 | 0 | |||||
| 2025-08-18 | 13F/A | National Bank Of Canada /fi/ | 230 | 8 | ||||||
| 2025-08-13 | 13F | Denver Wealth Management, Inc. | 16 307 | 1,91 | 532 | 7,91 | ||||
| 2025-08-14 | 13F | Fmr Llc | 3 708 | 48,02 | 121 | 57,14 | ||||
| 2025-08-15 | 13F | Captrust Financial Advisors | 145 013 | −5,87 | 4 733 | −0,38 | ||||
| 2025-08-14 | 13F/A | Rockefeller Capital Management L.P. | 445 034 | −1,12 | 14 526 | 4,65 | ||||
| 2025-07-23 | 13F | Castle Rock Wealth Management, LLC | 6 924 | 3,11 | 232 | 12,14 | ||||
| 2025-08-14 | 13F | Hrt Financial Lp | 13 025 | 92,88 | 0 | |||||
| 2025-07-29 | 13F | Stratos Wealth Partners, LTD. | 0 | −100,00 | 0 | |||||
| 2025-08-11 | 13F | Principal Securities, Inc. | 12 719 | −25,64 | 415 | −6,11 | ||||
| 2025-06-27 | NP | GMOM - Cambria Global Momentum ETF | 191 198 | −24,17 | 6 214 | −10,87 | ||||
| 2025-08-05 | 13F | GPS Wealth Strategies Group, LLC | 933 | 0,00 | 30 | 7,14 | ||||
| 2025-08-11 | 13F | Lake Street Financial Llc | 400 189 | −0,54 | 13 062 | 5,28 | ||||
| 2025-08-07 | 13F | Investment Management Corp /va/ /adv | 4 926 | 0,00 | 161 | 5,96 | ||||
| 2025-07-16 | 13F | Signaturefd, Llc | 91 | 0,00 | 3 | 0,00 | ||||
| 2025-08-01 | 13F | American Financial & Tax Strategies Inc | 35 911 | −3,13 | 1 172 | 2,54 | ||||
| 2025-08-08 | 13F | Advyzon Investment Management, LLC | 322 782 | 10 536 | ||||||
| 2025-08-11 | 13F | HighTower Advisors, LLC | 72 806 | −6,96 | 2 376 | −1,53 | ||||
| 2025-08-15 | 13F | CI Private Wealth, LLC | 20 651 | 2,38 | 674 | 8,20 | ||||
| 2025-08-14 | 13F | Federation des caisses Desjardins du Quebec | 1 437 | 22,61 | 47 | 27,78 | ||||
| 2025-08-11 | 13F | Aptus Capital Advisors, LLC | 34 317 | −38,67 | 1 120 | −35,07 | ||||
| 2025-06-27 | NP | TRTY - Cambria Trinity ETF | 66 732 | −23,27 | 2 169 | −9,82 | ||||
| 2025-08-18 | 13F | Hollencrest Capital Management | 890 | 0,00 | 29 | 7,41 | ||||
| 2025-08-28 | 13F | China Universal Asset Management Co., Ltd. | 303 000 | 12,64 | 9 890 | 19,22 | ||||
| 2025-08-14 | 13F | Bnp Paribas Arbitrage, Sa | 37 | −99,24 | 1 | −99,33 | ||||
| 2025-07-28 | 13F | Axxcess Wealth Management, Llc | 8 695 | 0,00 | 284 | 5,60 | ||||
| 2025-08-06 | 13F | Commonwealth Equity Services, Llc | 118 636 | −1,00 | 4 | 0,00 | ||||
| 2025-08-13 | 13F | Quadrature Capital Ltd | 15 707 | 513 | ||||||
| 2025-08-14 | 13F | UBS Group AG | 276 | 9 | ||||||
| 2025-07-28 | 13F | Harbour Investments, Inc. | 2 722 | 0,00 | 89 | 6,02 | ||||
| 2025-08-18 | 13F | Tactive Advisors, LLC | 20 115 | −31,60 | 657 | 1,71 | ||||
| 2025-08-05 | 13F | Huntington National Bank | 813 | 6,01 | ||||||
| 2025-08-14 | 13F | Jane Street Group, Llc | 0 | −100,00 | 0 | |||||
| 2025-05-14 | 13F | WCG Wealth Advisors LLC | 0 | −100,00 | 0 | |||||
| 2025-08-13 | 13F | Rsm Us Wealth Management Llc | 17 239 | 15,40 | 563 | 22,17 | ||||
| 2025-07-29 | 13F | BKM Wealth Management, LLC | 28 536 | 22,91 | 931 | 30,03 | ||||
| 2025-08-06 | 13F | ETF Store, Inc. | 119 727 | −1,50 | 3 908 | 4,24 | ||||
| 2025-08-12 | 13F | Archer Investment Corp | 923 | 30 | ||||||
| 2025-08-07 | 13F | Evoke Wealth, Llc | 10 612 | 346 | ||||||
| 2025-07-14 | 13F | U.S. Capital Wealth Advisors, LLC | 149 864 | 5,00 | 4 892 | 11,13 | ||||
| 2025-07-15 | 13F | Evanson Asset Management, LLC | 12 204 | 0,00 | 398 | 5,85 | ||||
| 2025-08-14 | 13F | GWM Advisors LLC | 16 074 | −49,87 | 525 | −46,96 | ||||
| 2025-08-08 | 13F | Cetera Investment Advisers | 338 427 | −6,90 | 11 046 | −1,46 | ||||
| 2025-07-02 | 13F | HBW Advisory Services LLC | 9 034 | 31,35 | 295 | 38,68 | ||||
| 2025-07-25 | 13F | Cwm, Llc | 541 | 0,00 | 0 | |||||
| 2025-07-29 | 13F | Stratos Wealth Advisors, LLC | 0 | −100,00 | 0 | |||||
| 2025-08-12 | 13F | SRS Capital Advisors, Inc. | 6 065 | 0,00 | 198 | 5,35 | ||||
| 2025-08-01 | 13F | Gwn Securities Inc. | 0 | −100,00 | 0 | |||||
| 2025-04-21 | 13F | Envestnet Portfolio Solutions, Inc. | 0 | −100,00 | 0 | |||||
| 2025-08-14 | 13F | Royal Bank Of Canada | 696 903 | −12,52 | 22 747 | −7,42 | ||||
| 2025-07-24 | 13F | Brandywine Oak Private Wealth Llc | 439 760 | −9,47 | 14 354 | −4,19 | ||||
| 2025-07-22 | 13F | Comprehensive Financial Consultants Institutional, Inc. | 8 687 | 0,00 | 284 | 5,99 | ||||
| 2025-08-12 | 13F | Jpmorgan Chase & Co | 83 329 | −33,67 | 2 720 | −29,81 | ||||
| 2025-05-08 | 13F | Us Bancorp \de\ | 0 | −100,00 | 0 | |||||
| 2025-07-31 | 13F | Moloney Securities Asset Management, LLC | 7 750 | 3,68 | 253 | 9,57 | ||||
| 2025-08-11 | 13F | Eq Llc | 27 493 | 0,00 | 897 | 5,90 | ||||
| 2025-08-04 | 13F | Atria Investments Llc | 20 679 | −2,61 | 675 | 3,06 | ||||
| 2025-08-13 | 13F | Northwestern Mutual Wealth Management Co | 14 830 | 8,67 | 484 | 15,24 | ||||
| 2025-08-14 | 13F | Financial Strategies Group, Inc. | 6 213 | −15,33 | 206 | −12,02 | ||||
| 2025-07-23 | 13F | Prime Capital Investment Advisors, LLC | 0 | −100,00 | 0 | |||||
| 2025-07-24 | 13F | IFP Advisors, Inc | 5 077 | 7,02 | 166 | 13,01 | ||||
| 2025-08-05 | 13F | Freestone Capital Holdings, LLC | 17 764 | 0,00 | 580 | 5,85 | ||||
| 2025-08-11 | 13F | Western Wealth Management, LLC | 10 215 | −5,64 | 333 | 0,00 | ||||
| 2025-07-11 | 13F | Farther Finance Advisors, LLC | 3 135 | 11,29 | 102 | 18,60 | ||||
| 2025-08-07 | 13F | Ibex Wealth Advisors | 35 905 | −69,97 | 1 172 | −68,24 | ||||
| 2025-07-31 | 13F | Jackson Hole Capital Partners, LLC | 71 069 | 0,00 | 2 320 | 5,84 | ||||
| 2025-07-10 | 13F | Exchange Traded Concepts, Llc | 0 | −100,00 | 0 | |||||
| 2025-08-05 | 13F | ALM First Financial Advisors, LLC | 233 353 | 0,00 | 7 245 | 5,83 | ||||
| 2025-03-25 | NP | DRRAX - BNY Mellon Global Real Return Fund Class A | 149 153 | −49,82 | 4 124 | −48,80 | ||||
| 2025-08-14 | 13F | Glen Eagle Advisors, LLC | 10 576 | 0,00 | 345 | 5,83 | ||||
| 2025-07-23 | 13F | Columbus Macro, LLC | 269 821 | −8,48 | 8 807 | −3,15 | ||||
| 2025-07-25 | 13F | Almanack Investment Partners, LLC. | 17 325 | −5,38 | 565 | 0,18 | ||||
| 2025-08-13 | 13F | Townsquare Capital Llc | 0 | −100,00 | 0 | |||||
| 2025-07-22 | 13F | Beacon Financial Advisory LLC | 11 563 | 0,00 | 377 | 5,90 | ||||
| 2025-06-27 | NP | GAA - Cambria Global Asset Allocation ETF | 86 983 | 0,00 | 2 827 | 17,51 | ||||
| 2025-07-08 | 13F | Nbc Securities, Inc. | 466 | 112,79 | 0 | |||||
| 2025-08-14 | 13F | Mercer Global Advisors Inc /adv | 104 755 | −14,10 | 3 419 | −9,07 | ||||
| 2025-08-14 | 13F | Mml Investors Services, Llc | 216 038 | 1,56 | 7 | 16,67 | ||||
| 2025-08-14 | 13F | Coastal Bridge Advisors, LLC | 11 134 | −29,39 | 363 | −25,31 | ||||
| 2025-07-31 | 13F | Mason & Associates Inc | 120 517 | 12,23 | 3 934 | 18,79 | ||||
| 2025-08-14 | 13F | Bank Of America Corp /de/ | 3 199 277 | −9,08 | 104 424 | −3,78 | ||||
| 2025-04-28 | 13F | Strategic Financial Concepts, LLC | 0 | −100,00 | 0 | −100,00 | ||||
| 2025-07-25 | 13F | We Are One Seven, LLC | 13 910 | −4,15 | 454 | 1,57 | ||||
| 2025-08-12 | 13F | Change Path, LLC | 7 021 | −0,13 | 229 | 6,02 | ||||
| 2025-08-12 | 13F | Steward Partners Investment Advisory, Llc | 159 074 | 39,79 | 5 192 | 47,96 | ||||
| 2025-07-29 | 13F | Financial Guidance Group, Inc. | 29 503 | −42,31 | 963 | −39,00 | ||||
| 2025-08-12 | 13F | TCTC Holdings, LLC | 1 517 | 0,00 | 50 | 6,52 |