Grundläggande statistik
| Institutionella ägare | 138 total, 138 long only, 0 short only, 0 long/short - change of 6,98% MRQ |
| Genomsnittlig portföljallokering | 1.3079 % - change of −6,17% MRQ |
| Institutionella aktier (lång) | 12 234 217 (ex 13D/G) - change of 2,75MM shares 28,95% MRQ |
| Institutionellt värde (lång) | $ 683 998 USD ($1000) |
Institutionellt ägande och aktieägare
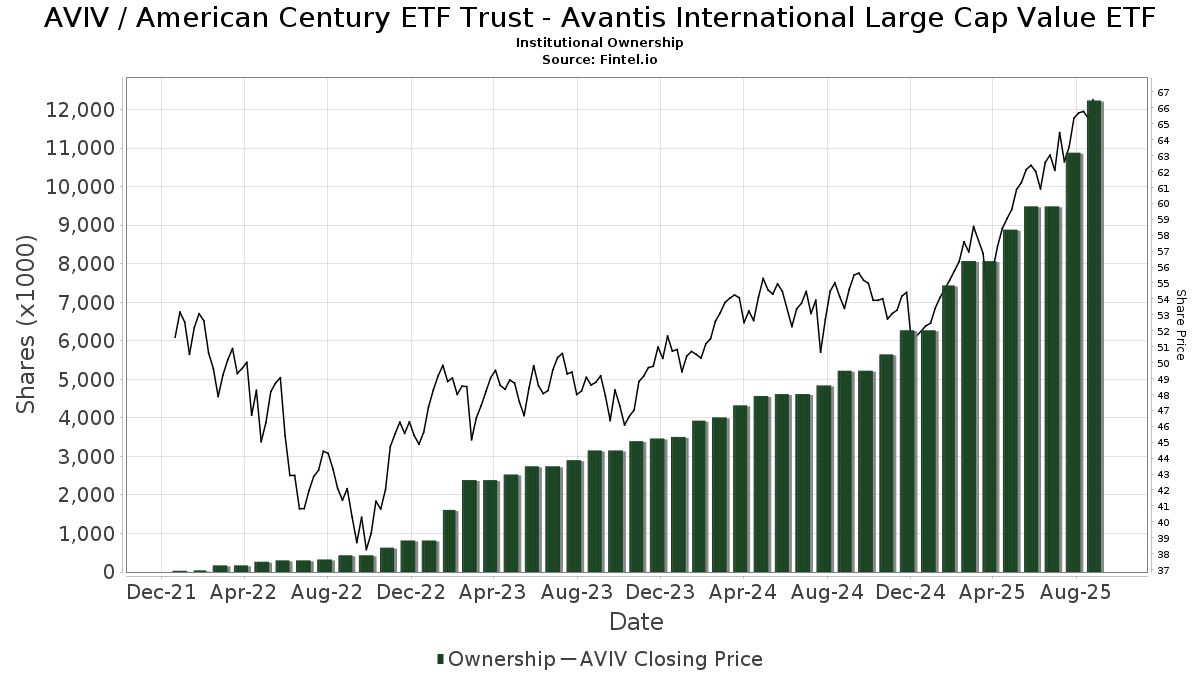
American Century ETF Trust - Avantis International Large Cap Value ETF (US:AVIV) har 138 Institutionella ägare och aktieägare som har lämnat in 13D/G- eller 13F-formulär till Securities Exchange Commission (SEC). Dessa institut innehar totalt 12,234,217 aktier. Största aktieägare inkluderar American Century Companies Inc, PrairieView Partners, LLC, AVNM - Avantis All International Markets Equity ETF, IAG Wealth Partners, LLC, AVGE - Avantis All Equity Markets ETF, AVGV - Avantis All Equity Markets Value ETF, Atwood & Palmer Inc, Buckingham Strategic Partners, B&D White Capital Company, LLC, and Financial Advisory Service, Inc. .
American Century ETF Trust - Avantis International Large Cap Value ETF (ARCA:AVIV) Institutionell ägarstruktur visar institutioners och fonders nuvarande positioner i företaget, samt de senaste förändringarna i positionernas storlek. Större aktieägare kan vara enskilda investerare, fonder, hedgefonder eller institutioner. Bilaga 13D visar att investeraren äger (eller ägde) mer än 5% av företaget och avser (eller avsåg) att aktivt eftersträva en förändring av affärsstrategin. Schedule 13G indikerar en passiv investering på över 5%.
The share price as of September 12, 2025 is 66,81 / share. Previously, on September 13, 2024, the share price was 54,25 / share. This represents an increase of 23,15% over that period.
Fondsentimentets poäng
Fondsentimentet poängen(fka Ägarackumulation-poäng) visar vilka aktier som är mest köpta av fonder. Det är resultatet av en sofistikerad kvantitativ flerfaktormodell som identifierar företag med de högsta nivåerna av institutionell ackumulering. Poängsättningsmodellen använder en kombination av den totala ökningen av redovisade ägare, förändringarna i portföljallokeringarna för dessa ägare och andra mått. Siffran sträcker sig från 0 till 100, där högre siffror indikerar en högre nivå av ackumulering i förhållande till sina konkurrenter, och 50 är genomsnittet.
Uppdateringsfrekvens: Dagligen
Se Ownership Explorer, som innehåller en lista över de högst rankade företagen.
Institutionell sälj/köp-kvot
Förutom att rapportera vanliga eget kapital- och skuldemissioner måste institutioner med mer än 100MM tillgångar under förvaltning också avslöja sina innehav av sälj- och köpoptioner. Eftersom säljoptioner i allmänhet indikerar ett negativt sentiment och köpoptioner indikerar ett positivt sentiment, kan vi få en uppfattning om det övergripande institutionella sentimentet genom att plotta förhållandet mellan säljoptioner och köpoptioner. Diagrammet till höger visar det historiska förhållandet mellan sälj- och köpoptioner för detta instrument.
Genom att använda sälj/köp-kvoten som en indikator på aktieägarnas sentiment undviker man en av de största bristerna med att använda det totala institutionella ägandet, nämligen att en betydande del av de förvaltade tillgångarna investeras passivt för att följa index. Passivt förvaltade fonder köper vanligtvis inte optioner, så indikatorn för sälj/köp-kvoten ger en bättre bild av stämningen i aktivt förvaltade fonder.
13F- och NPORT-arkiveringar
Detaljer om 13F-arkiveringar är gratis. Detaljer om NP-arkiveringar kräver ett premiummedlemskap. Gröna rader indikerar nya positioner. Röda rader indikerar stängda positioner. Klicka på länk symbolen för att se hela transaktionshistoriken.
Uppgradera
för att låsa upp premiumdata och exportera till Excel ![]() .
.
| Fil Datum | Källa | Investerare | Typ | Genomsnittligt pris (beräknat) |
Aktier | Δ Aktier (%) |
Rapporterat värde (1000 USD) |
Δ Värde (%) |
Portföljallokering (%) |
|
|---|---|---|---|---|---|---|---|---|---|---|
| 2025-08-14 | 13F | Citadel Advisors Llc | 3 372 | −92,92 | 210 | −92,25 | ||||
| 2025-07-10 | 13F | Financial Management Network Inc | 95 950 | 13,88 | 6 008 | 40,64 | ||||
| 2025-07-28 | NP | AVGE - Avantis All Equity Markets ETF | 492 586 | 8,76 | 30 393 | 19,97 | ||||
| 2025-07-07 | 13F | Fox Hill Wealth Management | 7 069 | −1,05 | 440 | 8,66 | ||||
| 2025-08-14 | 13F | Beaird Harris Wealth Management, LLC | 123 963 | −1,10 | 7 715 | 8,59 | ||||
| 2025-07-10 | 13F | Websterrogers Financial Advisors, Llc | 207 757 | 1,75 | 12 930 | 11,73 | ||||
| 2025-08-13 | 13F | Greenwich Wealth Management LLC | 12 970 | 0,00 | 1 | |||||
| 2025-08-13 | 13F | Satovsky Asset Management Llc | 8 057 | 501 | ||||||
| 2025-08-13 | 13F | Cresset Asset Management, LLC | 0 | −100,00 | 0 | |||||
| 2025-08-12 | 13F | Pathstone Holdings, LLC | 15 947 | 1,83 | 992 | 11,84 | ||||
| 2025-07-21 | 13F | Life Planning Partners, Inc | 3 920 | 0,00 | 244 | 9,46 | ||||
| 2025-08-14 | 13F | Comerica Bank | 1 463 | 0,00 | 91 | 10,98 | ||||
| 2025-07-17 | 13F | Stone Point Wealth LLC | 9 518 | −9,94 | 592 | −1,00 | ||||
| 2025-07-14 | 13F | Harbor Group, Inc. | 23 877 | 147,79 | 1 486 | 171,98 | ||||
| 2025-08-11 | 13F | Ritter Daniher Financial Advisory LLC / DE | 23 597 | −10,91 | 1 469 | −2,20 | ||||
| 2025-07-28 | NP | AVNV - Avantis All International Markets Value ETF | 271 183 | 661,77 | 16 732 | 740,33 | ||||
| 2025-04-29 | 13F | Callan Capital, LLC | 26 949 | −1,70 | 1 527 | 7,38 | ||||
| 2025-08-13 | 13F | Jones Financial Companies Lllp | 141 107 | 122,77 | 8 761 | 142,08 | ||||
| 2025-08-15 | 13F | Keel Point, LLC | 6 669 | 0,59 | 415 | 10,67 | ||||
| 2025-08-01 | 13F | Zhang Financial LLC | 5 654 | 352 | ||||||
| 2025-07-24 | 13F | Etesian Wealth Advisors, Inc. | 6 268 | 0,00 | 390 | 9,86 | ||||
| 2025-08-04 | 13F | Haven Private, LLC | 57 275 | 18,16 | 3 565 | 29,74 | ||||
| 2025-08-04 | 13F | McMill Wealth Management | 37 249 | −7,21 | 2 318 | 1,85 | ||||
| 2025-08-04 | 13F | Linscomb & Williams, Inc. | 160 875 | 13,47 | 10 012 | 24,60 | ||||
| 2025-07-18 | 13F | TruNorth Capital Management, LLC | 1 202 | 0,00 | 75 | 8,82 | ||||
| 2025-07-28 | 13F | Harbour Investments, Inc. | 4 081 | 7,54 | 254 | 17,67 | ||||
| 2025-07-29 | 13F | Private Trust Co Na | 4 613 | 0,00 | 287 | 9,96 | ||||
| 2025-08-14 | 13F | Aqr Capital Management Llc | 29 127 | 0,00 | 1 813 | 9,82 | ||||
| 2025-08-14 | 13F | Susquehanna International Group, Llp | 8 734 | 544 | ||||||
| 2025-07-25 | 13F | Ruedi Wealth Management, Inc. | 0 | −100,00 | 0 | |||||
| 2025-08-14 | 13F | Navigoe, LLC | 60 780 | 7,41 | 4 | 0,00 | ||||
| 2025-08-08 | 13F | Tortoise Investment Management, LLC | 91 349 | 3,66 | 5 685 | 13,84 | ||||
| 2025-07-22 | 13F | Global Strategic Investment Solutions, LLC | 229 102 | −3,43 | 14 258 | 6,04 | ||||
| 2025-07-22 | 13F | SOL Capital Management CO | 9 120 | −1,62 | 1 | |||||
| 2025-07-15 | 13F | Financial Partners Group, Inc | 3 736 | 233 | ||||||
| 2025-07-14 | 13F | Northland Capital Management LLC | 98 318 | −7,45 | 6 119 | 1,61 | ||||
| 2025-07-16 | 13F | Plancorp, LLC | 48 325 | 1,98 | 3 008 | 11,99 | ||||
| 2025-08-13 | 13F | Flow Traders U.s. Llc | 0 | −100,00 | 0 | |||||
| 2025-08-12 | 13F | Pfc Capital Group, Inc. | 18 750 | 114,68 | 1 | |||||
| 2025-07-15 | 13F | Evanson Asset Management, LLC | 15 336 | 1,25 | 954 | 11,19 | ||||
| 2025-07-17 | 13F | Sterneck Capital Management, LLC | 3 674 | 229 | ||||||
| 2025-07-16 | 13F | TCI Wealth Advisors, Inc. | 4 028 | −1,13 | 251 | 8,70 | ||||
| 2025-05-13 | 13F | BlackDiamond Wealth Management Inc. | 0 | −100,00 | 0 | |||||
| 2025-07-17 | 13F | Porter White Investment Advisors, Inc. | 4 631 | 0,00 | 288 | 9,92 | ||||
| 2025-07-16 | 13F | Paragon Capital Management Ltd | 3 254 | 203 | ||||||
| 2025-08-05 | 13F | Cherry Tree Wealth Management, LLC | 1 130 | −5,36 | 70 | 4,48 | ||||
| 2025-08-08 | 13F | Pnc Financial Services Group, Inc. | 53 | 3 | ||||||
| 2025-08-13 | 13F | EverSource Wealth Advisors, LLC | 640 | 40 | ||||||
| 2025-07-30 | 13F | Canvas Wealth Advisors, LLC | 11 522 | 76,04 | 727 | 94,12 | ||||
| 2025-08-13 | 13F | Northwestern Mutual Wealth Management Co | 65 348 | −2,47 | 4 067 | 7,08 | ||||
| 2025-08-14 | 13F | UBS Group AG | 374 | 0,00 | 23 | 9,52 | ||||
| 2025-07-25 | 13F | PrairieView Partners, LLC | 1 064 106 | −1,75 | 66 | 8,20 | ||||
| 2025-07-10 | 13F | Wealth Enhancement Advisory Services, Llc | 13 633 | 95,85 | 854 | 116,50 | ||||
| 2025-07-31 | 13F | Buckingham Strategic Partners | 433 163 | 148,24 | 26 958 | 172,57 | ||||
| 2025-08-08 | 13F | Larson Financial Group LLC | 514 | 0,00 | 32 | 6,90 | ||||
| 2025-08-07 | 13F | Fonville Wealth Management LLC | 96 668 | 8,74 | 6 016 | 17,50 | ||||
| 2025-07-10 | 13F | Anderson Hoagland & Co | 54 351 | 11,38 | 3 383 | 37,87 | ||||
| 2025-07-10 | 13F | Fortress Wealth Management, Inc. | 5 069 | 35,53 | 316 | 49,29 | ||||
| 2025-07-17 | 13F | Symmetry Partners, LLC | 101 255 | 23,72 | 6 302 | 35,86 | ||||
| 2025-07-18 | 13F | Foundry Financial Group, Inc. | 234 500 | 28,33 | 14 594 | 40,91 | ||||
| 2025-07-03 | 13F | Collective Family Office Llc | 74 641 | 1,65 | 4 645 | 11,63 | ||||
| 2025-07-30 | 13F | TFB Advisors LLC | 5 920 | 0,00 | 368 | 9,85 | ||||
| 2025-07-28 | NP | AVMA - Avantis Moderate Allocation ETF | 18 330 | −7,15 | 1 131 | 2,36 | ||||
| 2025-07-28 | 13F | Dixon Fnancial Services, Inc. | 21 740 | 0,00 | 1 353 | 9,74 | ||||
| 2025-08-14 | 13F | Jane Street Group, Llc | 267 344 | 609,25 | 16 638 | 678,93 | ||||
| 2025-08-15 | 13F | Morgan Stanley | 3 369 | 248,40 | 210 | 287,04 | ||||
| 2025-08-13 | 13F | B&D White Capital Company, LLC | 283 748 | 105,70 | 17 659 | 125,88 | ||||
| 2025-07-28 | NP | AVGV - Avantis All Equity Markets Value ETF | 478 524 | 10,47 | 29 525 | 21,86 | ||||
| 2025-07-10 | 13F | Pacific Asset Management, LLC | 19 901 | 1,29 | 1 239 | 11,23 | ||||
| 2025-07-11 | 13F/A | Umb Bank N A/mo | 20 969 | 0,64 | 1 305 | 10,59 | ||||
| 2025-08-11 | 13F | Principal Securities, Inc. | 1 054 | −13,68 | 66 | 3,17 | ||||
| 2025-04-21 | 13F | Envestnet Portfolio Solutions, Inc. | 0 | −100,00 | 0 | |||||
| 2025-04-18 | 13F | Creative Capital Management Investments LLC | 0 | −100,00 | 0 | |||||
| 2025-07-03 | 13F | Lam Group, Inc. | 20 100 | 7,89 | 1 251 | 18,48 | ||||
| 2025-08-12 | 13F | LPL Financial LLC | 127 501 | 108,05 | 7 935 | 128,48 | ||||
| 2025-07-30 | 13F | Clune & Associates, Ltd. | 63 104 | 0,62 | 3 927 | 10,50 | ||||
| 2025-08-14 | 13F | Cardiff Park Advisors, Llc | 10 908 | 1,61 | 679 | 11,51 | ||||
| 2025-07-11 | 13F | Farther Finance Advisors, LLC | 227 | 0,00 | 14 | 16,67 | ||||
| 2025-07-29 | 13F | Chicago Partners Investment Group LLC | 95 044 | −0,46 | 6 125 | 8,64 | ||||
| 2025-07-24 | 13F | IFP Advisors, Inc | 100 | 0,00 | 6 | 20,00 | ||||
| 2025-08-12 | 13F | Burk Holdings LLC | 8 964 | 558 | ||||||
| 2025-08-08 | 13F | Creative Planning | 33 899 | 0,05 | 2 110 | 9,84 | ||||
| 2025-08-07 | 13F | Nwam Llc | 93 928 | −5,48 | 5 846 | 3,78 | ||||
| 2025-08-07 | 13F | CENTRAL TRUST Co | 1 890 | 118 | ||||||
| 2025-08-14 | 13F | Colony Group, LLC | 99 209 | 0,82 | 6 174 | 10,70 | ||||
| 2025-08-01 | 13F | Red Lighthouse Investment Management, Llc | 30 | 2 | ||||||
| 2025-07-29 | 13F | Werba Rubin Papier Wealth Management | 43 527 | −3,80 | 2 709 | 5,62 | ||||
| 2025-08-13 | 13F | Mayfair Advisory Group, LLC | 7 974 | 13,41 | 513 | 28,89 | ||||
| 2025-07-16 | 13F | Moisand Fitzgerald Tamayo, LLC | 10 208 | −10,70 | 635 | −1,85 | ||||
| 2025-08-12 | 13F | Proequities, Inc. | 0 | 0 | ||||||
| 2025-07-31 | 13F | Cambridge Investment Research Advisors, Inc. | 4 425 | 18,79 | 0 | |||||
| 2025-08-14 | 13F | Betterment LLC | 4 179 | 0 | ||||||
| 2025-08-05 | 13F | Astra Wealth Partners LLC | 14 900 | 0,00 | 927 | 9,83 | ||||
| 2025-07-11 | 13F | Prosperity Planning, Inc. | 51 656 | 12,08 | 3 215 | 23,05 | ||||
| 2025-08-12 | 13F | Jacobi Capital Management LLC | 23 121 | 11,36 | 1 439 | 22,28 | ||||
| 2025-05-15 | 13F | Gts Securities Llc | 0 | −100,00 | 0 | |||||
| 2025-08-08 | 13F | Austin Wealth Management, LLC | 189 173 | 35,47 | 11 774 | 45,48 | ||||
| 2025-08-06 | 13F | Entrewealth, Llc | 41 866 | 27,48 | 2 606 | 39,98 | ||||
| 2025-09-04 | 13F/A | Advisor Group Holdings, Inc. | 5 220 | 10,78 | 325 | 21,72 | ||||
| 2025-08-14 | 13F | Mml Investors Services, Llc | 6 703 | −4,79 | 0 | |||||
| 2025-07-25 | 13F | LRI Investments, LLC | 20 908 | 0,00 | 1 301 | 9,79 | ||||
| 2025-07-18 | 13F | PBMares Wealth Management LLC | 0 | −100,00 | 0 | |||||
| 2025-07-17 | 13F | Catalytic Wealth RIA, LLC | 13 184 | 45,28 | 821 | 59,53 | ||||
| 2025-07-31 | 13F | Brighton Jones Llc | 4 967 | 0,00 | 309 | 9,96 | ||||
| 2025-08-04 | 13F | Hantz Financial Services, Inc. | 469 | 0,00 | 0 | |||||
| 2025-07-16 | 13F | Meredith Wealth Planning | 18 151 | −11,56 | 1 130 | −2,92 | ||||
| 2025-08-14 | 13F | Raymond James Financial Inc | 13 669 | 851 | ||||||
| 2025-08-08 | 13F | Schwarz Dygos Wheeler Investment Advisors Llc | 6 984 | 9,38 | 435 | 20,22 | ||||
| 2025-07-09 | 13F | Emprise Bank | 4 765 | −6,24 | 297 | 2,78 | ||||
| 2025-08-12 | 13F | AlphaCore Capital LLC | 24 358 | 1 516 | ||||||
| 2025-07-31 | 13F | Oppenheimer & Co Inc | 8 176 | 22,36 | 509 | 34,39 | ||||
| 2025-07-17 | 13F | Oceanside Advisors LLC | 15 245 | 0,47 | 949 | 10,36 | ||||
| 2025-07-24 | 13F | Ronald Blue Trust, Inc. | 937 | 0,00 | 58 | 9,43 | ||||
| 2025-08-13 | 13F | IAG Wealth Partners, LLC | 539 447 | −0,62 | 33 572 | 9,12 | ||||
| 2025-08-14 | 13F | Royal Bank Of Canada | 741 | 46 | ||||||
| 2025-08-14 | 13F | Wells Fargo & Company/mn | 551 | 104,07 | 34 | 126,67 | ||||
| 2025-08-12 | 13F | Global Retirement Partners, LLC | 103 | 836,36 | 6 | |||||
| 2025-08-06 | 13F | Commonwealth Equity Services, Llc | 33 324 | 14,06 | 2 | 100,00 | ||||
| 2025-08-08 | 13F | Altiora Financial Group, LLC | 6 800 | 0,00 | 423 | 9,87 | ||||
| 2025-07-24 | 13F | WMG Financial Advisors, LLC | 4 600 | 0,00 | 286 | 10,00 | ||||
| 2025-05-16 | 13F/A | Kestra Investment Management, LLC | 0 | −100,00 | 0 | |||||
| 2025-08-12 | 13F | Prosperitas Financial LLC | 4 644 | 2,74 | 289 | 12,89 | ||||
| 2025-08-01 | 13F | Envestnet Asset Management Inc | 99 246 | 29,94 | 6 177 | 42,67 | ||||
| 2025-07-21 | 13F | Keb Asset Management, Llc | 9 736 | 606 | ||||||
| 2025-07-15 | 13F | Total Wealth Planning, Llc | 56 735 | −2,37 | 3 531 | 7,20 | ||||
| 2025-07-21 | 13F | Verus Financial Partners, Inc. | 13 825 | 1,81 | 871 | 15,06 | ||||
| 2025-08-12 | 13F | Nemes Rush Group LLC | 4 078 | 21,15 | 254 | 33,16 | ||||
| 2025-08-14 | 13F | Financial Advisory Service, Inc. | 280 322 | 2,58 | 17 446 | 12,64 | ||||
| 2025-07-10 | 13F | Cypress Point Wealth Management, LLC | 26 605 | −0,24 | 1 656 | 9,53 | ||||
| 2025-07-25 | 13F | Cwm, Llc | 11 734 | −1,80 | 1 | |||||
| 2025-08-15 | 13F | CI Private Wealth, LLC | 58 724 | 1 517,74 | 3 655 | 1 682,44 | ||||
| 2025-07-23 | 13F | Allegiance Financial Group Advisory Services LLC | 250 568 | 7,86 | 15 594 | 18,44 | ||||
| 2025-08-14 | 13F | Warren Averett Asset Management, LLC | 4 835 | 301 | ||||||
| 2025-08-07 | 13F | Tillman Hartley LLC | 24 584 | −0,52 | 1 530 | 9,21 | ||||
| 2025-08-21 | 13F | Aveo Capital Partners, LLC | 0 | −100,00 | 0 | |||||
| 2025-07-31 | 13F | Insight Wealth Partners, LLC | 11 713 | 8,42 | 729 | 18,95 | ||||
| 2025-08-06 | 13F | ORBA Wealth Advisors, L.L.C. | 34 071 | −19,90 | 2 120 | −12,03 | ||||
| 2025-08-07 | 13F | Addison Advisors LLC | 1 835 | −2,65 | 114 | 7,55 | ||||
| 2025-08-12 | 13F | Jpmorgan Chase & Co | 0 | −100,00 | 0 | |||||
| 2025-04-28 | 13F | Redmont Wealth Advisors Llc | 1 848 | −96,34 | 105 | −96,04 | ||||
| 2025-07-08 | 13F | Atwood & Palmer Inc | 468 898 | 2,78 | 29 182 | 12,86 | ||||
| 2025-07-30 | 13F | Forum Financial Management, LP | 4 789 | 0,00 | 298 | 9,96 | ||||
| 2025-08-12 | 13F | American Century Companies Inc | 2 126 943 | 54,81 | 132 370 | 69,98 | ||||
| 2025-07-23 | 13F | Wealth Management Nebraska | 80 463 | −0,06 | 4 996 | 9,47 | ||||
| 2025-07-10 | 13F | Wedmont Private Capital | 40 669 | 47,48 | 2 563 | 70,41 | ||||
| 2025-07-15 | 13F | Vestment Financial LLC | 45 390 | 4,69 | 2 838 | 15,23 | ||||
| 2025-08-05 | 13F | Golden Bell Financial Planning LLC | 114 272 | −6,88 | 7 112 | 2,24 | ||||
| 2025-05-06 | 13F | Venturi Wealth Management, LLC | 0 | −100,00 | 0 | |||||
| 2025-07-28 | NP | AVNM - Avantis All International Markets Equity ETF | 1 000 479 | 170,61 | 61 730 | 198,53 | ||||
| 2025-07-30 | 13F | Bayshore Asset Management, Llc | 119 335 | 2,33 | 7 427 | 12,36 | ||||
| 2025-08-07 | 13F | Atala Financial Inc | 3 340 | 0,00 | 208 | 9,52 |