Grundläggande statistik
| Institutionella ägare | 132 total, 132 long only, 0 short only, 0 long/short - change of 4,76% MRQ |
| Genomsnittlig portföljallokering | 1.0759 % - change of −5,07% MRQ |
| Institutionella aktier (lång) | 25 037 539 (ex 13D/G) - change of 1,45MM shares 6,14% MRQ |
| Institutionellt värde (lång) | $ 977 185 USD ($1000) |
Institutionellt ägande och aktieägare
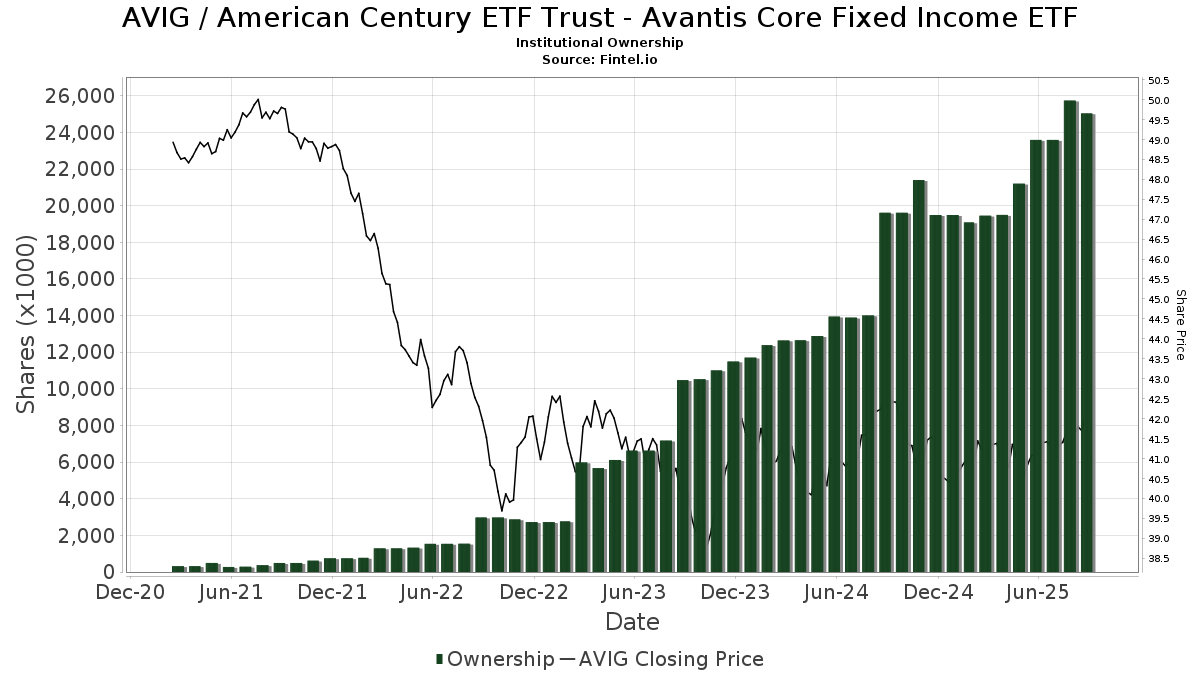
American Century ETF Trust - Avantis Core Fixed Income ETF (US:AVIG) har 132 Institutionella ägare och aktieägare som har lämnat in 13D/G- eller 13F-formulär till Securities Exchange Commission (SEC). Dessa institut innehar totalt 25,037,539 aktier. Största aktieägare inkluderar AE Wealth Management LLC, Simplicity Wealth,LLC, Verus Financial Partners, Inc., Hill Investment Group Partners, LLC, Pacific Life Fund Advisors LLC, PACIFIC SELECT FUND - PSF DFA Balanced Allocation Portfolio Class D, Envestnet Asset Management Inc, LPL Financial LLC, SRS Capital Advisors, Inc., and BCR Wealth Strategies, LLC .
American Century ETF Trust - Avantis Core Fixed Income ETF (ARCA:AVIG) Institutionell ägarstruktur visar institutioners och fonders nuvarande positioner i företaget, samt de senaste förändringarna i positionernas storlek. Större aktieägare kan vara enskilda investerare, fonder, hedgefonder eller institutioner. Bilaga 13D visar att investeraren äger (eller ägde) mer än 5% av företaget och avser (eller avsåg) att aktivt eftersträva en förändring av affärsstrategin. Schedule 13G indikerar en passiv investering på över 5%.
The share price as of September 12, 2025 is 42,24 / share. Previously, on September 16, 2024, the share price was 42,72 / share. This represents a decline of 1,15% over that period.
Fondsentimentets poäng
Fondsentimentet poängen(fka Ägarackumulation-poäng) visar vilka aktier som är mest köpta av fonder. Det är resultatet av en sofistikerad kvantitativ flerfaktormodell som identifierar företag med de högsta nivåerna av institutionell ackumulering. Poängsättningsmodellen använder en kombination av den totala ökningen av redovisade ägare, förändringarna i portföljallokeringarna för dessa ägare och andra mått. Siffran sträcker sig från 0 till 100, där högre siffror indikerar en högre nivå av ackumulering i förhållande till sina konkurrenter, och 50 är genomsnittet.
Uppdateringsfrekvens: Dagligen
Se Ownership Explorer, som innehåller en lista över de högst rankade företagen.
Institutionell sälj/köp-kvot
Förutom att rapportera vanliga eget kapital- och skuldemissioner måste institutioner med mer än 100MM tillgångar under förvaltning också avslöja sina innehav av sälj- och köpoptioner. Eftersom säljoptioner i allmänhet indikerar ett negativt sentiment och köpoptioner indikerar ett positivt sentiment, kan vi få en uppfattning om det övergripande institutionella sentimentet genom att plotta förhållandet mellan säljoptioner och köpoptioner. Diagrammet till höger visar det historiska förhållandet mellan sälj- och köpoptioner för detta instrument.
Genom att använda sälj/köp-kvoten som en indikator på aktieägarnas sentiment undviker man en av de största bristerna med att använda det totala institutionella ägandet, nämligen att en betydande del av de förvaltade tillgångarna investeras passivt för att följa index. Passivt förvaltade fonder köper vanligtvis inte optioner, så indikatorn för sälj/köp-kvoten ger en bättre bild av stämningen i aktivt förvaltade fonder.
13F- och NPORT-arkiveringar
Detaljer om 13F-arkiveringar är gratis. Detaljer om NP-arkiveringar kräver ett premiummedlemskap. Gröna rader indikerar nya positioner. Röda rader indikerar stängda positioner. Klicka på länk symbolen för att se hela transaktionshistoriken.
Uppgradera
för att låsa upp premiumdata och exportera till Excel ![]() .
.
| Fil Datum | Källa | Investerare | Typ | Genomsnittligt pris (beräknat) |
Aktier | Δ Aktier (%) |
Rapporterat värde (1000 USD) |
Δ Värde (%) |
Portföljallokering (%) |
|
|---|---|---|---|---|---|---|---|---|---|---|
| 2025-07-17 | 13F | Mattern Wealth Management LLC | 117 364 | −2,11 | 4 885 | −1,57 | ||||
| 2025-07-25 | 13F | BCR Wealth Strategies, LLC | 622 639 | 4,67 | 26 | 4,17 | ||||
| 2025-07-24 | 13F | PDS Planning, Inc | 0 | −100,00 | 0 | |||||
| 2025-07-25 | 13F | Index Fund Advisors, Inc. | 58 252 | 0,28 | 2 424 | 0,83 | ||||
| 2025-07-23 | 13F | Quarry Hill Advisors, Llc | 17 379 | 5,03 | 723 | 5,70 | ||||
| 2025-07-28 | 13F | Morris Financial Concepts, Inc. | 5 259 | 0,10 | 219 | 0,46 | ||||
| 2025-08-13 | 13F | WCG Wealth Advisors LLC | 34 000 | 10,41 | 1 415 | 11,07 | ||||
| 2025-05-02 | 13F | Capital A Wealth Management, LLC | 34 | 0,00 | 1 | 0,00 | ||||
| 2025-08-05 | 13F | Allodium Investment Consultants, LLC | 204 927 | 17,98 | 8 529 | 18,64 | ||||
| 2025-05-08 | 13F | Plante Moran Financial Advisors, LLC | 0 | −100,00 | 0 | |||||
| 2025-08-14 | 13F | Comerica Bank | 2 335 | 0,00 | 97 | 1,04 | ||||
| 2025-07-15 | 13F | FLP Wealth Management, LLC | 0 | −100,00 | 0 | |||||
| 2025-07-25 | 13F | Lion Street Advisors, LLC | 38 552 | 11,71 | 1 605 | 12,32 | ||||
| 2025-08-12 | 13F | Global Retirement Partners, LLC | 558 | 1,82 | 23 | 4,55 | ||||
| 2025-08-14 | 13F | Citadel Advisors Llc | 51 935 | 66,73 | 2 162 | 67,65 | ||||
| 2025-07-23 | 13F | Morey & Quinn Wealth Partners, LLC | 11 399 | 114,07 | 474 | 115,45 | ||||
| 2025-08-11 | 13F | Mach-1 Financial Group, Inc. | 0 | −100,00 | 0 | |||||
| 2025-08-14 | 13F | Hrt Financial Lp | 15 375 | 1 | ||||||
| 2025-07-28 | 13F | WealthPlan Investment Management, LLC | 32 201 | 1 340 | ||||||
| 2025-08-15 | 13F | Kestra Advisory Services, LLC | 8 290 | −6,36 | 345 | −5,74 | ||||
| 2025-08-14 | 13F | Aqr Capital Management Llc | 30 100 | 0,00 | 1 253 | 0,56 | ||||
| 2025-07-11 | 13F | SILVER OAK SECURITIES, Inc | 64 826 | 1,76 | 2 698 | 2,55 | ||||
| 2025-07-24 | 13F | Us Bancorp \de\ | 1 954 | 0,00 | 81 | 1,25 | ||||
| 2025-08-12 | 13F | SRS Capital Advisors, Inc. | 687 001 | 6,45 | 28 593 | 7,04 | ||||
| 2025-08-13 | 13F | Jones Financial Companies Lllp | 6 376 | 30,90 | 264 | 31,34 | ||||
| 2025-08-08 | 13F | Creative Planning | 460 006 | 2,60 | 19 145 | 3,17 | ||||
| 2025-08-13 | 13F | Balance Wealth, LLC | 14 960 | −1,40 | 623 | −0,96 | ||||
| 2025-08-12 | 13F | Jpmorgan Chase & Co | 1 352 | 56 | ||||||
| 2025-08-14 | 13F | Susquehanna International Group, Llp | 72 606 | 21,27 | 3 022 | 21,91 | ||||
| 2025-07-15 | 13F | Bannerman Wealth Management Group, Llc | 55 463 | 925,95 | 2 308 | 934,98 | ||||
| 2025-08-08 | 13F | Tortoise Investment Management, LLC | 50 | 0,00 | 2 | 0,00 | ||||
| 2025-08-08 | 13F | Kingsview Wealth Management, LLC | 5 218 | 217 | ||||||
| 2025-07-15 | 13F | Regatta Capital Group, Llc | 503 211 | 1,98 | 20 944 | 2,55 | ||||
| 2025-08-14 | 13F | Diversify Wealth Management, Llc | 14 211 | 10,09 | 591 | 10,67 | ||||
| 2025-05-01 | 13F | Quest 10 Wealth Builders, Inc. | 688 | 2,84 | 28 | 3,70 | ||||
| 2025-08-05 | 13F | Strategic Financial Concepts, LLC | 224 932 | 10,67 | 9 362 | 11,28 | ||||
| 2025-07-08 | 13F | Apella Capital, LLC | 26 433 | −35,17 | 1 089 | −34,63 | ||||
| 2025-08-06 | 13F | Spurstone Advisory Services, LLC | 15 | 0,00 | 1 | |||||
| 2025-08-13 | 13F | Baird Financial Group, Inc. | 8 023 | 0,00 | 334 | 0,30 | ||||
| 2025-07-28 | NP | AVMA - Avantis Moderate Allocation ETF | 147 284 | −6,39 | 6 053 | −7,40 | ||||
| 2025-07-17 | 13F | KWB Wealth | 5 492 | −10,10 | 227 | −8,10 | ||||
| 2025-07-16 | 13F | Plancorp, LLC | 142 407 | 0,62 | 5 927 | 1,16 | ||||
| 2025-08-01 | 13F | Rossby Financial, LCC | 302 | 0,00 | 13 | 0,00 | ||||
| 2025-08-18 | 13F/A | Kestra Investment Management, LLC | 100 230 | 112,07 | 4 172 | 113,24 | ||||
| 2025-08-08 | 13F | Pacific Life Fund Advisors LLC | 1 129 233 | 13,28 | 46 999 | 13,91 | ||||
| 2025-08-07 | 13F | Summit X, LLC | 40 885 | −0,71 | 1 702 | −0,18 | ||||
| 2025-08-08 | 13F | Larson Financial Group LLC | 49 | 2,08 | 2 | 0,00 | ||||
| 2025-08-14 | 13F | UBS Group AG | 299 | −33,85 | 12 | −33,33 | ||||
| 2025-07-23 | 13F | L.K. Benson & Company, P.C. | 30 537 | −20,94 | 1 271 | −20,53 | ||||
| 2025-08-12 | 13F | Change Path, LLC | 12 466 | −68,94 | 519 | −68,81 | ||||
| 2025-07-31 | 13F | Buckingham Strategic Partners | 447 245 | 5 333,01 | 18 614 | 5 374,71 | ||||
| 2025-08-08 | 13F | Good Life Advisors, LLC | 78 419 | −1,35 | 3 264 | −0,82 | ||||
| 2025-07-10 | 13F | Wealth Enhancement Advisory Services, Llc | 5 673 | 235 | ||||||
| 2025-08-12 | 13F | BWM Planning, LLC | 0 | −100,00 | 0 | |||||
| 2025-08-14 | 13F | Wiley Bros.-aintree Capital, Llc | 97 976 | 4 078 | ||||||
| 2025-08-14 | 13F | Jane Street Group, Llc | 131 114 | 1 712,47 | 5 457 | 1 724,75 | ||||
| 2025-08-14 | 13F | Visionary Wealth Advisors | 7 967 | −82,96 | 332 | −82,89 | ||||
| 2025-07-15 | 13F | Signet Financial Management, Llc | 0 | −100,00 | 0 | −100,00 | ||||
| 2025-07-16 | 13F | Leading Edge Financial Planning LLC | 15 466 | 41,06 | 644 | 41,94 | ||||
| 2025-08-14 | 13F | Beaird Harris Wealth Management, LLC | 11 870 | −1,25 | 494 | −0,60 | ||||
| 2025-04-28 | 13F | Great Point Wealth Advisors, LLC | 9 266 | 0,00 | 384 | 2,13 | ||||
| 2025-07-31 | 13F | Curio Wealth, Llc | 1 349 | 67 350,00 | 56 | 0,00 | ||||
| 2025-08-12 | 13F | Park Square Financial Group, LLC | 14 798 | 562,40 | 616 | 568,48 | ||||
| 2025-07-09 | 13F | Tounjian Advisory Partners, Llc | 57 622 | −0,47 | 2 385 | −0,46 | ||||
| 2025-08-07 | 13F | Allworth Financial LP | 6 901 | −6,67 | 287 | −5,28 | ||||
| 2025-07-15 | 13F | Traction Financial Partners, LLC | 6 265 | 261 | ||||||
| 2025-07-21 | 13F | Mattern Capital Management, Llc | 141 794 | 17,93 | 5 901 | 18,59 | ||||
| 2025-08-06 | 13F | AE Wealth Management LLC | 4 188 949 | 11,90 | 174 344 | 12,52 | ||||
| 2025-08-14 | 13F | Cardiff Park Advisors, Llc | 4 595 | 0,00 | 191 | 0,53 | ||||
| 2025-05-05 | 13F | Nwam Llc | 0 | −100,00 | 0 | |||||
| 2025-05-15 | 13F | Two Sigma Securities, Llc | 0 | −100,00 | 0 | |||||
| 2025-08-14 | 13F | Herold Advisors, Inc. | 137 227 | −14,60 | 5 711 | −14,13 | ||||
| 2025-07-10 | 13F | Pacific Asset Management, LLC | 34 305 | 4,73 | 1 428 | 5,31 | ||||
| 2025-08-01 | 13F | Winebrenner Capital Management Llc | 7 119 | 296 | ||||||
| 2025-07-08 | 13F | Ehrlich Financial Group | 0 | −100,00 | 0 | |||||
| 2025-04-18 | 13F | Creative Capital Management Investments LLC | 0 | −100,00 | 0 | |||||
| 2025-08-01 | 13F | Red Lighthouse Investment Management, Llc | 81 411 | −9,70 | 3 388 | −8,90 | ||||
| 2025-08-08 | 13F | Gts Securities Llc | 0 | −100,00 | 0 | |||||
| 2025-08-12 | 13F | LPL Financial LLC | 767 656 | 15,62 | 31 950 | 16,26 | ||||
| 2025-05-13 | 13F | EverSource Wealth Advisors, LLC | 0 | −100,00 | 0 | |||||
| 2025-07-31 | 13F | Cambridge Investment Research Advisors, Inc. | 94 506 | 28,69 | 4 | 0,00 | ||||
| 2025-08-13 | 13F | Cresset Asset Management, LLC | 168 486 | 6,68 | 7 012 | 7,28 | ||||
| 2025-07-29 | 13F | Werba Rubin Papier Wealth Management | 14 509 | 604 | ||||||
| 2025-08-14 | 13F | Betterment LLC | 18 305 | 1,02 | 1 | |||||
| 2025-08-14 | 13F | Mml Investors Services, Llc | 115 842 | −5,51 | 5 | −20,00 | ||||
| 2025-07-28 | 13F | Mutual Advisors, LLC | 6 969 | −5,24 | 288 | −4,64 | ||||
| 2025-07-11 | 13F | Quantum Financial Advisors, LLC | 105 697 | −1,69 | 4 399 | −1,12 | ||||
| 2025-07-15 | 13F | Elevated Capital Advisors, LLC | 21 965 | 0,00 | 909 | 0,00 | ||||
| 2025-08-14 | 13F | Raymond James Financial Inc | 348 825 | 6,28 | 14 518 | 6,87 | ||||
| 2025-07-17 | 13F | Beacon Capital Management, LLC | 1 864 | 78 | ||||||
| 2025-08-12 | 13F | Proequities, Inc. | 0 | 0 | ||||||
| 2025-05-16 | 13F | Coppell Advisory Solutions LLC | 0 | −100,00 | 0 | |||||
| 2025-08-13 | 13F | Flow Traders U.s. Llc | 0 | −100,00 | 0 | |||||
| 2025-08-14 | 13F | Planwiser Financial, Llc | 74 854 | −9,10 | 3 092 | −8,50 | ||||
| 2025-08-18 | NP | PACIFIC SELECT FUND - PSF DFA Balanced Allocation Portfolio Class D | 1 129 233 | 13,28 | 46 999 | 13,91 | ||||
| 2025-07-16 | 13F | Meredith Wealth Planning | 5 657 | 1,14 | 235 | 1,73 | ||||
| 2025-07-21 | 13F | Verus Financial Partners, Inc. | 1 354 347 | 3,22 | 55 935 | 4,46 | ||||
| 2025-07-22 | 13F | Echo Wealth Management, LLC | 516 788 | 30,42 | 21 509 | 31,14 | ||||
| 2025-07-18 | 13F | Dogwood Wealth Management LLC | 127 151 | −5,79 | 5 230 | −6,37 | ||||
| 2025-07-28 | 13F | Axxcess Wealth Management, Llc | 212 879 | 0,73 | 8 860 | 1,29 | ||||
| 2025-07-14 | 13F | Park Avenue Securities Llc | 464 250 | 8,33 | 19 | 11,76 | ||||
| 2025-08-18 | 13F/A | National Bank Of Canada /fi/ | 5 204 | 89,51 | 216 | 91,96 | ||||
| 2025-07-17 | 13F | LexAurum Advisors, LLC | 405 379 | 7,36 | 16 872 | 7,95 | ||||
| 2025-08-08 | 13F | Schwarz Dygos Wheeler Investment Advisors Llc | 19 173 | 3,74 | 798 | 4,31 | ||||
| 2025-07-22 | 13F | Wealthcare Advisory Partners LLC | 9 252 | 1,15 | 385 | 1,85 | ||||
| 2025-08-15 | 13F | CI Private Wealth, LLC | 409 239 | −80,59 | 17 033 | −80,48 | ||||
| 2025-07-24 | 13F | Endeavor Private Wealth, Inc. | 122 019 | 26,26 | 5 078 | 26,95 | ||||
| 2025-08-15 | 13F | Morgan Stanley | 3 640 | 113,36 | 151 | 115,71 | ||||
| 2025-07-17 | 13F | Oceanside Advisors LLC | 7 962 | −0,85 | 331 | −0,30 | ||||
| 2025-07-17 | 13F | SC&H Financial Advisors, Inc. | 65 881 | 4,18 | 2 742 | 4,74 | ||||
| 2025-08-14 | 13F | Wells Fargo & Company/mn | 111 883 | −45,50 | 4 657 | −45,20 | ||||
| 2025-08-21 | 13F | Aveo Capital Partners, LLC | 0 | −100,00 | 0 | |||||
| 2025-08-11 | 13F | Kingdom Financial Group LLC. | 14 464 | 602 | ||||||
| 2025-08-14 | 13F | CoreCap Advisors, LLC | 73 440 | 35,50 | 3 057 | 36,25 | ||||
| 2025-04-14 | 13F | Farther Finance Advisors, LLC | 0 | −100,00 | 0 | −100,00 | ||||
| 2025-08-14 | 13F | Mariner, LLC | 159 685 | 12,45 | 6 646 | 13,08 | ||||
| 2025-07-09 | 13F | Bank of New Hampshire | 12 450 | 518 | ||||||
| 2025-08-04 | 13F | Arcadia Wealth Management, Inc. | 60 929 | 6,01 | 2 536 | 6,60 | ||||
| 2025-08-14 | 13F | Eaton-Cambridge Inc. | 32 981 | −16,39 | 1 373 | −15,93 | ||||
| 2025-08-15 | 13F | Keel Point, LLC | 4 863 | 0,00 | 202 | 0,50 | ||||
| 2025-07-24 | 13F | WMG Financial Advisors, LLC | 37 046 | 6,29 | 1 542 | 6,87 | ||||
| 2025-07-25 | 13F | Cwm, Llc | 8 725 | −14,69 | 0 | |||||
| 2025-07-17 | 13F | Centennial Wealth Advisory LLC | 476 954 | 3,97 | 19 858 | 4,59 | ||||
| 2025-07-23 | 13F | Allegiance Financial Group Advisory Services LLC | 436 308 | 6,41 | 18 159 | 7,00 | ||||
| 2025-08-11 | 13F | Trajan Wealth LLC | 179 275 | −1,92 | 7 461 | −1,37 | ||||
| 2025-08-14 | 13F | Royal Bank Of Canada | 424 828 | 18,96 | 17 682 | 19,63 | ||||
| 2025-08-07 | 13F | Tillman Hartley LLC | 16 779 | 48,34 | 698 | 49,15 | ||||
| 2025-07-08 | 13F | Goldstone Financial Group, LLC | 19 560 | −5,03 | 809 | −5,16 | ||||
| 2025-07-21 | 13F | Keb Asset Management, Llc | 7 722 | 0,00 | 321 | 0,63 | ||||
| 2025-08-06 | 13F | Commonwealth Equity Services, Llc | 203 931 | 5,39 | 8 | 0,00 | ||||
| 2025-08-08 | 13F | Truepoint, Inc. | 51 540 | 5,61 | 2 145 | 6,24 | ||||
| 2025-08-12 | 13F | Nemes Rush Group LLC | 315 | 0,00 | 13 | 0,00 | ||||
| 2025-07-08 | 13F | Atwood & Palmer Inc | 6 635 | 0,00 | 276 | 0,73 | ||||
| 2025-07-09 | 13F | Dynamic Advisor Solutions LLC | 46 436 | 1 933 | ||||||
| 2025-07-31 | 13F | CVA Family Office, LLC | 2 170 | 0,00 | 90 | 1,12 | ||||
| 2025-07-22 | 13F | Simplicity Wealth,LLC | 2 191 612 | 112,45 | 91 215 | 113,63 | ||||
| 2025-09-04 | 13F/A | Advisor Group Holdings, Inc. | 547 | 1,30 | 23 | 0,00 | ||||
| 2025-07-31 | 13F | Orion Capital Management LLC | 1 463 | 61 | ||||||
| 2025-08-01 | 13F | Envestnet Asset Management Inc | 1 090 700 | 12,71 | 45 395 | 13,33 | ||||
| 2025-07-23 | 13F | Wealth Management Nebraska | 14 618 | −14,32 | 606 | −14,16 | ||||
| 2025-04-28 | 13F | Clune & Associates, Ltd. | 0 | −100,00 | 0 | |||||
| 2025-08-06 | 13F | Golden State Wealth Management, LLC | 15 852 | 4,95 | 660 | 5,44 | ||||
| 2025-05-06 | 13F | Financial Partners Group, Inc | 0 | −100,00 | 0 | −100,00 | ||||
| 2025-08-12 | 13F | Hill Investment Group Partners, LLC | 1 210 640 | −2,03 | 50 387 | −1,49 | ||||
| 2025-08-14 | 13F | Great Valley Advisor Group, Inc. | 110 272 | −10,95 | 4 589 | −10,46 | ||||
| 2025-08-12 | 13F | American Century Companies Inc | 178 198 | 10,90 | 7 417 | 11,52 | ||||
| 2025-08-13 | 13F | B&D White Capital Company, LLC | 128 882 | 1,75 | 5 364 | 2,33 | ||||
| 2025-07-15 | 13F | Highland Financial Advisors, LLC | 507 944 | 0,79 | 21 141 | 1,35 | ||||
| 2025-07-24 | 13F | Grand Wealth Management, Llc | 33 597 | −23,95 | 1 398 | −23,52 | ||||
| 2025-08-14 | 13F | IHT Wealth Management, LLC | 64 365 | 20,42 | 2 679 | 21,07 | ||||
| 2025-08-07 | 13F | Resources Investment Advisors, LLC. | 7 959 | −1,00 | 331 | −0,30 | ||||
| 2025-05-13 | 13F | Steward Partners Investment Advisory, Llc | 0 | −100,00 | 0 |