Grundläggande statistik
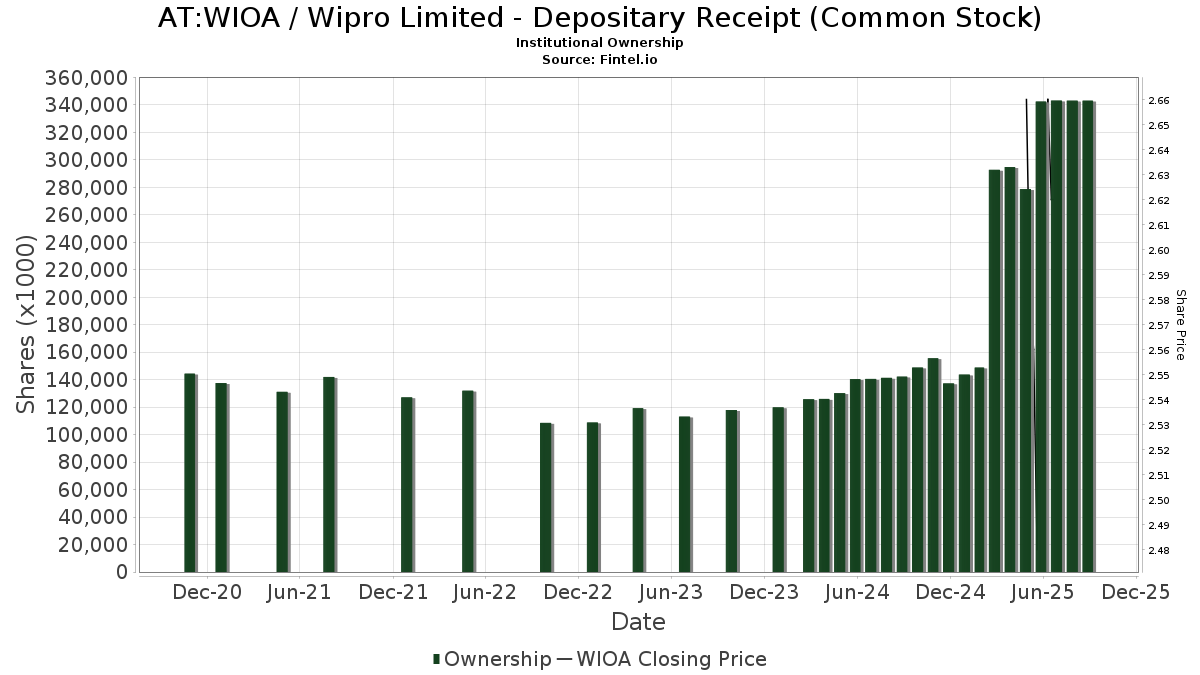
| Institutionella ägare | 372 total, 372 long only, 0 short only, 0 long/short - change of 5,71% MRQ |
| Aktiepris | 2,52 |
| Genomsnittlig portföljallokering | 0.1281 % - change of −4,07% MRQ |
| Institutionella aktier (lång) | 348 292 562 (ex 13D/G) - change of 57,99MM shares 20,34% MRQ |
| Institutionellt värde (lång) | $ 950 113 USD ($1000) |
Institutionellt ägande och aktieägare
Wipro Limited - Depositary Receipt (Common Stock) (AT:WIOA) har 372 Institutionella ägare och aktieägare som har lämnat in 13D/G- eller 13F-formulär till Securities Exchange Commission (SEC). Dessa institut innehar totalt 348,292,562 aktier. Största aktieägare inkluderar BlackRock, Inc., Vanguard Group Inc, State Street Corp, Acadian Asset Management Llc, Morgan Stanley, Millennium Management Llc, First Trust Advisors Lp, FVD - First Trust Value Line Dividend Index Fund, VGTSX - Vanguard Total International Stock Index Fund Investor Shares, and Bnp Paribas Arbitrage, Sa .
Wipro Limited - Depositary Receipt (Common Stock) (WBAG:WIOA) Institutionell ägarstruktur visar institutioners och fonders nuvarande positioner i företaget, samt de senaste förändringarna i positionernas storlek. Större aktieägare kan vara enskilda investerare, fonder, hedgefonder eller institutioner. Bilaga 13D visar att investeraren äger (eller ägde) mer än 5% av företaget och avser (eller avsåg) att aktivt eftersträva en förändring av affärsstrategin. Schedule 13G indikerar en passiv investering på över 5%.
The share price as of July 10, 2025 is 2,52 / share. Previously, on May 9, 2025, the share price was 2,52 / share. This represents an increase of 0,00% over that period.
Fondsentimentets poäng
Fondsentimentet poängen(fka Ägarackumulation-poäng) visar vilka aktier som är mest köpta av fonder. Det är resultatet av en sofistikerad kvantitativ flerfaktormodell som identifierar företag med de högsta nivåerna av institutionell ackumulering. Poängsättningsmodellen använder en kombination av den totala ökningen av redovisade ägare, förändringarna i portföljallokeringarna för dessa ägare och andra mått. Siffran sträcker sig från 0 till 100, där högre siffror indikerar en högre nivå av ackumulering i förhållande till sina konkurrenter, och 50 är genomsnittet.
Uppdateringsfrekvens: Dagligen
Se Ownership Explorer, som innehåller en lista över de högst rankade företagen.
13F- och NPORT-arkiveringar
Detaljer om 13F-arkiveringar är gratis. Detaljer om NP-arkiveringar kräver ett premiummedlemskap. Gröna rader indikerar nya positioner. Röda rader indikerar stängda positioner. Klicka på länk symbolen för att se hela transaktionshistoriken.
Uppgradera
för att låsa upp premiumdata och exportera till Excel ![]() .
.
| Fil Datum | Källa | Investerare | Typ | Genomsnittligt pris (beräknat) |
Aktier | Δ Aktier (%) |
Rapporterat värde (1000 USD) |
Δ Värde (%) |
Portföljallokering (%) |
|
|---|---|---|---|---|---|---|---|---|---|---|
| 2025-07-17 | 13F | Nelson, Van Denburg & Campbell Wealth Management Group, LLC | 53 818 | 1,77 | 163 | 0,62 | ||||
| 2025-06-26 | NP | BLACKROCK FUNDS - BlackRock Advantage Emerging Markets Fund Investor A Shares | 68 928 | 1 614,63 | 197 | 1 307,14 | ||||
| 2025-08-15 | 13F | Morgan Stanley | 20 786 088 | −22,03 | 62 774 | −23,05 | ||||
| 2025-08-05 | 13F | Ellevest, Inc. | 0 | −100,00 | 0 | |||||
| 2025-08-08 | 13F | Geode Capital Management, Llc | 107 021 | 14,27 | 323 | 12,94 | ||||
| 2025-05-13 | 13F | Triglav Skladi, D.o.o. | 0 | 0 | ||||||
| 2025-08-12 | 13F | Aigen Investment Management, Lp | 0 | −100,00 | 0 | |||||
| 2025-07-21 | 13F | Ameritas Advisory Services, LLC | 2 | 0 | ||||||
| 2025-08-14 | 13F | Evergreen Capital Management Llc | 134 483 | 325,18 | 406 | 322,92 | ||||
| 2025-08-14 | 13F | Ieq Capital, Llc | 121 079 | 26,11 | 366 | 24,57 | ||||
| 2025-08-08 | 13F | Creative Planning | 3 730 772 | 21,18 | 11 267 | 19,60 | ||||
| 2025-08-08 | 13F | Larson Financial Group LLC | 0 | −100,00 | 0 | −100,00 | ||||
| 2025-07-22 | 13F | Simplicity Wealth,LLC | 20 568 | 62 | ||||||
| 2025-08-14 | 13F | Atomi Financial Group, Inc. | 39 273 | −8,36 | 119 | −9,92 | ||||
| 2025-08-15 | 13F | WealthCollab, LLC | 14 616 | −24,09 | 44 | −24,14 | ||||
| 2025-08-28 | NP | NZAC - SPDR MSCI ACWI Low Carbon Target ETF | 32 960 | 4,89 | 100 | 3,13 | ||||
| 2025-07-28 | NP | AVEM - Avantis Emerging Markets Equity ETF This fund is a listed as child fund of American Century Companies Inc and if that institution has disclosed ownership in this security, then these positions will not be double counted when calculating total shares and total value | 2 061 435 | 20,83 | 5 937 | 6,42 | ||||
| 2025-07-17 | 13F | Sound Income Strategies, LLC | 32 | 0,00 | 0 | |||||
| 2025-08-07 | 13F | Zurcher Kantonalbank (Zurich Cantonalbank) | 172 048 | 0,00 | 520 | −1,33 | ||||
| 2025-08-14 | 13F | Citadel Advisors Llc | Put | 0 | −100,00 | 0 | ||||
| 2025-08-06 | 13F | Ovata Capital Management Ltd | 1 719 500 | −33,87 | 5 333 | −32,61 | ||||
| 2025-07-21 | 13F | Qrg Capital Management, Inc. | 123 313 | 78,78 | 372 | 76,30 | ||||
| 2025-07-28 | 13F | Ritholtz Wealth Management | 133 067 | −44,56 | 402 | −45,37 | ||||
| 2025-08-14 | 13F | Mercer Global Advisors Inc /adv | 71 574 | 0,78 | 216 | −0,46 | ||||
| 2025-08-06 | 13F | Penserra Capital Management LLC | 6 446 407 | 42,71 | 19 | 46,15 | ||||
| 2025-07-31 | 13F | MQS Management LLC | 0 | −100,00 | 0 | |||||
| 2025-08-04 | 13F | Creekmur Asset Management LLC | 0 | 0 | ||||||
| 2025-07-31 | 13F | BIP Alliance, LLC | 22 690 | −32,87 | 69 | −33,98 | ||||
| 2025-08-11 | 13F | Frank, Rimerman Advisors LLC | 420 008 | 3 247,21 | 1 268 | 3 236,84 | ||||
| 2025-08-04 | 13F | Simon Quick Advisors, Llc | 54 506 | −20,24 | 165 | −21,53 | ||||
| 2025-06-26 | NP | BLACKROCK FUNDS - BlackRock Defensive Advantage Emerging Markets Fund Institutional This fund is a listed as child fund of BlackRock, Inc. and if that institution has disclosed ownership in this security, then these positions will not be double counted when calculating total shares and total value | 21 515 | 0,00 | 62 | −21,79 | ||||
| 2025-08-05 | 13F | Crestwood Advisors Group LLC | 11 033 | −21,03 | 33 | −21,43 | ||||
| 2025-08-12 | 13F | Franklin Resources Inc | 67 306 | −9,03 | 203 | −10,18 | ||||
| 2025-08-13 | 13F | Centiva Capital, LP | 14 430 | −84,89 | 44 | −85,27 | ||||
| 2025-08-22 | NP | FEMR - Fidelity Enhanced Emerging Markets ETF | 47 684 | 0,00 | 144 | −0,69 | ||||
| 2025-07-29 | 13F | Angeles Wealth Management, Llc | 29 028 | 42,75 | 88 | 40,32 | ||||
| 2025-08-12 | 13F | Gitterman Wealth Management, LLC | 50 781 | −2,04 | 153 | −3,16 | ||||
| 2025-08-13 | 13F | Townsquare Capital Llc | 0 | −100,00 | 0 | |||||
| 2025-05-06 | 13F | Venturi Wealth Management, LLC | 0 | −100,00 | 0 | |||||
| 2025-05-09 | 13F | CoreCap Advisors, LLC | 0 | −100,00 | 0 | |||||
| 2025-08-14 | 13F | Balyasny Asset Management Llc | 29 370 | 89 | ||||||
| 2025-08-15 | 13F | Tower Research Capital LLC (TRC) | 718 | −95,18 | 2 | −95,56 | ||||
| 2025-08-14 | 13F | Tcw Group Inc | 303 720 | −18,55 | 917 | −19,56 | ||||
| 2025-05-14 | 13F | BI Asset Management Fondsmaeglerselskab A/S | 0 | −100,00 | 0 | |||||
| 2025-07-09 | 13F | Beacon Financial Group | 13 202 | 24,55 | 40 | 21,88 | ||||
| 2025-04-16 | 13F | Tobam | 0 | −100,00 | 0 | |||||
| 2025-08-13 | 13F | EverSource Wealth Advisors, LLC | 95 101 | −3,58 | 287 | −4,65 | ||||
| 2025-08-18 | 13F | Geneos Wealth Management Inc. | 344 | 1 | ||||||
| 2025-07-17 | 13F | Clean Yield Group | 1 330 | −19,10 | 4 | −20,00 | ||||
| 2025-08-13 | 13F | GeoWealth Management, LLC | 37 605 | 19,09 | 114 | 17,71 | ||||
| 2025-08-14 | 13F | Wellington Management Group Llp | 1 152 298 | 41,55 | 3 480 | 39,72 | ||||
| 2025-08-14 | 13F | Headlands Technologies LLC | 2 827 | 9 | ||||||
| 2025-08-13 | 13F | Cresset Asset Management, LLC | 55 883 | 10,19 | 169 | 8,39 | ||||
| 2025-08-13 | 13F | Guggenheim Capital Llc | 15 040 | 45 | ||||||
| 2025-06-30 | NP | VT - Vanguard Total World Stock Index Fund ETF Shares | 1 187 604 | 0,00 | 3 397 | −22,07 | ||||
| 2025-04-29 | NP | BELSX - Boston Partners Emerging Markets Long/Short Fund Institutional Class | 224 937 | 384,10 | 736 | 126,85 | ||||
| 2025-07-22 | 13F | Penobscot Investment Management Company, Inc. | 29 502 | 0,00 | 89 | −1,11 | ||||
| 2025-07-28 | 13F | Duncker Streett & Co Inc | 2 | 0,00 | 0 | |||||
| 2025-08-04 | 13F | Atria Investments Llc | 67 080 | 203 | ||||||
| 2025-05-14 | 13F | Susquehanna International Group, Llp | 0 | −100,00 | 0 | |||||
| 2025-07-15 | 13F | Compagnie Lombard Odier SCmA | 30 000 | 200,00 | 91 | 200,00 | ||||
| 2025-08-15 | 13F | Keel Point, LLC | 16 405 | −15,54 | 50 | −16,95 | ||||
| 2025-08-27 | NP | RYWTX - Emerging Markets 2x Strategy Fund Class A | 15 040 | 141,68 | 45 | 136,84 | ||||
| 2025-07-25 | 13F | Johnson Investment Counsel Inc | 36 600 | 111 | ||||||
| 2025-08-12 | 13F | Jpmorgan Chase & Co | 5 712 604 | −5,67 | 17 252 | −6,90 | ||||
| 2025-08-11 | 13F | Integrated Quantitative Investments LLC | 755 416 | 56,60 | 2 281 | 54,54 | ||||
| 2025-08-14 | 13F | Mariner, LLC | 610 892 | 15,97 | 1 845 | 14,53 | ||||
| 2025-08-14 | 13F | EP Wealth Advisors, Inc. | 20 210 | 61 | ||||||
| 2025-08-05 | 13F | Bank Of Montreal /can/ | 62 087 | 0,25 | 188 | −1,06 | ||||
| 2025-07-11 | 13F | Pinnacle Bancorp, Inc. | 681 | 0,00 | 2 | 0,00 | ||||
| 2025-08-14 | 13F | D. E. Shaw & Co., Inc. | 0 | −100,00 | 0 | |||||
| 2025-08-27 | NP | THRIVENT SERIES FUND INC - Thrivent Partner Emerging Markets Equity Portfolio Class A | 17 777 | 0,00 | 54 | −1,85 | ||||
| 2025-08-13 | 13F | Causeway Capital Management Llc | 475 731 | −2,67 | 1 437 | −3,95 | ||||
| 2025-08-08 | 13F | Bailard, Inc. | 13 016 | 0,00 | 39 | 0,00 | ||||
| 2025-08-11 | 13F | Nomura Asset Management Co Ltd | 0 | −100,00 | 0 | |||||
| 2025-07-28 | NP | VCGEX - Emerging Economies Fund | 203 748 | −64,47 | 587 | −68,75 | ||||
| 2025-08-12 | 13F | Enterprise Financial Services Corp | 36 893 | 33,76 | 111 | 32,14 | ||||
| 2025-08-13 | 13F | Congress Wealth Management LLC / DE / | 12 871 | 39 | ||||||
| 2025-07-25 | 13F | Cwm, Llc | 37 654 | −5,27 | 0 | |||||
| 2025-07-28 | NP | NSI - National Security Emerging Markets Index ETF | 16 417 | 38,46 | 47 | 23,68 | ||||
| 2025-07-18 | 13F | Robeco Institutional Asset Management B.V. | 4 270 701 | 3,58 | 12 898 | 2,22 | ||||
| 2025-07-18 | 13F | Ewa, Llc | 15 869 | 2,71 | 48 | 0,00 | ||||
| 2025-07-23 | 13F | Prime Capital Investment Advisors, LLC | 26 850 | −19,91 | 81 | −20,59 | ||||
| 2025-07-18 | 13F | BSW Wealth Partners | 164 147 | 1,77 | 496 | 0,41 | ||||
| 2025-07-24 | 13F | Callan Family Office, LLC | 10 592 | 0,00 | 32 | −3,12 | ||||
| 2025-07-28 | 13F | Harbour Investments, Inc. | 994 | 0,00 | 3 | 0,00 | ||||
| 2025-08-08 | 13F | Pnc Financial Services Group, Inc. | 258 942 | 20,43 | 782 | 19,03 | ||||
| 2025-08-13 | 13F | Natixis Advisors, L.p. | 128 806 | −42,73 | 0 | |||||
| 2025-07-28 | NP | AVEEX - Avantis Emerging Markets Equity Fund Institutional Class This fund is a listed as child fund of American Century Companies Inc and if that institution has disclosed ownership in this security, then these positions will not be double counted when calculating total shares and total value | 128 256 | 0,00 | 369 | −11,93 | ||||
| 2025-08-26 | NP | FVD - First Trust Value Line Dividend Index Fund This fund is a listed as child fund of First Trust Advisors Lp and if that institution has disclosed ownership in this security, then these positions will not be double counted when calculating total shares and total value | 12 492 106 | −4,20 | 37 726 | −5,45 | ||||
| 2025-08-13 | 13F | Walleye Capital LLC | 0 | −100,00 | 0 | |||||
| 2025-08-14 | 13F | Ubs Asset Management Americas Inc | 529 661 | 11,80 | 1 600 | 10,35 | ||||
| 2025-08-12 | 13F | Rhumbline Advisers | 2 511 726 | −5,88 | 7 585 | −7,11 | ||||
| 2025-08-26 | NP | MASTER INVESTMENT PORTFOLIO - Total International ex U.S. Index Master Portfolio | 26 368 | 0,00 | 80 | −1,25 | ||||
| 2025-07-17 | 13F | HB Wealth Management, LLC | 53 733 | 12,23 | 162 | 10,96 | ||||
| 2025-08-05 | 13F | Simplex Trading, Llc | Call | 0 | −100,00 | 0 | ||||
| 2025-08-13 | 13F | Bare Financial Services, Inc | 201 | 0,00 | 1 | |||||
| 2025-08-14 | 13F | Bank Of America Corp /de/ | 7 690 677 | 298,91 | 23 226 | 293,71 | ||||
| 2025-07-23 | 13F | Canopy Partners, LLC | 91 653 | −6,67 | 277 | −8,00 | ||||
| 2025-08-06 | 13F | SOUTH STATE Corp | 0 | −100,00 | 0 | |||||
| 2025-08-13 | 13F | Flow Traders U.s. Llc | 30 504 | 0 | ||||||
| 2025-07-24 | 13F | PDS Planning, Inc | 186 269 | −8,45 | 563 | −9,65 | ||||
| 2025-08-05 | 13F | Key FInancial Inc | 1 516 | 0,00 | 5 | 0,00 | ||||
| 2025-05-15 | 13F/A | Clear Street Llc | Call | 0 | −100,00 | 0 | −100,00 | |||
| 2025-07-25 | 13F | Sequoia Financial Advisors, LLC | 582 930 | 55,85 | 1 760 | 53,85 | ||||
| 2025-07-31 | 13F | R Squared Ltd | 27 810 | 15,97 | 84 | 13,70 | ||||
| 2025-08-14 | 13F | XY Capital Ltd | 412 899 | 142,03 | 1 247 | 138,70 | ||||
| 2025-08-06 | 13F | Harvest Portfolios Group Inc. | 119 813 | −22,65 | 362 | −23,68 | ||||
| 2025-08-13 | 13F | Mount Yale Investment Advisors, LLC | 0 | −100,00 | 0 | −100,00 | ||||
| 2025-08-14 | 13F | Laird Norton Trust Company, Llc | 218 877 | −3,19 | 661 | −4,34 | ||||
| 2025-08-07 | 13F | Allworth Financial LP | 17 976 | 19,72 | 54 | 28,57 | ||||
| 2025-08-25 | 13F/A | Neuberger Berman Group LLC | 207 629 | 1 265,62 | 627 | 1 263,04 | ||||
| 2025-08-12 | 13F | American Century Companies Inc | 2 308 388 | 19,57 | 6 971 | 18,01 | ||||
| 2025-06-26 | NP | DFEM - Dimensional Emerging Markets Core Equity 2 ETF | 166 457 | 4,85 | 476 | −18,21 | ||||
| 2025-07-10 | 13F | Kozak & Associates, Inc. | 1 | 0,00 | 0 | |||||
| 2025-07-25 | 13F | CBOE Vest Financial, LLC | 10 108 | 31 | ||||||
| 2025-07-14 | 13F | Abound Wealth Management | 483 | 7,10 | 1 | 0,00 | ||||
| 2025-08-14 | 13F | Optiver Holding B.V. | 1 086 | −71,10 | 3 | −72,73 | ||||
| 2025-08-13 | 13F | Arrowstreet Capital, Limited Partnership | 2 364 490 | −21,07 | 7 141 | −22,10 | ||||
| 2025-06-26 | NP | DFEV - Dimensional Emerging Markets Value ETF | 398 733 | 4,28 | 1 140 | −18,75 | ||||
| 2025-08-14 | 13F | Vident Advisory, LLC | 1 306 934 | −18,76 | 3 947 | −19,83 | ||||
| 2025-08-14 | 13F | Raymond James Financial Inc | 79 132 | −84,36 | 239 | −84,63 | ||||
| 2025-08-13 | 13F | Fisher Asset Management, LLC | 7 020 730 | −2,77 | 21 203 | −4,04 | ||||
| 2025-07-28 | NP | AVXC - Avantis Emerging Markets ex-China Equity ETF | 25 872 | 37,50 | 75 | 21,31 | ||||
| 2025-08-27 | 13F/A | Squarepoint Ops LLC | 464 313 | −17,51 | 1 402 | −18,58 | ||||
| 2025-08-12 | 13F | Catalyst Funds Management Pty Ltd | 42 600 | 129 | ||||||
| 2025-08-14 | 13F | Jane Street Group, Llc | 613 629 | 173,41 | 1 853 | 170,12 | ||||
| 2025-08-12 | 13F | CIBC Private Wealth Group, LLC | 3 126 | 9 | ||||||
| 2025-08-14 | 13F | Two Sigma Securities, Llc | 21 758 | −74,87 | 66 | −75,38 | ||||
| 2025-08-13 | 13F | Russell Investments Group, Ltd. | 145 860 | 0,16 | 443 | 0,45 | ||||
| 2025-08-08 | 13F | Cetera Investment Advisers | 0 | −100,00 | 0 | |||||
| 2025-08-29 | NP | JVANX - International Equity Index Trust NAV | 88 126 | 0,00 | 266 | −1,12 | ||||
| 2025-08-11 | 13F | Vanguard Group Inc | 23 322 712 | −0,13 | 70 435 | −1,43 | ||||
| 2025-08-13 | 13F | Northern Trust Corp | 5 264 810 | −8,70 | 15 900 | −9,90 | ||||
| 2025-08-13 | 13F | Hsbc Holdings Plc | 365 231 | 21,64 | 1 103 | 20,15 | ||||
| 2025-08-13 | 13F | Hsbc Holdings Plc | Call | 90 000 | 0,00 | 275 | 0,00 | |||
| 2025-08-05 | 13F | Simplex Trading, Llc | 7 293 | 0 | ||||||
| 2025-05-13 | 13F | Horizon Investments, LLC | 0 | −100,00 | 0 | |||||
| 2025-08-07 | 13F | Connor, Clark & Lunn Investment Management Ltd. | 6 236 294 | −13,71 | 18 834 | −14,84 | ||||
| 2025-08-13 | 13F | Twin Peaks Wealth Advisors, LLC | 1 322 | 4 | ||||||
| 2025-08-13 | 13F | Grantham, Mayo, Van Otterloo & Co. LLC | 47 408 | −73,03 | 143 | −73,37 | ||||
| 2025-08-07 | 13F | Parkside Financial Bank & Trust | 4 085 | 174,90 | 12 | 200,00 | ||||
| 2025-08-14 | 13F | Van Eck Associates Corp | 270 276 | −23,29 | 1 | −100,00 | ||||
| 2025-05-12 | 13F | Quantinno Capital Management LP | 0 | −100,00 | 0 | |||||
| 2025-08-14 | 13F | UBS Group AG | 4 922 565 | 224,43 | 14 866 | 220,25 | ||||
| 2025-07-17 | 13F | CogentBlue Wealth Advisors, LLC | 14 347 | 19,41 | 43 | 19,44 | ||||
| 2025-05-05 | 13F | Lindbrook Capital, Llc | 102 514 | 2,60 | 314 | −11,33 | ||||
| 2025-08-14 | 13F | Mml Investors Services, Llc | 156 431 | 20,95 | 0 | |||||
| 2025-08-12 | 13F | XTX Topco Ltd | 108 544 | 328 | ||||||
| 2025-07-29 | NP | SGLIX - SGI Global Equity Fund Class I Shares | 373 738 | 118,31 | 1 076 | 92,49 | ||||
| 2025-06-25 | NP | TDVI - FT Vest Technology Dividend Target Income ETF | 7 414 | 21 | ||||||
| 2025-05-19 | NP | EISAX - Carillon ClariVest International Stock Fund A | 453 966 | 0,00 | 1 389 | −13,57 | ||||
| 2025-07-29 | 13F | Private Trust Co Na | 0 | −100,00 | 0 | |||||
| 2025-08-14 | 13F | Ameriprise Financial Inc | 32 261 | −22,67 | 97 | −23,62 | ||||
| 2025-07-21 | 13F | Mirae Asset Global Investments Co., Ltd. | 99 086 | 8,06 | 299 | 7,94 | ||||
| 2025-08-07 | 13F | Sierra Ocean, Llc | 8 169 | 1,44 | 25 | 0,00 | ||||
| 2025-07-16 | 13F | Kathmere Capital Management, LLC | 0 | −100,00 | 0 | |||||
| 2025-07-30 | 13F | DekaBank Deutsche Girozentrale | 75 049 | 0,00 | 0 | |||||
| 2025-06-26 | NP | HFIGX - Hartford Schroders Diversified Growth Fund Class I | 21 075 | 7,38 | 60 | −16,67 | ||||
| 2025-07-11 | 13F | Essex Savings Bank | 23 966 | −1,47 | 72 | −2,70 | ||||
| 2025-08-14 | 13F | Toroso Investments, LLC | 27 260 | 19,26 | 82 | 18,84 | ||||
| 2025-07-16 | 13F | Perigon Wealth Management, LLC | 11 204 | −25,71 | 34 | −28,26 | ||||
| 2025-07-28 | 13F | BRYN MAWR TRUST Co | 1 398 | −48,98 | 4 | −50,00 | ||||
| 2025-08-04 | 13F | Haven Private, LLC | 12 887 | 39 | ||||||
| 2025-08-14 | 13F | Erste Asset Management GmbH | 81 064 | 246 | ||||||
| 2025-08-29 | NP | MPLAX - Praxis International Index Fund Class A | 1 510 909 | 0,00 | 4 563 | −1,32 | ||||
| 2025-05-14 | 13F | Huntington National Bank | 0 | −100,00 | 0 | |||||
| 2025-05-15 | 13F | CAPROCK Group, Inc. | 321 328 | 5,56 | 983 | −8,73 | ||||
| 2025-08-14 | 13F | Promethos Capital, LLC | 3 313 678 | 6,30 | 10 005 | 4,89 | ||||
| 2025-08-13 | 13F | Mirabella Financial Services Llp | 0 | −100,00 | 0 | |||||
| 2025-08-14 | 13F | Hrt Financial Lp | 380 501 | 28,58 | 1 | |||||
| 2025-09-04 | 13F/A | Advisor Group Holdings, Inc. | 3 874 | 60,02 | 12 | 57,14 | ||||
| 2025-05-16 | 13F/A | Kestra Investment Management, LLC | 0 | −100,00 | 0 | |||||
| 2025-08-12 | 13F | Deutsche Bank Ag\ | 828 978 | 6,76 | 2 504 | 5,39 | ||||
| 2025-08-14 | 13F | Xponance, Inc. | 59 076 | 1,12 | 178 | 0,00 | ||||
| 2025-08-14 | 13F | Bnp Paribas | 0 | −100,00 | 8 | 14,29 | ||||
| 2025-07-15 | 13F | Ballentine Partners, LLC | 615 645 | 18,00 | 1 859 | 16,48 | ||||
| 2025-05-08 | 13F | Aspiring Ventures, LLC | 0 | −100,00 | 0 | −100,00 | ||||
| 2025-08-18 | 13F/A | Nomura Holdings Inc | 378 992 | −20,88 | 1 145 | −21,91 | ||||
| 2025-08-25 | NP | LEGR - First Trust Indxx Innovative Transaction & Process ETF This fund is a listed as child fund of First Trust Advisors Lp and if that institution has disclosed ownership in this security, then these positions will not be double counted when calculating total shares and total value | 428 786 | 5,38 | 1 295 | 3,94 | ||||
| 2025-08-06 | 13F | Hoxton Planning & Management, LLC | 0 | −100,00 | 0 | |||||
| 2025-08-13 | 13F | First Trust Advisors Lp | 15 336 970 | −1,37 | 46 318 | −2,66 | ||||
| 2025-08-12 | 13F | CenterBook Partners LP | 0 | −100,00 | 0 | −100,00 | ||||
| 2025-08-08 | 13F | Vestcor Inc | 495 016 | −51,71 | 1 | −66,67 | ||||
| 2025-08-07 | 13F | Boston Partners | 0 | −100,00 | 0 | |||||
| 2025-08-14 | 13F | Lighthouse Investment Partners, LLC | 259 677 | 784 | ||||||
| 2025-08-29 | NP | FRDM - Freedom 100 Emerging Markets ETF | 102 881 | 16,68 | 311 | 15,24 | ||||
| 2025-08-13 | 13F | West Family Investments, Inc. | 533 167 | 37,35 | 1 610 | 35,64 | ||||
| 2025-08-12 | 13F | MAI Capital Management | 67 948 | 205 | ||||||
| 2025-08-14 | 13F | Principal Street Partners, LLC | 41 134 | 186,89 | 124 | 188,37 | ||||
| 2025-08-13 | 13F | Panagora Asset Management Inc | 88 576 | 0,00 | 268 | −1,48 | ||||
| 2025-08-11 | 13F | Morling Financial Advisors, LLC | 0 | −100,00 | 0 | |||||
| 2025-07-14 | 13F | Abacus Wealth Partners, LLC | 34 703 | 5,21 | 105 | 4,00 | ||||
| 2025-07-14 | 13F | Cherrydale Wealth Management, Llc | 26 838 | −34,12 | 81 | −34,68 | ||||
| 2025-07-30 | 13F | Drive Wealth Management, Llc | 33 000 | −11,35 | 100 | −12,39 | ||||
| 2025-08-18 | 13F/A | National Bank Of Canada /fi/ | 4 317 | 13 | ||||||
| 2025-08-11 | 13F | NewEdge Wealth, LLC | 1 148 027 | 45,58 | 3 054 | 26,52 | ||||
| 2025-08-12 | 13F | Longfellow Investment Management Co Llc | 386 152 | 0,00 | 1 166 | −1,27 | ||||
| 2025-05-29 | NP | JAJBX - Emerging Markets Value Trust Series I | 86 551 | −75,88 | 265 | −79,21 | ||||
| 2025-08-01 | 13F | Bessemer Group Inc | 51 250 | 1,59 | 0 | |||||
| 2025-05-15 | 13F | Amplify Investments, Llc | 0 | −100,00 | 0 | −100,00 | ||||
| 2025-08-14 | 13F | Goldman Sachs Group Inc | 4 539 391 | −56,16 | 13 709 | −56,73 | ||||
| 2025-07-30 | 13F | Ethic Inc. | 1 036 451 | −1,37 | 3 151 | −2,02 | ||||
| 2025-07-29 | NP | RBB FUND, INC. - Aquarius International Fund | 250 530 | 17,69 | 722 | 3,59 | ||||
| 2025-08-08 | 13F | Candriam Luxembourg S.C.A. | 0 | −100,00 | 0 | |||||
| 2025-07-30 | 13F | Rehmann Capital Advisory Group | 13 175 | 40 | ||||||
| 2025-06-30 | NP | VEU - Vanguard FTSE All-World ex-US Index Fund ETF Shares | 3 090 356 | −1,17 | 8 838 | −22,99 | ||||
| 2025-08-12 | 13F | Virtu Financial LLC | 0 | −100,00 | 0 | |||||
| 2025-08-13 | 13F | Shelton Capital Management | 293 575 | −28,30 | 887 | −29,23 | ||||
| 2025-08-12 | 13F | AIMZ Investment Advisors, LLC | 293 646 | 0,00 | 887 | −1,34 | ||||
| 2025-08-13 | 13F | Quadrant Capital Group Llc | 1 221 439 | 60,75 | 3 689 | 58,62 | ||||
| 2025-08-11 | 13F | Principal Securities, Inc. | 683 | 79,74 | 2 | 100,00 | ||||
| 2025-06-26 | NP | DEXC - Dimensional Emerging Markets ex China Core Equity ETF | 31 462 | 22,35 | 90 | −5,32 | ||||
| 2025-07-31 | 13F | Resonant Capital Advisors, LLC | 32 705 | 99 | ||||||
| 2025-08-14 | 13F/A | Barclays Plc | 4 535 | −84,61 | 0 | |||||
| 2025-08-06 | 13F | Savant Capital, LLC | 0 | −100,00 | 0 | |||||
| 2025-08-14 | 13F | Smartleaf Asset Management LLC | 1 111 | −60,71 | 3 | −62,50 | ||||
| 2025-08-07 | 13F | Evoke Wealth, Llc | 10 883 | 33 | ||||||
| 2025-08-12 | 13F | Segall Bryant & Hamill, Llc | 202 200 | 0,00 | 611 | −1,29 | ||||
| 2025-08-28 | NP | JINTX - Johnson International Fund | 36 600 | 111 | ||||||
| 2025-08-13 | 13F | Victory Capital Management Inc | 396 805 | 0,00 | 1 198 | −1,32 | ||||
| 2025-07-25 | 13F | We Are One Seven, LLC | 23 206 | 16,64 | 70 | 16,67 | ||||
| 2025-06-27 | NP | HAOSX - Harbor Overseas Fund Institutional Class | 100 639 | 0,00 | 288 | −22,22 | ||||
| 2025-05-13 | 13F | Freestone Capital Holdings, LLC | 0 | −100,00 | 0 | |||||
| 2025-07-21 | 13F | Empirical Financial Services, LLC d.b.a. Empirical Wealth Management | 50 709 | 85,94 | 153 | 84,34 | ||||
| 2025-08-13 | 13F | Lido Advisors, LLC | 19 883 | 2,20 | 60 | 1,69 | ||||
| 2025-08-14 | 13F | Colony Group, LLC | 95 809 | 58,22 | 289 | 56,22 | ||||
| 2025-04-28 | NP | JEVNX - Emerging Markets Fund Class NAV | 271 691 | 144,93 | 888 | 14,58 | ||||
| 2025-08-27 | NP | THRIVENT SERIES FUND INC - Thrivent International Allocation Portfolio Class A | 40 069 | 0,00 | 121 | −0,82 | ||||
| 2025-08-14 | 13F | State Street Corp | 22 803 389 | 3,38 | 68 866 | 2,03 | ||||
| 2025-08-14 | 13F | Old Mission Capital Llc | 0 | −100,00 | 0 | −100,00 | ||||
| 2025-07-31 | 13F | Caitong International Asset Management Co., Ltd | 408 | 1 | ||||||
| 2025-08-14 | 13F | Aquatic Capital Management LLC | 954 746 | 41,32 | 2 883 | 39,48 | ||||
| 2025-08-14 | 13F | Qube Research & Technologies Ltd | 1 375 186 | 97,82 | 4 153 | 95,25 | ||||
| 2025-08-14 | 13F | Boston Private Wealth Llc | 19 831 | −74,45 | 60 | −75,11 | ||||
| 2025-08-14 | 13F | Two Sigma Advisers, Lp | 176 600 | 0,00 | 533 | −1,30 | ||||
| 2025-08-11 | 13F | Cladis Investment Advisory, LLC | 19 680 | 0,00 | 59 | −1,67 | ||||
| 2025-06-27 | NP | SUNAMERICA SERIES TRUST - SA JPMorgan Emerging Markets Portfolio Class 1 | 637 824 | 50,02 | 1 824 | 16,92 | ||||
| 2025-07-28 | 13F | Allianz Asset Management GmbH | 1 643 982 | −20,70 | 4 965 | −21,75 | ||||
| 2025-07-16 | 13F | Signaturefd, Llc | 569 477 | −0,55 | 1 720 | −1,88 | ||||
| 2025-08-13 | 13F | Rsm Us Wealth Management Llc | 19 468 | −22,41 | 59 | −23,68 | ||||
| 2025-06-26 | NP | DFAE - Dimensional Emerging Core Equity Market ETF | 210 127 | 42,27 | 601 | 10,70 | ||||
| 2025-07-31 | 13F | Buckingham Strategic Partners | 17 887 | 10,05 | 54 | 10,20 | ||||
| 2025-08-13 | 13F | Pinpoint Asset Management (Singapore) Pte. Ltd. | 238 148 | 719 | ||||||
| 2025-07-24 | 13F | Jfs Wealth Advisors, Llc | 1 978 | −16,82 | 6 | −28,57 | ||||
| 2025-08-12 | 13F | Dimensional Fund Advisors Lp | 2 035 558 | 2,99 | 6 147 | 1,64 | ||||
| 2025-07-24 | 13F | Us Bancorp \de\ | 937 293 | 17,09 | 2 831 | 15,56 | ||||
| 2025-08-12 | 13F | BlackRock, Inc. | 55 182 597 | −10,76 | 166 651 | −11,93 | ||||
| 2025-08-05 | 13F | NewSquare Capital LLC | 4 134 | 130,69 | 12 | 140,00 | ||||
| 2025-08-11 | 13F | TD Waterhouse Canada Inc. | 2 356 | 7 | ||||||
| 2025-08-11 | 13F | Pinnacle Wealth Planning Services, Inc. | 93 406 | −15,26 | 282 | −16,32 | ||||
| 2025-07-09 | 13F | Dynamic Advisor Solutions LLC | 30 587 | 3,97 | 92 | 2,22 | ||||
| 2025-08-13 | 13F | Avestar Capital, LLC | 11 463 | −11,65 | 35 | −12,82 | ||||
| 2025-08-14 | 13F | Man Group plc | 663 369 | −36,17 | 2 003 | −37,01 | ||||
| 2025-07-29 | 13F | Nordea Investment Management Ab | 1 295 941 | −0,62 | 3 933 | 0,05 | ||||
| 2025-08-14 | 13F | Point72 Asset Management, L.P. | 595 189 | 1 797 | ||||||
| 2025-08-14 | 13F | Millennium Management Llc | 16 922 437 | 137,87 | 51 106 | 134,76 | ||||
| 2025-07-23 | 13F | Klp Kapitalforvaltning As | 14 300 | 16,26 | 43 | 16,22 | ||||
| 2025-07-23 | NP | DBEM - Xtrackers MSCI Emerging Markets Hedged Equity ETF | 12 024 | 14,51 | 35 | 0,00 | ||||
| 2025-08-15 | 13F | CI Private Wealth, LLC | 1 101 406 | 101,86 | 3 326 | 99,28 | ||||
| 2025-08-12 | 13F | SRS Capital Advisors, Inc. | 12 245 | 297,31 | 37 | 300,00 | ||||
| 2025-05-08 | 13F | Waldron Private Wealth LLC | 0 | −100,00 | 0 | |||||
| 2025-08-12 | 13F | Clear Street Markets Llc | 13 820 | 42 | ||||||
| 2025-07-14 | 13F | Ridgewood Investments LLC | 7 114 | 0,00 | 21 | 0,00 | ||||
| 2025-08-13 | 13F | Schroder Investment Management Group | 7 932 834 | −7,42 | 23 957 | −7,73 | ||||
| 2025-08-25 | NP | EMSQX - Shelton Emerging Markets Fund Institutional Shares | 215 400 | −23,45 | 651 | −24,51 | ||||
| 2025-08-08 | 13F | Mitsubishi UFJ Trust & Banking Corp | 45 146 | 0,00 | 136 | −1,45 | ||||
| 2025-04-29 | 13F | Hm Payson & Co | 325 376 | 0,00 | 996 | −13,55 | ||||
| 2025-08-07 | 13F | Profund Advisors Llc | 66 219 | 15,23 | 200 | 13,71 | ||||
| 2025-07-15 | 13F | Public Employees Retirement System Of Ohio | 364 047 | −23,70 | 1 099 | −24,67 | ||||
| 2025-08-14 | 13F | Wetherby Asset Management Inc | 1 120 415 | 0,67 | 3 384 | −14,12 | ||||
| 2025-07-09 | 13F | Aaron Wealth Advisors LLC | 17 934 | 0,00 | 54 | 0,00 | ||||
| 2025-07-10 | 13F | Fulton Bank, N.a. | 0 | −100,00 | 0 | |||||
| 2025-08-01 | 13F | SYM FINANCIAL Corp | 23 850 | 13,13 | 72 | 12,50 | ||||
| 2025-07-28 | NP | AVSE - Avantis Responsible Emerging Markets Equity ETF | 18 324 | 13,24 | 53 | 0,00 | ||||
| 2025-08-11 | 13F | Banque Cantonale Vaudoise | 33 250 | −4,03 | 0 | |||||
| 2025-08-14 | 13F | RMB Capital Management, LLC | 10 297 | 31 | ||||||
| 2025-07-30 | NP | APIE - ActivePassive International Equity ETF | 248 243 | −34,75 | 715 | −42,60 | ||||
| 2025-08-11 | 13F | Brown Brothers Harriman & Co | 3 524 | 11 | ||||||
| 2025-07-30 | 13F | Cullen/frost Bankers, Inc. | 25 192 | 0,00 | 76 | −1,30 | ||||
| 2025-08-14 | 13F | Sei Investments Co | 195 048 | 73,61 | 589 | 71,72 | ||||
| 2025-08-12 | 13F | Putnam Fl Investment Management Co | 14 875 | 12,04 | 45 | 10,00 | ||||
| 2025-08-14 | 13F | Federation des caisses Desjardins du Quebec | 97 984 | 10,81 | 296 | 9,26 | ||||
| 2025-07-23 | 13F | Optas, LLC | 25 610 | −38,01 | 77 | −38,89 | ||||
| 2025-08-14 | 13F | Bnp Paribas Arbitrage, Sa | 9 965 693 | 17,25 | 30 096 | 15,72 | ||||
| 2025-08-11 | 13F | EntryPoint Capital, LLC | 55 987 | −3,71 | 169 | −4,52 | ||||
| 2025-08-14 | 13F | LMR Partners LLP | 1 417 767 | 174,67 | 4 282 | 171,12 | ||||
| 2025-07-31 | 13F | Sage Mountain Advisors LLC | 10 756 | −26,07 | 32 | −27,27 | ||||
| 2025-08-07 | 13F | Legacy Advisors, LLC | 0 | −100,00 | 0 | |||||
| 2025-08-14 | 13F | Citadel Advisors Llc | Call | 10 800 | 191,89 | 33 | 190,91 | |||
| 2025-08-14 | 13F | Citadel Advisors Llc | 3 874 129 | 602,25 | 11 700 | 593,07 | ||||
| 2025-06-30 | NP | VGTSX - Vanguard Total International Stock Index Fund Investor Shares | 11 574 656 | 0,00 | 33 104 | −22,07 | ||||
| 2025-04-17 | 13F | Vista Wealth Management Group, LLC | 19 084 | −14,89 | 58 | −26,58 | ||||
| 2025-08-14 | 13F | Schonfeld Strategic Advisors LLC | 107 445 | −61,19 | 324 | −61,75 | ||||
| 2025-08-11 | 13F | Johnson Financial Group, LLC | 0 | −100,00 | 0 | |||||
| 2025-08-01 | 13F | Oversea-Chinese Banking CORP Ltd | 95 930 | −21,69 | 290 | −22,73 | ||||
| 2025-08-12 | 13F | Proequities, Inc. | Put | 0 | 0 | |||||
| 2025-08-13 | 13F | Truvestments Capital Llc | 9 | 0 | ||||||
| 2025-08-12 | 13F | Proequities, Inc. | Call | 0 | 0 | |||||
| 2025-08-12 | 13F | Proequities, Inc. | 0 | 0 | ||||||
| 2025-08-11 | 13F | Dorsey & Whitney Trust CO LLC | 21 471 | 1,11 | 65 | 0,00 | ||||
| 2025-07-16 | 13F | Badgley Phelps Wealth Managers, LLC | 12 000 | 0,00 | 36 | 0,00 | ||||
| 2025-08-26 | NP | MASTER INVESTMENT PORTFOLIO - Active Stock Master Portfolio Active Stock Portfolio | 108 519 | −39,22 | 328 | −40,11 | ||||
| 2025-08-12 | 13F | O'shaughnessy Asset Management, Llc | 616 061 | −30,11 | 1 861 | −31,03 | ||||
| 2025-07-23 | 13F/A | Euro Pacific Asset Management, LLC | 24 025 | 1,63 | 0 | |||||
| 2025-05-02 | 13F | Cable Hill Partners, LLC | 73 683 | −16,30 | 211 | −32,48 | ||||
| 2025-08-13 | 13F | Invesco Ltd. | 748 175 | 40,70 | 2 259 | 38,84 | ||||
| 2025-08-14 | 13F | Aprio Wealth Management, LLC | 11 537 | −86,14 | 35 | −86,61 | ||||
| 2025-07-25 | 13F | Yousif Capital Management, Llc | 159 478 | 0,00 | 482 | −1,43 | ||||
| 2025-08-12 | 13F | Barings Llc | 32 833 | 19,38 | 99 | 17,86 | ||||
| 2025-08-14 | 13F | Group One Trading, L.p. | Call | 4 500 | −91,62 | 14 | −92,07 | |||
| 2025-08-14 | 13F | Glenmede Investment Management, LP | 69 300 | 209 | ||||||
| 2025-07-11 | 13F | Diversified Trust Co | 77 777 | −10,46 | 235 | −11,70 | ||||
| 2025-04-29 | 13F | BOCHK Asset Management Ltd | 0 | −100,00 | 0 | −100,00 | ||||
| 2025-07-14 | 13F | UMA Financial Services, Inc. | 2 939 | 68,81 | 9 | 60,00 | ||||
| 2025-07-31 | 13F | Oppenheimer & Co Inc | 21 000 | 0,00 | 63 | −1,56 | ||||
| 2025-08-04 | 13F | Flagship Harbor Advisors, Llc | 18 693 | 5,49 | 56 | 3,70 | ||||
| 2025-05-14 | 13F/A | Group One Trading, L.p. | 0 | −100,00 | 0 | −100,00 | ||||
| 2025-05-15 | 13F | Glenmede Trust Co Na | 66 571 | −13,24 | 204 | −25,09 | ||||
| 2025-08-13 | 13F | Quantbot Technologies LP | 449 449 | 40,53 | 1 357 | 38,75 | ||||
| 2025-08-04 | 13F | Migdal Insurance & Financial Holdings Ltd. | 0 | −100,00 | 0 | |||||
| 2025-06-26 | NP | Thrivent Core Funds - Thrivent Core Emerging Markets Equity Fund | 159 305 | −38,10 | 456 | −77,00 | ||||
| 2025-08-07 | 13F | Vise Technologies, Inc. | 27 547 | −48,53 | 83 | −56,08 | ||||
| 2025-06-26 | NP | DFAX - Dimensional World ex U.S. Core Equity 2 ETF | 54 604 | 0,00 | 156 | −22,00 | ||||
| 2025-08-14 | 13F | Fmr Llc | 317 862 | −34,08 | 960 | −34,98 | ||||
| 2025-07-17 | 13F | Greenleaf Trust | 75 084 | −58,59 | 227 | −59,21 | ||||
| 2025-08-19 | 13F | Asset Dedication, LLC | 0 | −100,00 | 0 | |||||
| 2025-08-06 | 13F | Atlas Legacy Advisors, LLC | 0 | −100,00 | 0 | |||||
| 2025-08-12 | 13F | LPL Financial LLC | 505 670 | 184,51 | 1 527 | 181,22 | ||||
| 2025-08-26 | NP | SBHEX - Segall Bryant & Hamill Emerging Markets Fund Retail Class | 53 800 | 0,00 | 162 | −1,22 | ||||
| 2025-06-27 | NP | SPWO - SP Funds S&P World (ex-US) ETF | 24 615 | 38,43 | 70 | 7,69 | ||||
| 2025-07-08 | 13F | Parallel Advisors, LLC | 217 517 | −19,20 | 657 | −20,29 | ||||
| 2025-07-17 | 13F | V-Square Quantitative Management LLC | 307 830 | 76,32 | 930 | 73,97 | ||||
| 2025-08-12 | 13F | Pathstone Holdings, LLC | 447 468 | 10,04 | 1 351 | 8,43 | ||||
| 2025-08-05 | 13F | Bridgewater Advisors Inc. | 181 567 | 5,66 | 508 | 3,04 | ||||
| 2025-07-09 | 13F | Sivia Capital Partners, LLC | 128 826 | −9,21 | 389 | −10,37 | ||||
| 2025-07-31 | 13F | CNB Bank | 575 | 2 | ||||||
| 2025-08-25 | NP | NXTG - First Trust Indxx NextG ETF This fund is a listed as child fund of First Trust Advisors Lp and if that institution has disclosed ownership in this security, then these positions will not be double counted when calculating total shares and total value | 1 545 153 | 27,27 | 4 666 | 25,63 | ||||
| 2025-07-30 | NP | EDOG - ALPS Emerging Sector Dividend Dogs ETF | 413 851 | 17,00 | 1 192 | 3,03 | ||||
| 2025-07-16 | 13F | Highline Wealth Partners Llc | 910 | −26,14 | 3 | −33,33 | ||||
| 2025-08-28 | NP | GMF - SPDR(R) S&P(R) EMERGING ASIA PACIFIC ETF | 323 579 | −6,51 | 977 | −7,74 | ||||
| 2025-08-28 | NP | SPGM - SPDR(R) Portfolio MSCI Global Stock Market ETF | 189 366 | 2,96 | 572 | 1,60 | ||||
| 2025-07-25 | 13F | JustInvest LLC | 1 202 675 | 11,30 | 3 634 | 9,89 | ||||
| 2025-08-05 | 13F | Westside Investment Management, Inc. | 9 218 | 28 | ||||||
| 2025-08-07 | 13F | HighPoint Advisor Group LLC | 13 941 | 14,99 | 42 | 23,53 | ||||
| 2025-08-11 | 13F | Alps Advisors Inc | 439 551 | 5,37 | 1 327 | 4,00 | ||||
| 2025-05-01 | 13F | Bleakley Financial Group, LLC | 0 | −100,00 | 0 | −100,00 | ||||
| 2025-08-12 | 13F | Global Retirement Partners, LLC | 10 514 | 110,62 | 32 | 82,35 | ||||
| 2025-07-25 | 13F | Allspring Global Investments Holdings, LLC | 34 812 | −87,30 | 107 | −87,35 | ||||
| 2025-08-29 | NP | SA FUNDS INVESTMENT TRUST - SA Emerging Markets Value Fund | 29 490 | 0,00 | 89 | −1,11 | ||||
| 2025-08-14 | 13F | Graham Capital Management, L.P. | 0 | −100,00 | 0 | |||||
| 2025-08-25 | NP | TDIV - First Trust NASDAQ Technology Dividend Index Fund This fund is a listed as child fund of First Trust Advisors Lp and if that institution has disclosed ownership in this security, then these positions will not be double counted when calculating total shares and total value | 328 471 | 27,64 | 992 | 25,92 | ||||
| 2025-08-25 | NP | SISLX - Shelton International Select Equity Fund Investor Class | 78 175 | −38,96 | 236 | −39,64 | ||||
| 2025-08-04 | 13F | GAM Holding AG | 0 | −100,00 | 0 | |||||
| 2025-08-14 | 13F | Royal Bank Of Canada | 983 981 | 717,05 | 2 972 | 705,42 | ||||
| 2025-08-12 | 13F | Summit Global Investments | 373 738 | 20,63 | 1 | |||||
| 2025-08-14 | 13F | GWM Advisors LLC | 384 408 | 42,00 | 1 161 | 40,10 | ||||
| 2025-08-14 | 13F | Newport Capital Group, LLC | 30 246 | 1,10 | 91 | 0,00 | ||||
| 2025-08-28 | NP | SPEM - SPDR(R) Portfolio Emerging Markets ETF | 5 785 545 | 8,80 | 17 472 | 7,38 | ||||
| 2025-08-15 | 13F | Kestra Advisory Services, LLC | 14 331 | 43 | ||||||
| 2025-07-29 | 13F | Werba Rubin Papier Wealth Management | 0 | −100,00 | 0 | −100,00 | ||||
| 2025-07-09 | 13F | Intelligence Driven Advisers, LLC | 26 273 | 44,04 | 79 | 43,64 | ||||
| 2025-08-11 | 13F | Citigroup Inc | 1 363 049 | 27,26 | 4 116 | 25,60 | ||||
| 2025-06-26 | NP | DFSE - Dimensional Emerging Markets Sustainability Core 1 ETF | 17 072 | 0,00 | 49 | −22,58 | ||||
| 2025-08-21 | NP | DGIN - VanEck Digital India ETF | 258 460 | −24,10 | 781 | −25,14 | ||||
| 2025-08-13 | 13F | Renaissance Technologies Llc | 2 577 200 | 85,22 | 7 783 | 82,83 | ||||
| 2025-07-11 | 13F | Farther Finance Advisors, LLC | 5 582 | −31,93 | 17 | −36,00 | ||||
| 2025-05-01 | 13F | Schechter Investment Advisors, LLC | 143 270 | −29,86 | 438 | −39,42 | ||||
| 2025-07-16 | 13F | Augustine Asset Management Inc | 59 809 | 0,00 | 181 | −1,64 | ||||
| 2025-04-22 | 13F | PFG Investments, LLC | 0 | −100,00 | 0 | |||||
| 2025-06-23 | NP | UUPIX - Ultraemerging Markets Profund Investor Class | 11 939 | 12,05 | 34 | −12,82 | ||||
| 2025-07-25 | 13F | Natural Investments, Llc | 42 464 | 21,30 | 0 | |||||
| 2025-08-04 | 13F | Assetmark, Inc | 1 062 | 11,09 | 3 | 50,00 | ||||
| 2025-07-14 | 13F | Foster Group, Inc. | 77 171 | −16,89 | 233 | −17,96 | ||||
| 2025-07-22 | 13F | Sava Infond d.o.o. | 320 000 | 0,00 | 966 | −1,33 | ||||
| 2025-07-11 | 13F | Perpetual Ltd | 1 146 200 | 39,73 | 3 462 | 37,89 | ||||
| 2025-08-04 | 13F | Mayflower Financial Advisors, LLC | 21 496 | −11,67 | 65 | −13,51 | ||||
| 2025-08-05 | 13F | Tiaa Trust, National Association | 17 712 | 0,00 | 53 | −1,85 | ||||
| 2025-08-14 | 13F | Modern Wealth Management, LLC | 111 558 | −44,23 | 337 | −45,10 | ||||
| 2025-07-08 | 13F | E. Ohman J:or Asset Management AB | 179 000 | 0,00 | 541 | −1,28 | ||||
| 2025-08-15 | 13F | Captrust Financial Advisors | 10 619 | −18,75 | 32 | −17,95 | ||||
| 2025-07-24 | 13F | Ronald Blue Trust, Inc. | 102 911 | −2,49 | 311 | −3,73 | ||||
| 2025-08-12 | 13F | Coldstream Capital Management Inc | 99 117 | 592,93 | 299 | 595,35 | ||||
| 2025-08-21 | NP | IEQ - Lazard International Dynamic Equity ETF | 43 942 | 133 | ||||||
| 2025-08-28 | NP | SSGVX - State Street Global Equity ex-U.S. Index Portfolio State Street Global All Cap Equity ex-U.S. Index Portfolio This fund is a listed as child fund of State Street Corp and if that institution has disclosed ownership in this security, then these positions will not be double counted when calculating total shares and total value | 38 108 | 0,00 | 115 | −0,86 | ||||
| 2025-06-30 | NP | VEIEX - Vanguard Emerging Markets Stock Index Fund Investor Shares | 6 545 438 | 0,00 | 18 720 | −22,07 | ||||
| 2025-08-26 | NP | Profunds - Profund Vp Emerging Markets | 48 255 | 8,38 | 146 | 6,62 | ||||
| 2025-07-21 | 13F | Ascent Group, LLC | 46 173 | −6,16 | 139 | −7,33 | ||||
| 2025-07-09 | 13F | Fragasso Group Inc. | 14 806 | 3,32 | 45 | 2,33 | ||||
| 2025-08-14 | 13F | Barometer Capital Management Inc. | 91 800 | −3,67 | 272 | −6,87 | ||||
| 2025-08-06 | 13F | Quadrant Private Wealth Management, LLC | 20 392 | 62 | ||||||
| 2025-05-22 | NP | RODE - Hartford Multifactor Diversified International ETF | 27 860 | 399,10 | 85 | 325,00 | ||||
| 2025-08-14 | 13F | Ariadne Wealth Management, LP | 41 231 | 115 | ||||||
| 2025-07-16 | 13F | Ascent Capital Management, LLC | 25 482 | 67,22 | 77 | 65,22 | ||||
| 2025-08-12 | 13F | Legal & General Group Plc | 121 521 | 14,55 | 368 | 12,92 | ||||
| 2025-07-14 | 13F | GAMMA Investing LLC | 44 969 | 110,76 | 136 | 107,69 | ||||
| 2025-07-30 | 13F | Eqis Capital Management, Inc. | 136 816 | −9,06 | 413 | −10,22 | ||||
| 2025-08-13 | 13F | Marshall Wace, Llp | 5 625 794 | −38,27 | 16 990 | −39,07 | ||||
| 2025-08-11 | 13F | HighTower Advisors, LLC | 58 166 | −3,94 | 176 | −5,41 | ||||
| 2025-08-01 | 13F | Envestnet Asset Management Inc | 10 290 | −21,26 | 31 | −20,51 | ||||
| 2025-07-23 | 13F | High Note Wealth, LLC | 0 | −100,00 | 0 | |||||
| 2025-07-24 | 13F | Lester Murray Antman dba SimplyRich | 303 074 | −6,92 | 1 | |||||
| 2025-08-14 | 13F | Aqr Capital Management Llc | 787 270 | −13,29 | 2 378 | −13,15 | ||||
| 2025-08-12 | 13F | Prudential Financial Inc | 740 200 | 8,92 | 4 974 | 8,94 | ||||
| 2025-08-14 | 13F | Cubist Systematic Strategies, LLC | 424 029 | −73,11 | 1 281 | −73,47 | ||||
| 2025-07-24 | 13F | Leo Wealth, LLC | 13 471 | 13,28 | 41 | 11,11 | ||||
| 2025-06-26 | NP | SNTKX - Steward International Enhanced Index Fund Class A | 168 148 | 0,00 | 481 | −22,20 | ||||
| 2025-07-24 | 13F | IFP Advisors, Inc | 1 178 | 0,00 | 4 | 0,00 | ||||
| 2025-05-28 | NP | IEAIX - Lazard International Equity Advantage Portfolio Institutional Shares | 81 007 | 248 | ||||||
| 2025-08-14 | 13F | Hamilton Capital, LLC | 0 | −100,00 | 0 | |||||
| 2025-08-14 | 13F | Lazard Asset Management Llc | 3 660 147 | −13,45 | 11 | −8,33 | ||||
| 2025-08-11 | 13F | United Capital Financial Advisers, Llc | 77 833 | −8,26 | 235 | −9,27 | ||||
| 2025-08-13 | 13F | Northwestern Mutual Wealth Management Co | 2 089 | 0,48 | 6 | 0,00 | ||||
| 2025-08-13 | 13F | Cerity Partners LLC | 896 714 | −7,63 | 2 708 | −8,82 | ||||
| 2025-08-14 | 13F/A | Skopos Labs, Inc. | 309 | −86,86 | 1 | −100,00 | ||||
| 2025-08-14 | 13F | Wells Fargo & Company/mn | 15 123 | −0,94 | 46 | −2,17 | ||||
| 2025-04-24 | NP | OAEM - OneAscent Emerging Markets ETF | 278 093 | 58,62 | 909 | −25,80 | ||||
| 2025-06-26 | NP | TWAAX - Thrivent International Allocation Fund Class A | 21 659 | −39,20 | 62 | −77,66 | ||||
| 2025-05-22 | NP | ROAM - Hartford Multifactor Emerging Markets ETF | 36 197 | 94,34 | 111 | 69,23 | ||||
| 2025-07-25 | 13F | Verdence Capital Advisors LLC | 44 596 | −29,02 | 135 | −30,21 | ||||
| 2025-08-14 | 13F | Caisse De Depot Et Placement Du Quebec | 0 | −100,00 | 0 | |||||
| 2025-07-25 | 13F | Clarendon Private LLC | 0 | −100,00 | 0 | |||||
| 2025-07-25 | NP | ACWV - iShares Edge MSCI Min Vol Global ETF | 441 708 | −3,38 | 1 272 | −14,86 | ||||
| 2025-08-07 | 13F | Acadian Asset Management Llc | 21 841 995 | 4,12 | 66 | 1,56 | ||||
| 2025-08-14 | 13F | Verition Fund Management LLC | 908 335 | 2 743 | ||||||
| 2025-07-08 | 13F | Northwest & Ethical Investments L.P. | 0 | −100,00 | 0 | −100,00 | ||||
| 2025-07-29 | 13F | Wealthstream Advisors, Inc. | 69 630 | 11,18 | 210 | 9,95 | ||||
| 2025-08-08 | 13F | Crossmark Global Holdings, Inc. | 201 705 | −0,15 | 609 | −1,46 | ||||
| 2025-08-13 | 13F | Jump Financial, LLC | 325 502 | 983 | ||||||
| 2025-08-22 | NP | QTUM - Defiance Quantum ETF | 6 446 407 | 42,49 | 19 468 | 40,63 | ||||
| 2025-07-22 | 13F | LGT Group Foundation | 91 090 | 0,00 | 275 | −1,08 | ||||
| 2025-05-15 | 13F | Angeles Investment Advisors, LLC | 0 | −100,00 | 0 | −100,00 | ||||
| 2025-04-11 | 13F | First Affirmative Financial Network | 29 385 | −9,25 | 90 | −21,93 | ||||
| 2025-08-05 | 13F | Bank of New York Mellon Corp | 43 546 | −38,56 | 132 | −39,35 | ||||
| 2025-08-11 | 13F | Bell Investment Advisors, Inc | 7 102 | −2,20 | 21 | −4,55 | ||||
| 2025-05-30 | NP | SEEM - SEI Select Emerging Markets Equity ETF | 112 500 | 344 | ||||||
| 2025-07-09 | 13F | Sunpointe, LLC | 11 248 | −14,88 | 34 | −17,50 |