Grundläggande statistik
| Institutionella ägare | 155 total, 155 long only, 0 short only, 0 long/short - change of −1,90% MRQ |
| Genomsnittlig portföljallokering | 0.0951 % - change of −10,66% MRQ |
| Institutionella aktier (lång) | 2 393 893 (ex 13D/G) - change of −0,05MM shares −2,01% MRQ |
| Institutionellt värde (lång) | $ 326 385 USD ($1000) |
Institutionellt ägande och aktieägare
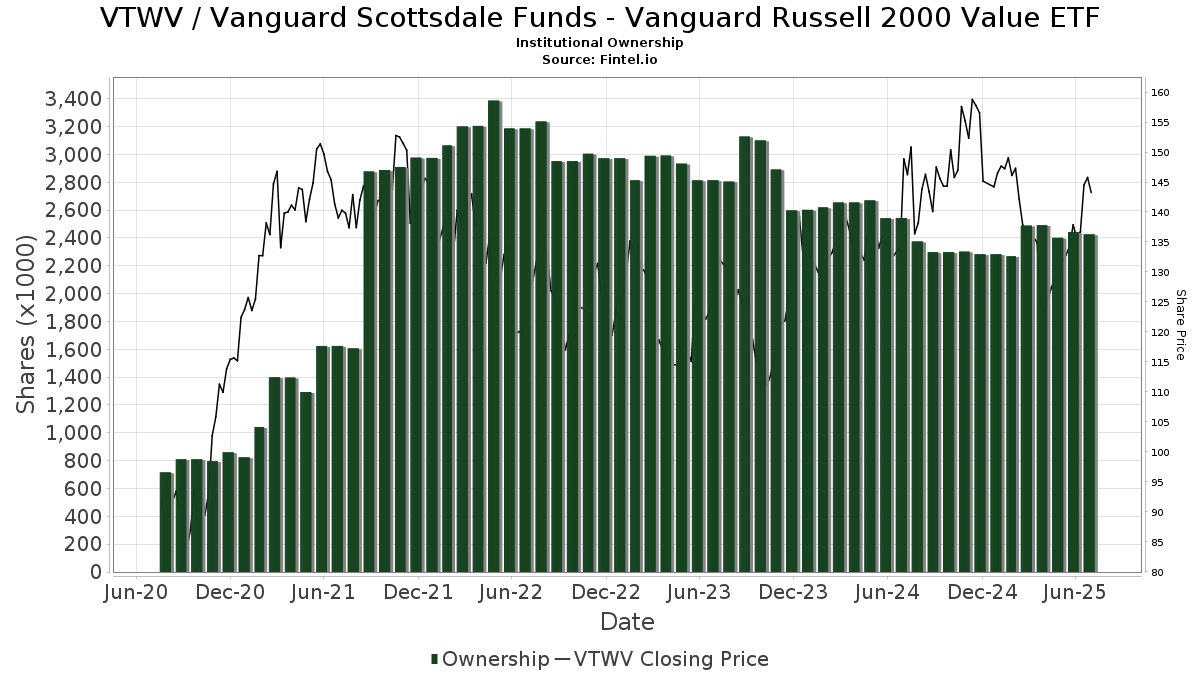
Vanguard Scottsdale Funds - Vanguard Russell 2000 Value ETF (US:VTWV) har 155 Institutionella ägare och aktieägare som har lämnat in 13D/G- eller 13F-formulär till Securities Exchange Commission (SEC). Dessa institut innehar totalt 2,393,893 aktier. Största aktieägare inkluderar Bank Of America Corp /de/, Pathstone Holdings, LLC, Morgan Stanley, LPL Financial LLC, Rockefeller Capital Management L.P., Bragg Financial Advisors, Inc, Ameriprise Financial Inc, Taddei, Ludwig & Associates, Inc., Congress Wealth Management LLC / DE /, and Financial Advisory Corp .
Vanguard Scottsdale Funds - Vanguard Russell 2000 Value ETF (NasdaqGM:VTWV) Institutionell ägarstruktur visar institutioners och fonders nuvarande positioner i företaget, samt de senaste förändringarna i positionernas storlek. Större aktieägare kan vara enskilda investerare, fonder, hedgefonder eller institutioner. Bilaga 13D visar att investeraren äger (eller ägde) mer än 5% av företaget och avser (eller avsåg) att aktivt eftersträva en förändring av affärsstrategin. Schedule 13G indikerar en passiv investering på över 5%.
The share price as of September 11, 2025 is 156,66 / share. Previously, on September 12, 2024, the share price was 141,82 / share. This represents an increase of 10,46% over that period.
Fondsentimentets poäng
Fondsentimentet poängen(fka Ägarackumulation-poäng) visar vilka aktier som är mest köpta av fonder. Det är resultatet av en sofistikerad kvantitativ flerfaktormodell som identifierar företag med de högsta nivåerna av institutionell ackumulering. Poängsättningsmodellen använder en kombination av den totala ökningen av redovisade ägare, förändringarna i portföljallokeringarna för dessa ägare och andra mått. Siffran sträcker sig från 0 till 100, där högre siffror indikerar en högre nivå av ackumulering i förhållande till sina konkurrenter, och 50 är genomsnittet.
Uppdateringsfrekvens: Dagligen
Se Ownership Explorer, som innehåller en lista över de högst rankade företagen.
Institutionell sälj/köp-kvot
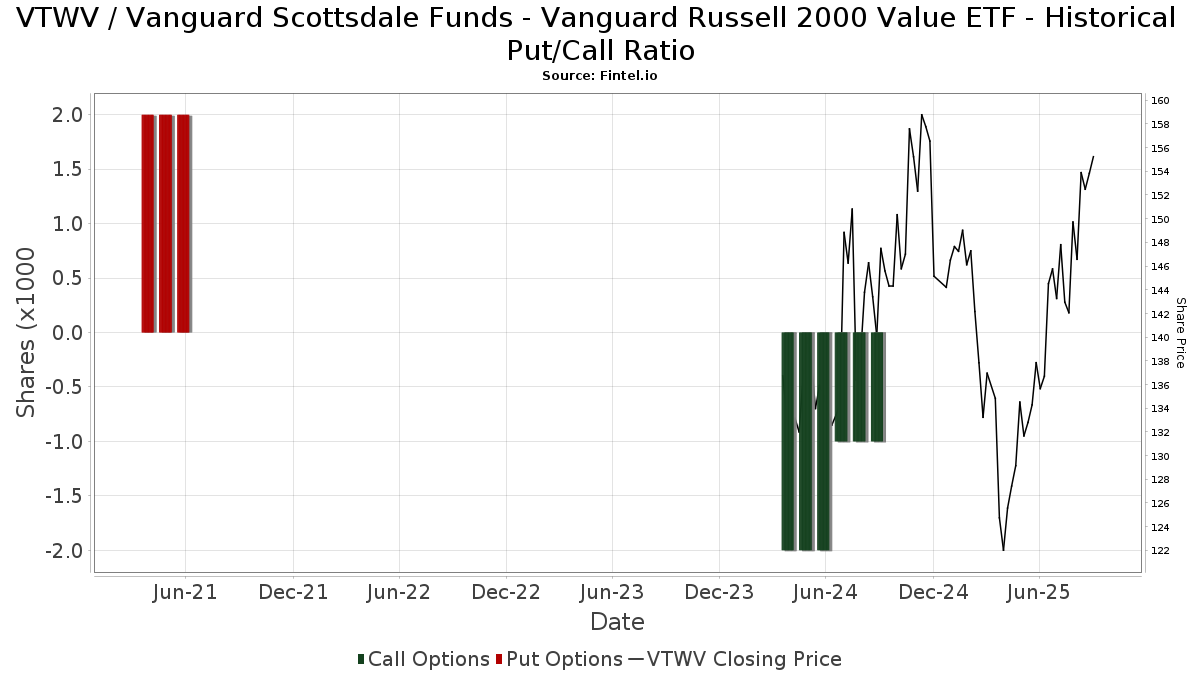
Förutom att rapportera vanliga eget kapital- och skuldemissioner måste institutioner med mer än 100MM tillgångar under förvaltning också avslöja sina innehav av sälj- och köpoptioner. Eftersom säljoptioner i allmänhet indikerar ett negativt sentiment och köpoptioner indikerar ett positivt sentiment, kan vi få en uppfattning om det övergripande institutionella sentimentet genom att plotta förhållandet mellan säljoptioner och köpoptioner. Diagrammet till höger visar det historiska förhållandet mellan sälj- och köpoptioner för detta instrument.
Genom att använda sälj/köp-kvoten som en indikator på aktieägarnas sentiment undviker man en av de största bristerna med att använda det totala institutionella ägandet, nämligen att en betydande del av de förvaltade tillgångarna investeras passivt för att följa index. Passivt förvaltade fonder köper vanligtvis inte optioner, så indikatorn för sälj/köp-kvoten ger en bättre bild av stämningen i aktivt förvaltade fonder.
13F- och NPORT-arkiveringar
Detaljer om 13F-arkiveringar är gratis. Detaljer om NP-arkiveringar kräver ett premiummedlemskap. Gröna rader indikerar nya positioner. Röda rader indikerar stängda positioner. Klicka på länk symbolen för att se hela transaktionshistoriken.
Uppgradera
för att låsa upp premiumdata och exportera till Excel ![]() .
.
| Fil Datum | Källa | Investerare | Typ | Genomsnittligt pris (beräknat) |
Aktier | Δ Aktier (%) |
Rapporterat värde (1000 USD) |
Δ Värde (%) |
Portföljallokering (%) |
|
|---|---|---|---|---|---|---|---|---|---|---|
| 2025-08-14 | 13F | Jane Street Group, Llc | 0 | −100,00 | 0 | |||||
| 2025-08-14 | 13F | Warren Averett Asset Management, LLC | 2 037 | 4,25 | 283 | 8,85 | ||||
| 2025-08-15 | 13F | Kestra Advisory Services, LLC | 35 611 | 2,18 | 4 953 | 6,79 | ||||
| 2025-07-10 | 13F | Brooklyn FI, LLC | 4 805 | 9,35 | 668 | −22,14 | ||||
| 2025-07-21 | 13F | Monticello Wealth Management, Llc | 3 946 | 4,50 | 549 | 9,16 | ||||
| 2025-07-23 | 13F | Bear Mountain Capital, Inc. | 126 | 0,00 | 18 | 12,50 | ||||
| 2025-07-31 | 13F | Buckingham Strategic Partners | 2 093 | 10,16 | 291 | 15,48 | ||||
| 2025-07-23 | 13F | Indiana Trust & Investment Management CO | 1 670 | 0,00 | 232 | 4,50 | ||||
| 2025-08-15 | 13F | Morgan Stanley | 150 323 | 13,75 | 20 909 | 18,88 | ||||
| 2025-08-05 | 13F | Carolinas Wealth Consulting Llc | 0 | −100,00 | 0 | −100,00 | ||||
| 2025-08-08 | 13F | Bailard, Inc. | 0 | −100,00 | 0 | |||||
| 2025-04-23 | 13F | Carl Stuart Investment Advisor, Inc | 0 | −100,00 | 0 | |||||
| 2025-08-14 | 13F | Raymond James Financial Inc | 39 461 | 44,76 | 5 489 | 51,27 | ||||
| 2025-08-07 | 13F | Kestra Private Wealth Services, Llc | 3 000 | −11,43 | 417 | −7,33 | ||||
| 2025-08-14 | 13F | Silvercrest Asset Management Group Llc | 27 104 | 22,00 | 3 770 | 27,50 | ||||
| 2025-05-06 | 13F | MCF Advisors LLC | 0 | −100,00 | 0 | |||||
| 2025-08-04 | 13F | Creative Financial Designs Inc /adv | 887 | 0,00 | 123 | 4,24 | ||||
| 2025-05-15 | 13F | Glenmede Trust Co Na | 138 | 0,00 | 18 | −5,26 | ||||
| 2025-04-21 | 13F | Johnson Investment Counsel Inc | 0 | −100,00 | 0 | |||||
| 2025-08-13 | 13F | Beacon Pointe Advisors, LLC | 2 409 | 0,00 | 335 | 4,69 | ||||
| 2025-08-14 | 13F | Bank Of America Corp /de/ | 386 721 | −10,82 | 53 789 | −6,80 | ||||
| 2025-08-13 | 13F | Congress Wealth Management LLC / DE / | 54 256 | 0,20 | 7 547 | 4,72 | ||||
| 2025-08-14 | 13F | Wells Fargo & Company/mn | 18 500 | −16,23 | 2 573 | −12,45 | ||||
| 2025-08-13 | 13F | Nyl Investors Llc | 7 971 | 1 109 | ||||||
| 2025-04-22 | 13F | Jmac Enterprises Llc | 0 | −100,00 | 0 | |||||
| 2025-09-04 | 13F/A | Advisor Group Holdings, Inc. | 2 654 | 22,76 | 369 | 28,13 | ||||
| 2025-08-08 | 13F/A | Sterling Capital Management LLC | 1 134 | 0,00 | 158 | 4,67 | ||||
| 2025-08-18 | 13F | Geneos Wealth Management Inc. | 40 | 100,00 | 6 | 150,00 | ||||
| 2025-07-22 | 13F | Wealthcare Advisory Partners LLC | 3 408 | −3,29 | 474 | 1,28 | ||||
| 2025-07-16 | 13F | Morangie Management LLC | 5 929 | 0,00 | 825 | 4,44 | ||||
| 2025-08-05 | 13F | Bank of New York Mellon Corp | 1 710 | 0,00 | 238 | 4,41 | ||||
| 2025-07-25 | 13F | Sequoia Financial Advisors, LLC | 0 | −100,00 | 0 | −100,00 | ||||
| 2025-08-05 | 13F | Bridgewater Advisors Inc. | 1 854 | −5,12 | 269 | 6,77 | ||||
| 2025-08-14 | 13F | Ancora Advisors, LLC | 40 | 0,00 | 6 | 0,00 | ||||
| 2025-08-06 | 13F | Eukles Asset Management | 115 | 0,00 | 16 | 0,00 | ||||
| 2025-08-12 | 13F | Proequities, Inc. | 0 | 0 | ||||||
| 2025-08-14 | 13F | Great Valley Advisor Group, Inc. | 6 551 | 2,78 | 911 | 7,31 | ||||
| 2025-07-25 | 13F | Atria Wealth Solutions, Inc. | 2 298 | 20,63 | 323 | 27,27 | ||||
| 2025-07-24 | 13F | Ronald Blue Trust, Inc. | 49 | 0,00 | 7 | 0,00 | ||||
| 2025-08-14 | 13F/A | Rockefeller Capital Management L.P. | 96 520 | 4,86 | 13 425 | 9,58 | ||||
| 2025-08-13 | 13F | Jones Financial Companies Lllp | 1 750 | 10,90 | 243 | 15,71 | ||||
| 2025-07-31 | 13F | Jordan Park Group LLC | 8 023 | −18,27 | 1 116 | −14,62 | ||||
| 2025-08-11 | 13F | HighTower Advisors, LLC | 20 180 | −0,81 | 2 807 | 3,66 | ||||
| 2025-08-14 | 13F | Wealth Preservation Advisors, LLC | 15 | 0,00 | 2 | 100,00 | ||||
| 2025-08-14 | 13F | GWM Advisors LLC | 3 227 | 0,00 | 449 | 4,43 | ||||
| 2025-07-03 | 13F | McLean Asset Management Corp | 4 297 | −31,35 | 621 | −14,60 | ||||
| 2025-08-14 | 13F | Financial Advisory Service, Inc. | 2 616 | 0,38 | 364 | 4,91 | ||||
| 2025-07-16 | 13F | Brown, Lisle/cummings, Inc. | 950 | 0,00 | 132 | 4,76 | ||||
| 2025-08-12 | 13F | Jpmorgan Chase & Co | 23 170 | −6,08 | 3 223 | −1,86 | ||||
| 2025-08-14 | 13F | Mercer Global Advisors Inc /adv | 2 398 | −8,09 | 334 | −4,03 | ||||
| 2025-08-12 | 13F | SRS Capital Advisors, Inc. | 254 | 35 | ||||||
| 2025-08-13 | 13F | Virtue Capital Management, LLC | 51 294 | −12,91 | 7 134 | −9,01 | ||||
| 2025-08-08 | 13F | Red Cedar Investment Management, Llc | 0 | −100,00 | 0 | |||||
| 2025-08-14 | 13F | Tennessee Valley Asset Management Partners | 3 098 | −10,15 | 431 | −6,11 | ||||
| 2025-07-30 | 13F | Eqis Capital Management, Inc. | 4 655 | 2,20 | 647 | 6,77 | ||||
| 2025-08-07 | 13F | Allworth Financial LP | 765 | 0,00 | 106 | 9,28 | ||||
| 2025-08-15 | 13F | Equitable Holdings, Inc. | 20 695 | 29,97 | 2 878 | 35,82 | ||||
| 2025-08-11 | 13F | TRUE Private Wealth Advisors | 1 933 | −4,31 | 269 | 0,00 | ||||
| 2025-08-13 | 13F | Allegheny Financial Group LTD | 15 116 | 6,80 | 2 103 | 11,63 | ||||
| 2025-08-13 | 13F | Lido Advisors, LLC | 5 189 | 232,63 | 722 | 248,31 | ||||
| 2025-08-14 | 13F | Ameriprise Financial Inc | 79 621 | −6,64 | 11 070 | −2,36 | ||||
| 2025-08-06 | 13F | Rialto Wealth Management, LLC | 3 011 | −0,59 | 419 | 3,72 | ||||
| 2025-08-14 | 13F | Susquehanna International Group, Llp | 4 377 | −81,81 | 609 | −81,01 | ||||
| 2025-04-21 | 13F | ORG Partners LLC | 0 | −100,00 | 0 | |||||
| 2025-08-14 | 13F | Ieq Capital, Llc | 3 156 | 0,00 | 439 | 4,29 | ||||
| 2025-07-22 | 13F | Miracle Mile Advisors, LLC | 4 707 | −1,09 | 655 | 3,32 | ||||
| 2025-07-17 | 13F | Michels Family Financial, LLC | 4 435 | −0,05 | 617 | 4,41 | ||||
| 2025-08-12 | 13F | Wealth Dimensions Group, Ltd. | 14 859 | 3,40 | 2 067 | 8,05 | ||||
| 2025-08-12 | 13F | Archer Investment Corp | 1 038 | 0,00 | 144 | 4,35 | ||||
| 2025-08-11 | 13F | Aptus Capital Advisors, LLC | 1 236 | 0,41 | 172 | 4,91 | ||||
| 2025-08-12 | 13F | MAI Capital Management | 100 | 0,00 | 14 | 0,00 | ||||
| 2025-08-08 | 13F | Cetera Investment Advisers | 36 596 | 1,21 | 5 090 | 5,78 | ||||
| 2025-04-23 | 13F | Nvest Financial, LLC | 0 | −100,00 | 0 | |||||
| 2025-07-28 | 13F | Harbour Investments, Inc. | 454 | 0,00 | 63 | 5,00 | ||||
| 2025-08-13 | 13F | Vance Wealth, Inc. | 2 510 | −16,42 | 349 | −12,53 | ||||
| 2025-07-07 | 13F | LBJ Family Wealth Advisors, Ltd. | 12 555 | 2,82 | 2 | 0,00 | ||||
| 2025-08-05 | 13F | Bank Of Montreal /can/ | 4 159 | −2,05 | 578 | 2,30 | ||||
| 2025-08-12 | 13F | FourThought Financial Partners, LLC | 8 104 | 1,05 | 1 127 | 5,62 | ||||
| 2025-08-14 | 13F | Atomi Financial Group, Inc. | 1 867 | 0,32 | 260 | 4,86 | ||||
| 2025-08-14 | 13F | Citadel Advisors Llc | 27 497 | 55,70 | 3 825 | 62,72 | ||||
| 2025-08-14 | 13F | Mariner, LLC | 5 088 | 41,53 | 708 | 47,91 | ||||
| 2025-07-29 | 13F | Private Trust Co Na | 191 | 0,00 | 27 | 4,00 | ||||
| 2025-08-11 | 13F | Anderson Financial Strategies, LLC | 0 | −100,00 | 0 | |||||
| 2025-04-22 | 13F | Synergy Financial Management, LLC | 0 | −100,00 | 0 | |||||
| 2025-07-22 | 13F | IVC Wealth Advisors LLC | 4 976 | −36,51 | 692 | −33,65 | ||||
| 2025-08-07 | 13F | Topel & Distasi Wealth Management, LLC | 0 | −100,00 | 0 | |||||
| 2025-08-08 | 13F | SBI Securities Co., Ltd. | 89 | 0,00 | 12 | 9,09 | ||||
| 2025-08-14 | 13F | Guardian Wealth Advisors, Llc / Nc | 1 136 | 0,44 | 158 | 4,67 | ||||
| 2025-08-08 | 13F | Phoenix Wealth Advisors | 14 819 | −12,96 | 2 061 | −9,01 | ||||
| 2025-07-29 | 13F | Rodgers & Associates, LTD | 16 717 | 0,42 | 2 325 | 4,97 | ||||
| 2025-08-13 | 13F | Portland Global Advisors LLC | 2 100 | 0,00 | 292 | 4,66 | ||||
| 2025-07-29 | 13F | Stordahl Capital Management, Inc. | 2 754 | 1,59 | 383 | 6,39 | ||||
| 2025-07-11 | 13F | Farther Finance Advisors, LLC | 437 | 1 050,00 | 61 | 1 100,00 | ||||
| 2025-08-12 | 13F | Investor's Fiduciary Advisor Network, LLC | 2 556 | 0,00 | 0 | |||||
| 2025-04-29 | 13F | Centered Wealth LLC dba Miller Equity Capital Advisors | 0 | −100,00 | 0 | |||||
| 2025-05-15 | 13F | Qube Research & Technologies Ltd | 0 | −100,00 | 0 | |||||
| 2025-08-12 | 13F | Global Retirement Partners, LLC | 367 | 0,82 | 51 | −1,92 | ||||
| 2025-08-08 | 13F | First Western Trust Bank | 1 738 | 0,00 | 242 | 4,33 | ||||
| 2025-08-12 | 13F | Fairscale Capital, LLC | 50 | 0,00 | 7 | 16,67 | ||||
| 2025-07-18 | 13F | Institute for Wealth Management, LLC. | 43 992 | 0,00 | 6 119 | 4,51 | ||||
| 2025-08-14 | 13F | Hrt Financial Lp | 0 | −100,00 | 0 | |||||
| 2025-08-14 | 13F | MidWestOne Financial Group, Inc. | 8 231 | 2,90 | 1 145 | 7,52 | ||||
| 2025-07-11 | 13F | Financial Advisory Corp | 52 804 | −1,82 | 7 345 | 2,61 | ||||
| 2025-08-04 | 13F | AMG National Trust Bank | 40 889 | 100,38 | 5 687 | 109,47 | ||||
| 2025-08-14 | 13F | Two Sigma Investments, Lp | 0 | −100,00 | 0 | |||||
| 2025-08-14 | 13F | Royal Bank Of Canada | 9 169 | −20,01 | 1 275 | −16,39 | ||||
| 2025-08-15 | 13F | Captrust Financial Advisors | 14 439 | 2 008 | ||||||
| 2025-07-22 | 13F | Iron Horse Wealth Management, LLC | 145 | 20 | ||||||
| 2025-08-14 | 13F | CoreFirst Bank & Trust | 99 | 14 | ||||||
| 2025-07-17 | 13F | Northwest Wealth Management, Llc | 1 959 | 10,37 | 272 | 15,25 | ||||
| 2025-08-14 | 13F | Comerica Bank | 1 494 | −0,53 | 208 | 4,02 | ||||
| 2025-08-05 | 13F | Centennial Bank/AR/ | 488 | −71,18 | 68 | −70,22 | ||||
| 2025-08-12 | 13F | AlphaCore Capital LLC | 111 | 0,00 | 15 | 7,14 | ||||
| 2025-08-14 | 13F | Fmr Llc | 1 511 | 73,28 | 210 | 81,03 | ||||
| 2025-07-18 | 13F | Truist Financial Corp | 2 966 | −21,82 | 413 | −18,25 | ||||
| 2025-08-25 | 13F/A | Neuberger Berman Group LLC | 5 918 | 0,08 | 823 | 4,71 | ||||
| 2025-08-06 | 13F | Adviser Investments LLC | 38 953 | 5,87 | 5 418 | 10,64 | ||||
| 2025-08-13 | 13F | Northwestern Mutual Wealth Management Co | 4 994 | 46,58 | 695 | 53,20 | ||||
| 2025-07-17 | 13F | Gleason Group, Inc. | 758 | 0,40 | 105 | 5,00 | ||||
| 2025-08-14 | 13F | Moneta Group Investment Advisors Llc | 3 779 | 0,19 | 526 | 4,58 | ||||
| 2025-08-06 | 13F | Savant Capital, LLC | 48 924 | −3,09 | 6 805 | 1,28 | ||||
| 2025-08-14 | 13F | CIBC World Markets Inc. | 17 312 | −7,23 | 2 408 | −3,06 | ||||
| 2025-08-08 | 13F | Comprehensive Financial Planning, Inc./PA | 80 | 0,00 | 11 | 10,00 | ||||
| 2025-08-19 | 13F | Asset Dedication, LLC | 53 | 7 | ||||||
| 2025-07-14 | 13F | Painted Porch Advisors LLC | 805 | 0,00 | 112 | 3,74 | ||||
| 2025-05-12 | 13F | Evernest Financial Advisors, LLC | 0 | −100,00 | 0 | |||||
| 2025-07-31 | 13F | Oppenheimer & Co Inc | 8 517 | 4,13 | 1 185 | 8,82 | ||||
| 2025-07-18 | 13F | Bartlett & Co. Wealth Management Llc | 17 355 | −8,92 | 2 414 | −4,85 | ||||
| 2025-08-12 | 13F | BlackRock, Inc. | 15 772 | 2 194 | ||||||
| 2025-07-25 | 13F | Cwm, Llc | 790 | 0,00 | 0 | |||||
| 2025-08-12 | 13F | LPL Financial LLC | 117 989 | 5,75 | 16 411 | 10,52 | ||||
| 2025-07-31 | 13F | Cambridge Investment Research Advisors, Inc. | 8 963 | 2,01 | 1 | 0,00 | ||||
| 2025-08-14 | 13F | Financial Engines Advisors L.L.C. | 10 215 | 1 421 | ||||||
| 2025-05-12 | 13F | Potentia Wealth | 0 | −100,00 | 0 | |||||
| 2025-08-05 | 13F | Simplex Trading, Llc | 0 | −100,00 | 0 | |||||
| 2025-08-12 | 13F | Vawter Financial, Ltd. | 0 | −100,00 | 0 | |||||
| 2025-08-11 | 13F | FSA Wealth Management LLC | 201 | 0,00 | 114 | 10,68 | ||||
| 2025-07-14 | 13F | Farmers & Merchants Investments Inc | 0 | −100,00 | 0 | |||||
| 2025-08-13 | 13F | Baird Financial Group, Inc. | 10 194 | −21,74 | 1 418 | −18,23 | ||||
| 2025-08-14 | 13F | McIlrath & Eck, LLC | 85 | −56,63 | 12 | −57,69 | ||||
| 2025-08-13 | 13F | Wrenne Financial Planning LLC | 6 034 | 839 | ||||||
| 2025-07-28 | 13F | Verisail Partners, LLC | 4 621 | 0,00 | 643 | 4,39 | ||||
| 2025-08-05 | 13F | Sigma Planning Corp | 6 255 | −5,87 | 870 | −1,70 | ||||
| 2025-08-15 | 13F | CI Private Wealth, LLC | 3 806 | 1,39 | 529 | 6,01 | ||||
| 2025-08-18 | 13F/A | National Bank Of Canada /fi/ | 605 | −2,42 | 84 | 1,22 | ||||
| 2025-07-10 | 13F | Wealth Enhancement Advisory Services, Llc | 4 656 | −7,66 | 678 | 0,89 | ||||
| 2025-08-07 | 13F | Commerce Bank | 15 705 | 0,32 | 2 184 | 4,85 | ||||
| 2025-05-15 | 13F | Oxford Financial Group Ltd | 0 | −100,00 | 0 | |||||
| 2025-08-13 | 13F | Tobias Financial Advisors, Inc. | 7 661 | 0,00 | 1 066 | 4,51 | ||||
| 2025-08-15 | 13F | Tower Research Capital LLC (TRC) | 4 318 | −64,63 | 601 | −63,05 | ||||
| 2025-07-24 | 13F | Eastern Bank | 96 | 0,00 | 13 | 8,33 | ||||
| 2025-07-08 | 13F | Nbc Securities, Inc. | 35 | 0,00 | 0 | |||||
| 2025-07-16 | 13F | Plancorp, LLC | 4 318 | 0,05 | 601 | 4,53 | ||||
| 2025-07-17 | 13F | Janney Montgomery Scott LLC | 3 816 | −1,55 | 1 | |||||
| 2025-04-23 | 13F | Perigon Wealth Management, LLC | 0 | −100,00 | 0 | |||||
| 2025-07-25 | 13F | Envestnet Portfolio Solutions, Inc. | 2 680 | −4,18 | 373 | 0,00 | ||||
| 2025-08-08 | 13F | Hartland & Co., LLC | 12 851 | 0,01 | 1 787 | 4,50 | ||||
| 2025-08-12 | 13F | Franklin Resources Inc | 25 182 | 0,60 | 3 503 | 5,13 | ||||
| 2025-08-07 | 13F | Parkside Financial Bank & Trust | 11 293 | 9,91 | 1 571 | 14,85 | ||||
| 2025-08-14 | 13F | Bragg Financial Advisors, Inc | 88 750 | 4,71 | 12 344 | 9,43 | ||||
| 2025-08-11 | 13F | Private Advisor Group, LLC | 4 710 | −17,50 | 655 | −13,70 | ||||
| 2025-08-12 | 13F | Cornerstone Wealth Management, LLC | 2 518 | −0,75 | 350 | 3,86 | ||||
| 2025-05-14 | 13F | Boston Private Wealth Llc | 0 | −100,00 | 0 | |||||
| 2025-07-17 | 13F | Fifth Third Securities, Inc. | 11 143 | 3,05 | 1 550 | 7,64 | ||||
| 2025-07-23 | 13F | Roundview Capital LLC | 6 079 | 0,00 | 846 | 4,45 | ||||
| 2025-05-02 | 13F | BluePointe Capital Management, LLC | 3 627 | 0,00 | 483 | −8,02 | ||||
| 2025-07-14 | 13F | AdvisorNet Financial, Inc | 3 479 | −81,43 | 484 | −80,63 | ||||
| 2025-08-14 | 13F | Goldman Sachs Group Inc | 22 664 | −15,25 | 3 152 | −11,44 | ||||
| 2025-08-01 | 13F | Envestnet Asset Management Inc | 12 065 | 13,63 | 1 678 | 18,75 | ||||
| 2025-08-14 | 13F | Stifel Financial Corp | 7 943 | 0,00 | 1 105 | 4,45 | ||||
| 2025-08-14 | 13F | UBS Group AG | 30 514 | 4,37 | 4 244 | 9,07 | ||||
| 2025-07-09 | 13F | Taddei, Ludwig & Associates, Inc. | 57 184 | 0,14 | 7 954 | 4,64 | ||||
| 2025-08-12 | 13F | Pathstone Holdings, LLC | 186 497 | 7,94 | 25 940 | 12,80 | ||||
| 2025-08-13 | 13F | Flow Traders U.s. Llc | 3 275 | −1,92 | 0 | |||||
| 2025-08-14 | 13F | Note Advisors, LLC | 2 505 | −38,42 | 348 | −35,67 | ||||
| 2025-08-08 | 13F | Pnc Financial Services Group, Inc. | 42 | 0,00 | 6 | 0,00 | ||||
| 2025-08-13 | 13F | Berkshire Asset Management Llc/pa | 18 513 | 0,39 | 2 575 | 6,23 | ||||
| 2025-07-23 | 13F | Country Club Bank /gfn | 2 740 | 0,00 | 381 | 4,11 | ||||
| 2025-08-14 | 13F | Banque Transatlantique SA | 0 | −100,00 | 0 | |||||
| 2025-08-06 | 13F | Commonwealth Equity Services, Llc | 12 849 | −0,09 | 2 | 0,00 | ||||
| 2025-08-14 | 13F | RMB Capital Management, LLC | 2 528 | 352 | ||||||
| 2025-08-14 | 13F | Mml Investors Services, Llc | 2 847 | 0,89 | 0 | |||||
| 2025-08-05 | 13F | Gibraltar Capital Management, Inc. | 11 250 | 0,00 | 1 565 | 4,48 |