Grundläggande statistik
| Institutionella ägare | 165 total, 165 long only, 0 short only, 0 long/short - change of 0,61% MRQ |
| Genomsnittlig portföljallokering | 0.1352 % - change of 2,58% MRQ |
| Institutionella aktier (lång) | 2 506 531 (ex 13D/G) - change of 0,04MM shares 1,78% MRQ |
| Institutionellt värde (lång) | $ 505 402 USD ($1000) |
Institutionellt ägande och aktieägare
Vanguard Scottsdale Funds - Vanguard Russell 2000 Growth ETF (US:VTWG) har 165 Institutionella ägare och aktieägare som har lämnat in 13D/G- eller 13F-formulär till Securities Exchange Commission (SEC). Dessa institut innehar totalt 2,506,531 aktier. Största aktieägare inkluderar Bank Of America Corp /de/, Pathstone Holdings, LLC, Westwood Holdings Group Inc, Assetmark, Inc, GPSTX - GuidePath(R) Growth Allocation Fund Service Shares, Morgan Stanley, LJI Wealth Management, LLC, Ameriprise Financial Inc, LPL Financial LLC, and Silvercrest Asset Management Group Llc .
Vanguard Scottsdale Funds - Vanguard Russell 2000 Growth ETF (NasdaqGM:VTWG) Institutionell ägarstruktur visar institutioners och fonders nuvarande positioner i företaget, samt de senaste förändringarna i positionernas storlek. Större aktieägare kan vara enskilda investerare, fonder, hedgefonder eller institutioner. Bilaga 13D visar att investeraren äger (eller ägde) mer än 5% av företaget och avser (eller avsåg) att aktivt eftersträva en förändring av affärsstrategin. Schedule 13G indikerar en passiv investering på över 5%.
The share price as of September 12, 2025 is 228,62 / share. Previously, on September 16, 2024, the share price was 202,00 / share. This represents an increase of 13,18% over that period.

Fondsentimentets poäng
Fondsentimentet poängen(fka Ägarackumulation-poäng) visar vilka aktier som är mest köpta av fonder. Det är resultatet av en sofistikerad kvantitativ flerfaktormodell som identifierar företag med de högsta nivåerna av institutionell ackumulering. Poängsättningsmodellen använder en kombination av den totala ökningen av redovisade ägare, förändringarna i portföljallokeringarna för dessa ägare och andra mått. Siffran sträcker sig från 0 till 100, där högre siffror indikerar en högre nivå av ackumulering i förhållande till sina konkurrenter, och 50 är genomsnittet.
Uppdateringsfrekvens: Dagligen
Se Ownership Explorer, som innehåller en lista över de högst rankade företagen.
Institutionell sälj/köp-kvot
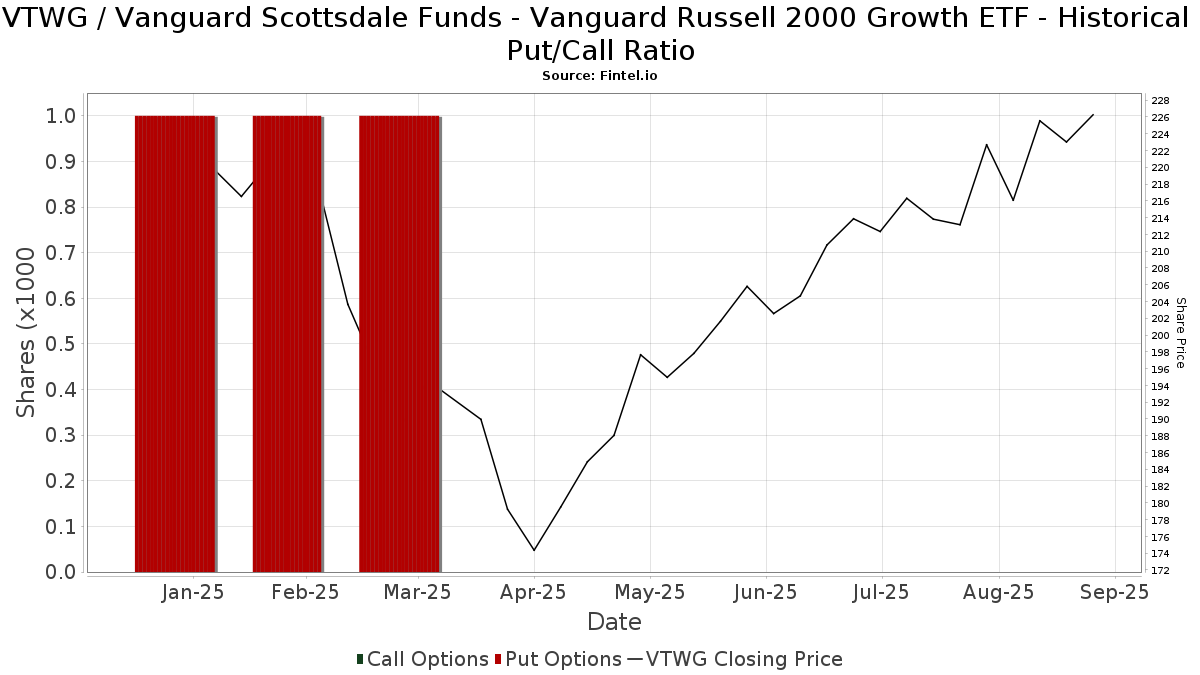
Förutom att rapportera vanliga eget kapital- och skuldemissioner måste institutioner med mer än 100MM tillgångar under förvaltning också avslöja sina innehav av sälj- och köpoptioner. Eftersom säljoptioner i allmänhet indikerar ett negativt sentiment och köpoptioner indikerar ett positivt sentiment, kan vi få en uppfattning om det övergripande institutionella sentimentet genom att plotta förhållandet mellan säljoptioner och köpoptioner. Diagrammet till höger visar det historiska förhållandet mellan sälj- och köpoptioner för detta instrument.
Genom att använda sälj/köp-kvoten som en indikator på aktieägarnas sentiment undviker man en av de största bristerna med att använda det totala institutionella ägandet, nämligen att en betydande del av de förvaltade tillgångarna investeras passivt för att följa index. Passivt förvaltade fonder köper vanligtvis inte optioner, så indikatorn för sälj/köp-kvoten ger en bättre bild av stämningen i aktivt förvaltade fonder.
13F- och NPORT-arkiveringar
Detaljer om 13F-arkiveringar är gratis. Detaljer om NP-arkiveringar kräver ett premiummedlemskap. Gröna rader indikerar nya positioner. Röda rader indikerar stängda positioner. Klicka på länk symbolen för att se hela transaktionshistoriken.
Uppgradera
för att låsa upp premiumdata och exportera till Excel ![]() .
.
| Fil Datum | Källa | Investerare | Typ | Genomsnittligt pris (beräknat) |
Aktier | Δ Aktier (%) |
Rapporterat värde (1000 USD) |
Δ Värde (%) |
Portföljallokering (%) |
|
|---|---|---|---|---|---|---|---|---|---|---|
| 2025-07-31 | 13F | City State Bank | 536 | 0,00 | 112 | 12,12 | ||||
| 2025-08-12 | 13F | Atlas Capital Advisors Llc | 497 | 0,00 | 104 | 11,96 | ||||
| 2025-07-14 | 13F | Pacifica Partners Inc. | 17 | 4 | ||||||
| 2025-07-31 | 13F | LJI Wealth Management, LLC | 71 948 | 20,03 | 14 999 | 34,26 | ||||
| 2025-08-14 | 13F | Horizon Investments, LLC | 192 | 2 300,00 | 40 | 3 900,00 | ||||
| 2025-08-15 | 13F | Kestra Advisory Services, LLC | 34 527 | 3,13 | 7 198 | 15,36 | ||||
| 2025-07-31 | 13F | Buckingham Strategic Partners | 1 397 | 291 | ||||||
| 2025-07-18 | 13F | Bridge Generations Wealth Management Llc | 4 | 0,00 | 1 | |||||
| 2025-08-08 | 13F | Pnc Financial Services Group, Inc. | 654 | 9,36 | 136 | 22,52 | ||||
| 2025-07-23 | 13F | Indiana Trust & Investment Management CO | 1 208 | 0,00 | 252 | 11,56 | ||||
| 2025-08-15 | 13F | Morgan Stanley | 123 166 | 39,27 | 25 677 | 55,80 | ||||
| 2025-08-14 | 13F | Raymond James Financial Inc | 41 359 | 20,12 | 8 622 | 34,38 | ||||
| 2025-08-06 | 13F | Grey Fox Wealth Advisors, LLC | 10 765 | 14,50 | 2 244 | 28,08 | ||||
| 2025-07-31 | 13F | Cornerstone Management, Inc. | 1 130 | 236 | ||||||
| 2025-08-13 | 13F | Congress Wealth Management LLC / DE / | 54 204 | −0,31 | 11 300 | 11,53 | ||||
| 2025-08-13 | 13F | Nyl Investors Llc | 5 311 | 1 107 | ||||||
| 2025-08-14 | 13F | Wells Fargo & Company/mn | 58 995 | 35,08 | 12 299 | 51,10 | ||||
| 2025-07-11 | 13F | Professional Advisory Services Inc | 1 675 | 0,00 | 0 | |||||
| 2025-08-18 | 13F/A | National Bank Of Canada /fi/ | 299 | 0,00 | 62 | 12,73 | ||||
| 2025-08-06 | 13F | Eukles Asset Management | 57 | 0,00 | 12 | 10,00 | ||||
| 2025-08-14 | 13F | GWM Advisors LLC | 4 466 | −4,69 | 931 | 6,64 | ||||
| 2025-08-13 | 13F | Jones Financial Companies Lllp | 933 | 50,24 | 194 | 67,24 | ||||
| 2025-05-19 | 13F/A | Jane Street Group, Llc | 0 | −100,00 | 0 | −100,00 | ||||
| 2025-07-15 | 13F | Mather Group, Llc. | 3 511 | −8,16 | 732 | 2,67 | ||||
| 2025-08-13 | 13F | Valued Retirements, Inc. | 1 374 | 0,07 | 287 | 12,16 | ||||
| 2025-08-12 | 13F | Change Path, LLC | 0 | −100,00 | 0 | |||||
| 2025-08-15 | 13F | Equitable Holdings, Inc. | 7 994 | −1,96 | 1 667 | 9,68 | ||||
| 2025-08-06 | 13F | Savant Capital, LLC | 10 518 | −4,44 | 2 193 | 6,87 | ||||
| 2025-08-13 | 13F | Allegheny Financial Group LTD | 15 713 | 3,65 | 3 276 | 15,93 | ||||
| 2025-08-07 | 13F | Allworth Financial LP | 1 278 | 118,84 | 266 | 148,60 | ||||
| 2025-08-01 | 13F | Belvedere Trading LLC | Put | 0 | −100,00 | 0 | ||||
| 2025-07-11 | 13F | Compass Ion Advisors, LLC | 0 | −100,00 | 0 | |||||
| 2025-08-13 | 13F | Lido Advisors, LLC | 1 245 | 0,16 | 260 | 12,12 | ||||
| 2025-08-13 | 13F | Kuhn & Co Investment Counsel | 1 690 | 0,00 | 352 | 12,10 | ||||
| 2025-08-11 | 13F | Mill Creek Capital Advisors, LLC | 2 399 | 0,00 | 500 | 12,11 | ||||
| 2025-08-14 | 13F | Ieq Capital, Llc | 2 453 | 0,00 | 511 | 11,82 | ||||
| 2025-08-06 | 13F | First Horizon Advisors, Inc. | 10 | 0,00 | 2 | 100,00 | ||||
| 2025-07-17 | 13F | Keystone Global Partners, LLC | 12 235 | −6,46 | 2 551 | 4,64 | ||||
| 2025-08-12 | 13F | FourThought Financial Partners, LLC | 4 564 | 1,78 | 951 | 13,89 | ||||
| 2025-07-07 | 13F | LBJ Family Wealth Advisors, Ltd. | 5 600 | 4,38 | 1 | 0,00 | ||||
| 2025-08-06 | 13F | Modera Wealth Management, LLC | 2 018 | 0,15 | 421 | 12,00 | ||||
| 2025-07-28 | 13F | Deroy & Devereaux Private Investment Counsel Inc | 9 718 | −5,83 | 2 | 100,00 | ||||
| 2025-08-05 | 13F | Carolinas Wealth Consulting Llc | 0 | −100,00 | 0 | −100,00 | ||||
| 2025-08-05 | 13F | Bank Of Montreal /can/ | 1 048 | 104 700,00 | 218 | |||||
| 2025-08-12 | 13F | Laurel Wealth Advisors LLC | 5 212 | 20 748,00 | 0 | −100,00 | ||||
| 2025-07-08 | 13F/A | Salem Investment Counselors Inc | 424 | 0,00 | 88 | 11,39 | ||||
| 2025-08-14 | 13F | Citadel Advisors Llc | 13 769 | 2 870 | ||||||
| 2025-08-14 | 13F | Mariner, LLC | 2 868 | 150,26 | 598 | 180,28 | ||||
| 2025-08-01 | 13F | American Financial & Tax Strategies Inc | 3 936 | −1,25 | 820 | 10,51 | ||||
| 2025-04-23 | 13F | Mascagni Wealth Management, Inc. | 0 | −100,00 | 0 | −100,00 | ||||
| 2025-07-31 | 13F | Oppenheimer Asset Management Inc. | 7 460 | 8,45 | 1 555 | 21,39 | ||||
| 2025-07-11 | 13F | Farther Finance Advisors, LLC | 571 | −8,05 | 119 | 3,48 | ||||
| 2025-07-15 | 13F | Td Private Client Wealth Llc | 178 | −41,83 | 37 | −35,09 | ||||
| 2025-08-11 | 13F | Anderson Financial Strategies, LLC | 0 | −100,00 | 0 | |||||
| 2025-07-22 | 13F | Powell Investment Advisors, LLC | 620 | 0,00 | 129 | 12,17 | ||||
| 2025-08-12 | 13F | SRS Capital Advisors, Inc. | 149 | 31 | ||||||
| 2025-07-18 | 13F | Institute for Wealth Management, LLC. | 33 832 | −0,47 | 7 053 | 11,34 | ||||
| 2025-05-13 | 13F | Steward Partners Investment Advisory, Llc | 0 | −100,00 | 0 | |||||
| 2025-08-14 | 13F | Royal Bank Of Canada | 17 439 | 6,96 | 3 635 | 19,61 | ||||
| 2025-08-15 | 13F | Captrust Financial Advisors | 5 570 | 142,70 | 1 161 | 171,90 | ||||
| 2025-07-07 | 13F | Horizons Wealth Management | 102 | 0,00 | 21 | 10,53 | ||||
| 2025-08-18 | 13F/A | Westwood Holdings Group Inc | 150 143 | −0,92 | 31 300 | 10,84 | ||||
| 2025-08-05 | 13F | Centennial Bank/AR/ | 788 | −46,03 | 164 | −39,71 | ||||
| 2025-07-09 | 13F | Riversedge Advisors, Llc | 23 506 | −3,41 | 4 900 | 8,05 | ||||
| 2025-08-14 | 13F | Bnp Paribas Arbitrage, Sa | 0 | −100,00 | 0 | |||||
| 2025-07-29 | 13F | Stratos Wealth Partners, LTD. | 5 415 | 0,00 | 1 129 | 11,79 | ||||
| 2025-08-01 | 13F | Belvedere Trading LLC | Call | 0 | −100,00 | 0 | ||||
| 2025-07-17 | 13F | Vermillion Wealth Management, Inc. | 10 408 | 14,58 | 2 170 | 28,19 | ||||
| 2025-08-14 | 13F | CIBC World Markets Inc. | 0 | −100,00 | 0 | |||||
| 2025-08-13 | 13F | Northwestern Mutual Wealth Management Co | 2 806 | 27,31 | 585 | 42,44 | ||||
| 2025-08-05 | 13F | Prosperity Consulting Group, LLC | 5 204 | 52,30 | 1 085 | 70,44 | ||||
| 2025-08-14 | 13F | Moneta Group Investment Advisors Llc | 3 443 | 0,03 | 718 | 11,86 | ||||
| 2025-08-06 | 13F | Adviser Investments LLC | 18 040 | 14,25 | 3 761 | 27,80 | ||||
| 2025-07-31 | 13F | Oppenheimer & Co Inc | 6 179 | 4,57 | 1 288 | 16,98 | ||||
| 2025-07-25 | 13F | Cwm, Llc | 35 635 | −9,15 | 7 | 0,00 | ||||
| 2025-08-14 | 13F | Financial Engines Advisors L.L.C. | 3 671 | 765 | ||||||
| 2025-07-25 | 13F | Concord Wealth Partners | 14 | −17,65 | 3 | −33,33 | ||||
| 2025-07-10 | 13F | Wealth Enhancement Advisory Services, Llc | 1 583 | −14,94 | 338 | −2,60 | ||||
| 2025-07-08 | 13F | Nbc Securities, Inc. | 150 | 0,00 | 0 | |||||
| 2025-08-04 | 13F | Assetmark, Inc | 132 373 | 4,18 | 27 596 | 16,54 | ||||
| 2025-08-14 | 13F | Goldman Sachs Group Inc | 7 733 | −14,19 | 1 612 | −3,99 | ||||
| 2025-07-31 | 13F | Cambridge Investment Research Advisors, Inc. | 0 | −100,00 | 0 | |||||
| 2025-07-17 | 13F | Janney Montgomery Scott LLC | 6 054 | −1,40 | 1 | 0,00 | ||||
| 2025-08-06 | 13F | Golden State Wealth Management, LLC | 24 | 0,00 | 5 | 25,00 | ||||
| 2025-08-07 | 13F | Parkside Financial Bank & Trust | 10 625 | 12,43 | 2 215 | 25,78 | ||||
| 2025-07-24 | 13F | IFP Advisors, Inc | 528 | 7,98 | 110 | 20,88 | ||||
| 2025-07-25 | 13F | Envestnet Portfolio Solutions, Inc. | 2 230 | −6,30 | 465 | 4,74 | ||||
| 2025-08-01 | 13F | Envestnet Asset Management Inc | 39 381 | 9,28 | 8 210 | 22,25 | ||||
| 2025-07-14 | 13F | AdvisorNet Financial, Inc | 1 930 | −83,65 | 402 | −81,73 | ||||
| 2025-08-08 | 13F | Hartland & Co., LLC | 9 984 | 0,00 | 2 081 | 11,88 | ||||
| 2025-08-01 | 13F | Zhang Financial LLC | 0 | −100,00 | 0 | |||||
| 2025-07-17 | 13F | Independence Bank of Kentucky | 0 | −100,00 | 0 | |||||
| 2025-07-23 | 13F | Country Club Bank /gfn | 3 830 | 14,84 | 797 | 26,95 | ||||
| 2025-08-12 | 13F | Pathstone Holdings, LLC | 182 956 | 6,04 | 38 141 | 18,62 | ||||
| 2025-08-06 | 13F | Commonwealth Equity Services, Llc | 7 701 | −25,79 | 2 | 0,00 | ||||
| 2025-08-14 | 13F | Mml Investors Services, Llc | 8 374 | 5,95 | 2 | 0,00 | ||||
| 2025-08-05 | 13F | Mission Wealth Management, Lp | 6 180 | 1 288 | ||||||
| 2025-08-14 | 13F | RMB Capital Management, LLC | 2 921 | 609 | ||||||
| 2025-05-14 | 13F | Caitlin John, LLC | 0 | −100,00 | 0 | |||||
| 2025-08-12 | 13F | Centric Wealth Management | 17 968 | 3 822 | ||||||
| 2025-08-28 | NP | GPSTX - GuidePath(R) Growth Allocation Fund Service Shares | 131 410 | 7,28 | 27 395 | 20,01 | ||||
| 2025-07-10 | 13F | High Net Worth Advisory Group LLC | 1 250 | 261 | ||||||
| 2025-07-21 | 13F | Monticello Wealth Management, Llc | 3 426 | 0,74 | 714 | 12,80 | ||||
| 2025-04-21 | 13F | Nelson, Van Denburg & Campbell Wealth Management Group, LLC | 0 | −100,00 | 0 | |||||
| 2025-08-14 | 13F | Silvercrest Asset Management Group Llc | 62 765 | 0,15 | 13 085 | 12,03 | ||||
| 2025-08-04 | 13F | Creative Financial Designs Inc /adv | 115 | 0,00 | 24 | 9,52 | ||||
| 2025-05-20 | 13F/A | Colony Group, LLC | 0 | −100,00 | 0 | −100,00 | ||||
| 2025-08-19 | 13F | Cape Investment Advisory, Inc. | 19 | −83,48 | 4 | −85,71 | ||||
| 2025-08-14 | 13F | Bank Of America Corp /de/ | 288 254 | −5,67 | 60 092 | 5,52 | ||||
| 2025-08-14 | 13F | Graney & King, LLC | 776 | 0,00 | 162 | 11,81 | ||||
| 2025-08-14 | 13F | Gotham Asset Management, LLC | 3 000 | 100,00 | 625 | 124,01 | ||||
| 2025-04-21 | 13F | ORG Partners LLC | 0 | −100,00 | 0 | |||||
| 2025-08-06 | 13F | AE Wealth Management LLC | 143 | 0,00 | 30 | 11,54 | ||||
| 2025-08-08 | 13F/A | Sterling Capital Management LLC | 207 | 0,00 | 43 | 13,16 | ||||
| 2025-05-13 | 13F | Cresset Asset Management, LLC | 0 | −100,00 | 0 | |||||
| 2025-07-16 | 13F | Embree Financial Group | 1 538 | 0,00 | 321 | 11,89 | ||||
| 2025-08-05 | 13F | Bank of New York Mellon Corp | 1 442 | 0,00 | 301 | 11,94 | ||||
| 2025-07-31 | 13F | Waldron Private Wealth LLC | 1 426 | −48,83 | 297 | −42,77 | ||||
| 2025-08-12 | 13F | Proequities, Inc. | 0 | 0 | ||||||
| 2025-08-14 | 13F | Great Valley Advisor Group, Inc. | 8 415 | 1,78 | 1 754 | 13,90 | ||||
| 2025-09-04 | 13F/A | Advisor Group Holdings, Inc. | 56 954 | 0,76 | 11 880 | 12,70 | ||||
| 2025-08-11 | 13F | HighTower Advisors, LLC | 30 036 | −1,38 | 6 262 | 10,33 | ||||
| 2025-08-13 | 13F | Brown Advisory Inc | 12 833 | 0,00 | 2 675 | 11,88 | ||||
| 2025-08-12 | 13F | Jpmorgan Chase & Co | 11 150 | −2,37 | 2 324 | 9,21 | ||||
| 2025-08-13 | 13F | Virtue Capital Management, LLC | 39 619 | −12,75 | 8 259 | −2,61 | ||||
| 2025-07-30 | 13F | Eqis Capital Management, Inc. | 2 671 | −3,12 | 557 | 8,38 | ||||
| 2025-08-14 | 13F | Susquehanna International Group, Llp | 18 129 | −65,77 | 3 779 | −61,70 | ||||
| 2025-08-08 | 13F | Emerald Investment Partners, Llc | 74 | 0,00 | 16 | 15,38 | ||||
| 2025-07-17 | 13F | Michels Family Financial, LLC | 2 895 | −0,28 | 604 | 11,46 | ||||
| 2025-07-25 | 13F | Concurrent Investment Advisors, LLC | 11 939 | 7,49 | 2 489 | 20,25 | ||||
| 2025-08-14 | 13F | Ameriprise Financial Inc | 66 843 | 6,66 | 13 933 | 19,47 | ||||
| 2025-07-25 | 13F | Tranquility Partners, LLC | 1 003 | 209 | ||||||
| 2025-07-08 | 13F | FF Advisors,LLC | 2 065 | 0,00 | 430 | 10,82 | ||||
| 2025-07-22 | 13F | Sutton Place Investors Llc | 1 300 | 0,00 | 271 | 11,98 | ||||
| 2025-08-11 | 13F | Aptus Capital Advisors, LLC | 824 | 0,12 | 172 | 11,76 | ||||
| 2025-08-12 | 13F | MAI Capital Management | 676 | −8,03 | 141 | 2,94 | ||||
| 2025-08-14 | 13F | First Citizens Asset Management, Inc. | 0 | −100,00 | 0 | |||||
| 2025-08-08 | 13F | Cetera Investment Advisers | 23 439 | 3,25 | 4 886 | 15,51 | ||||
| 2025-08-12 | 13F | Gladstone Institutional Advisory LLC | 7 628 | 6,05 | 1 590 | 18,66 | ||||
| 2025-08-04 | 13F | Arkadios Wealth Advisors | 1 654 | 345 | ||||||
| 2025-08-13 | 13F | Vance Wealth, Inc. | 4 434 | 69,89 | 924 | 90,12 | ||||
| 2025-08-14 | 13F | Sunbelt Securities, Inc. | 300 | 0,00 | 63 | 14,55 | ||||
| 2025-08-08 | 13F | Avantax Advisory Services, Inc. | 15 769 | 1,12 | 3 287 | 13,11 | ||||
| 2025-08-14 | 13F | Qube Research & Technologies Ltd | 0 | −100,00 | 0 | |||||
| 2025-08-08 | 13F | SBI Securities Co., Ltd. | 159 | −8,09 | 33 | 3,13 | ||||
| 2025-05-14 | 13F | Absolute Capital Management, LLC | 0 | −100,00 | 0 | |||||
| 2025-08-14 | 13F | Mercer Global Advisors Inc /adv | 3 085 | 0,26 | 646 | 17,88 | ||||
| 2025-07-22 | 13F | IVC Wealth Advisors LLC | 15 736 | −5,02 | 3 281 | 6,25 | ||||
| 2025-08-14 | 13F | Guardian Wealth Advisors, Llc / Nc | 824 | 0,12 | 172 | 11,76 | ||||
| 2025-07-29 | 13F | Rodgers & Associates, LTD | 1 142 | 238 | ||||||
| 2025-08-11 | 13F | Principal Securities, Inc. | 180 | 0,00 | 38 | 0,00 | ||||
| 2025-08-04 | 13F | Pinnacle Associates Ltd | 1 558 | 0,00 | 325 | 11,72 | ||||
| 2025-08-14 | 13F | MidWestOne Financial Group, Inc. | 5 073 | 11,23 | 1 058 | 24,50 | ||||
| 2025-08-11 | 13F | TD Waterhouse Canada Inc. | 23 706 | −0,20 | 4 936 | 11,45 | ||||
| 2025-08-04 | 13F | AMG National Trust Bank | 17 126 | 59,13 | 3 570 | 78,05 | ||||
| 2025-08-14 | 13F | Fmr Llc | 963 | −29,55 | 201 | −21,26 | ||||
| 2025-05-05 | 13F | Transce3nd, LLC | 0 | −100,00 | 0 | |||||
| 2025-08-08 | 13F | Creative Planning | 13 875 | 35,34 | 2 893 | 51,41 | ||||
| 2025-08-14 | 13F | Comerica Bank | 1 503 | −67,17 | 313 | −63,31 | ||||
| 2025-04-23 | 13F | Perigon Wealth Management, LLC | 0 | −100,00 | 0 | |||||
| 2025-07-18 | 13F | Truist Financial Corp | 18 999 | 14,21 | 3 961 | 27,74 | ||||
| 2025-08-13 | 13F | Quadrature Capital Ltd | 2 030 | 424 | ||||||
| 2025-07-16 | 13F | Signaturefd, Llc | 277 | −18,05 | 58 | −8,06 | ||||
| 2025-09-12 | 13F/A | Valeo Financial Advisors, LLC | 1 115 | 0,00 | 232 | 12,08 | ||||
| 2025-07-24 | 13F | Us Bancorp \de\ | 200 | 0,00 | 42 | 10,81 | ||||
| 2025-08-11 | 13F | FSA Wealth Management LLC | 63 | 0,00 | 9 | 0,00 | ||||
| 2025-07-29 | 13F | Chicago Partners Investment Group LLC | 2 989 | 0,17 | 646 | 15,15 | ||||
| 2025-08-14 | 13F | Hrt Financial Lp | 1 827 | 53,79 | 0 | |||||
| 2025-08-12 | 13F | LPL Financial LLC | 64 555 | −3,52 | 13 458 | 7,92 | ||||
| 2025-08-12 | 13F | Global Retirement Partners, LLC | 885 | 0,00 | 185 | −0,54 | ||||
| 2025-08-14 | 13F/A | Rockefeller Capital Management L.P. | 42 126 | 4,14 | 8 782 | 16,50 | ||||
| 2025-07-09 | 13F | Taddei, Ludwig & Associates, Inc. | 39 883 | 0,21 | 8 314 | 12,11 | ||||
| 2025-08-01 | 13F | Chilton Capital Management Llc | 0 | −100,00 | 0 | |||||
| 2025-08-07 | 13F | Commerce Bank | 14 253 | 0,66 | 2 971 | 12,62 | ||||
| 2025-08-15 | 13F | Tower Research Capital LLC (TRC) | 4 083 | −54,65 | 851 | −49,25 | ||||
| 2025-08-05 | 13F | Sigma Planning Corp | 1 015 | 212 | ||||||
| 2025-05-08 | 13F | Harbour Investments, Inc. | 0 | −100,00 | 0 | |||||
| 2025-08-15 | 13F | CI Private Wealth, LLC | 1 019 | 212 | ||||||
| 2025-08-07 | 13F | Americana Partners, LLC | 1 132 | 0,00 | 236 | 11,90 | ||||
| 2025-08-11 | 13F | Private Advisor Group, LLC | 4 297 | −2,21 | 896 | 9,41 | ||||
| 2025-08-14 | 13F | Bragg Financial Advisors, Inc | 9 426 | 3,39 | 1 965 | 15,66 | ||||
| 2025-07-21 | 13F | Barrett & Company, Inc. | 482 | 0,00 | 100 | 12,36 | ||||
| 2025-08-12 | 13F | Cornerstone Wealth Management, LLC | 1 609 | 1,39 | 335 | 13,56 | ||||
| 2025-08-14 | 13F | Hirtle Callaghan & Co LLC | 1 754 | −19,95 | 366 | −10,54 | ||||
| 2025-08-14 | 13F | Stifel Financial Corp | 15 705 | 1,88 | 3 274 | 14,00 | ||||
| 2025-07-17 | 13F | Fifth Third Securities, Inc. | 17 030 | 7,34 | 3 550 | 20,09 | ||||
| 2025-08-05 | 13F | Roffman Miller Associates Inc /pa/ | 2 157 | 0,19 | 450 | 11,97 | ||||
| 2025-08-14 | 13F | UBS Group AG | 41 908 | −28,92 | 8 737 | −20,49 | ||||
| 2025-07-18 | 13F | SOA Wealth Advisors, LLC. | 112 | 0,00 | 23 | 15,00 | ||||
| 2025-07-24 | 13F | Blair William & Co/il | 135 | 0,00 | 28 | 12,00 | ||||
| 2025-07-17 | 13F | Sound Income Strategies, LLC | 13 251 | 191,55 | 2 763 | 226,48 | ||||
| 2025-04-18 | 13F | Wolf Group Capital Advisors | 4 248 | −8,76 | 792 | −3,65 | ||||
| 2025-05-08 | 13F | Wrapmanager Inc | 0 | −100,00 | 0 |