Grundläggande statistik
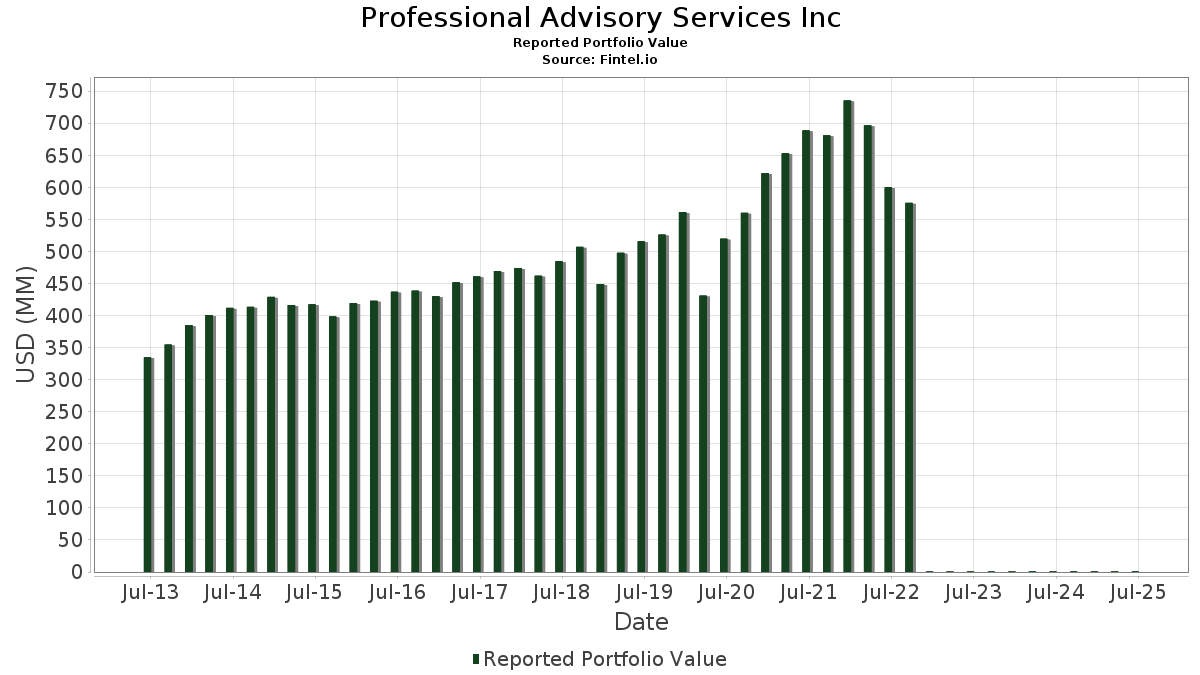
| Portföljvärde | $ 737 125 |
| Aktuella positioner | 83 |
Senaste innehav, resultat, förvaltat kapital (från 13F, 13D)
Professional Advisory Services Inc har redovisat 83 totala innehav i sina senaste SEC-arkiveringar. Det senaste portföljvärdet beräknas vara $ 737 125 USD. Faktiskt förvaltade tillgångar (AUM) är detta värde plus likvida medel (som inte redovisas). Professional Advisory Services Incs största innehav är Microsoft Corporation (US:MSFT) , Amazon.com, Inc. (US:AMZN) , Alphabet Inc. (US:GOOGL) , Elevance Health, Inc. (US:ELV) , and Expro Group Holdings N.V. (US:XPRO) . Professional Advisory Services Incs nya positioner inkluderar Danaher Corporation (US:DHR) , .
Största ökningarna detta kvartal
Vi använder förändringen i portföljallokeringen eftersom det är det mest meningsfulla måttet. Förändringar kan bero på transaktioner eller förändringar i aktiekurser.
| Värdepapper | Aktier (MM) |
Värde (MM$) |
Portfölj % av | ΔPortfölj % av |
|---|---|---|---|---|
| 0,12 | 0,03 | 3,5792 | 3,4650 | |
| 0,05 | 0,01 | 1,2276 | 1,2276 | |
| 0,14 | 0,02 | 2,6181 | 0,6013 | |
| 0,14 | 0,03 | 4,3137 | 0,3864 | |
| 0,08 | 0,04 | 5,3249 | 0,3724 | |
| 0,18 | 0,03 | 4,3073 | 0,2675 | |
| 0,35 | 0,02 | 3,0202 | 0,2383 | |
| 0,09 | 0,01 | 1,1458 | 0,2296 | |
| 0,06 | 0,01 | 2,0033 | 0,2066 | |
| 0,04 | 0,01 | 1,0153 | 0,1764 |
Största minskningarna detta kvartal
Vi använder förändringen i portföljallokeringen eftersom det är det mest meningsfulla måttet. Förändringar kan bero på transaktioner eller förändringar i aktiepriser.
| Värdepapper | Aktier (MM) |
Värde (MM$) |
Portfölj % av | ΔPortfölj % av |
|---|---|---|---|---|
| 0,04 | 0,01 | 1,9880 | −1,7194 | |
| 0,00 | 0,02 | 3,0912 | −0,9983 | |
| 0,21 | 0,02 | 2,8101 | −0,3945 | |
| 0,06 | 0,03 | 3,6622 | −0,3833 | |
| 0,06 | 0,02 | 2,8059 | −0,3255 | |
| 0,08 | 0,03 | 3,9673 | −0,3072 | |
| 0,07 | 0,02 | 2,6409 | −0,2992 | |
| 0,19 | 0,02 | 3,3377 | −0,2977 | |
| 0,16 | 0,02 | 2,7442 | −0,2616 | |
| 0,07 | 0,02 | 2,9190 | −0,2087 |
13F- och fond arkiveringar
Denna blankett lämnades in den 2025-07-11 för rapporteringsperioden 2025-06-30. Klicka på länksymbolen för att se hela transaktionshistoriken.
Uppgradera för att låsa upp premiumdata och exportera till Excel![]() .
.
| Värdepapper | Typ | Genomsnittligt aktiepris | Aktier (MM) |
ΔAktier (%) |
ΔAktier (%) |
Värde ($MM) |
Portfölj (%) |
ΔPortfölj (%) |
|
|---|---|---|---|---|---|---|---|---|---|
| MSFT / Microsoft Corporation | 0,08 | −16,23 | 0,04 | 11,43 | 5,3249 | 0,3724 | |||
| AMZN / Amazon.com, Inc. | 0,14 | −1,66 | 0,03 | 10,71 | 4,3137 | 0,3864 | |||
| GOOGL / Alphabet Inc. | 0,18 | −3,06 | 0,03 | 10,71 | 4,3073 | 0,2675 | |||
| ELV / Elevance Health, Inc. | 0,08 | 7,15 | 0,03 | −3,33 | 3,9673 | −0,3072 | |||
| XPRO / Expro Group Holdings N.V. | 0,17 | 32,79 | 0,03 | 3,70 | 3,9111 | 0,0166 | |||
| BRK.B / Berkshire Hathaway Inc. | 0,06 | 2,46 | 0,03 | −7,14 | 3,6622 | −0,3833 | |||
| ORCL / Oracle Corporation | 0,12 | 1 969,90 | 0,03 | 3,5792 | 3,4650 | ||||
| PEP / PepsiCo, Inc. | 0,19 | 7,63 | 0,02 | −4,00 | 3,3377 | −0,2977 | |||
| AZN / AstraZeneca PLC - Depositary Receipt (Common Stock) | 0,33 | 7,08 | 0,02 | 0,00 | 3,1004 | −0,0437 | |||
| BKNG / Booking Holdings Inc. | 0,00 | −37,90 | 0,02 | −24,14 | 3,0912 | −0,9983 | |||
| EMXC / iShares, Inc. - iShares MSCI Emerging Markets ex China ETF | 0,35 | −2,21 | 0,02 | 15,79 | 3,0202 | 0,2383 | |||
| T / AT&T Inc. | 0,76 | −5,30 | 0,02 | −4,55 | 2,9763 | −0,1944 | |||
| SYK / Stryker Corporation | 0,06 | −3,26 | 0,02 | 0,00 | 2,9606 | −0,0121 | |||
| GD / General Dynamics Corporation | 0,07 | −9,95 | 0,02 | −4,55 | 2,9190 | −0,2087 | |||
| 0LC6 / Sysco Corporation | 0,28 | −2,25 | 0,02 | 0,00 | 2,8752 | −0,1334 | |||
| CARR / Carrier Global Corporation | 0,28 | −11,24 | 0,02 | 0,00 | 2,8225 | −0,0214 | |||
| UPS / United Parcel Service, Inc. | 0,21 | −1,35 | 0,02 | −9,09 | 2,8101 | −0,3945 | |||
| AJG / Arthur J. Gallagher & Co. | 0,06 | −0,23 | 0,02 | −9,09 | 2,8059 | −0,3255 | |||
| TJX / The TJX Companies, Inc. | 0,16 | −7,04 | 0,02 | −4,76 | 2,7442 | −0,2616 | |||
| IJH / iShares Trust - iShares Core S&P Mid-Cap ETF | 0,33 | 0,60 | 0,02 | 11,11 | 2,7425 | 0,0948 | |||
| TFC / Truist Financial Corporation | 0,46 | 4,22 | 0,02 | 5,56 | 2,6966 | 0,1396 | |||
| USB / U.S. Bancorp | 0,43 | −0,89 | 0,02 | 5,56 | 2,6560 | 0,0746 | |||
| ACN / Accenture plc | 0,07 | −3,19 | 0,02 | −5,00 | 2,6409 | −0,2992 | |||
| AMD / Advanced Micro Devices, Inc. | 0,14 | −2,97 | 0,02 | 35,71 | 2,6181 | 0,6013 | |||
| V / Visa Inc. | 0,05 | −1,55 | 0,02 | 0,00 | 2,6157 | −0,0917 | |||
| FBIN / Fortune Brands Innovations, Inc. | 0,37 | 13,26 | 0,02 | −5,26 | 2,5661 | −0,2000 | |||
| AAPL / Apple Inc. | 0,08 | 2,88 | 0,02 | −6,25 | 2,1081 | −0,1823 | |||
| ADI / Analog Devices, Inc. | 0,06 | −2,47 | 0,01 | 16,67 | 2,0033 | 0,2066 | |||
| TMO / Thermo Fisher Scientific Inc. | 0,04 | −32,06 | 0,01 | −46,15 | 1,9880 | −1,7194 | |||
| 1SPGI / S&P Global Inc. | 0,03 | −1,58 | 0,01 | 0,00 | 1,9539 | −0,0211 | |||
| DHR / Danaher Corporation | 0,05 | 0,01 | 1,2276 | 1,2276 | |||||
| LRCX / Lam Research Corporation | 0,09 | −3,58 | 0,01 | 33,33 | 1,1458 | 0,2296 | |||
| ASML / ASML Holding N.V. - Depositary Receipt (Common Stock) | 0,01 | −0,18 | 0,01 | 16,67 | 1,0384 | 0,1504 | |||
| AMAT / Applied Materials, Inc. | 0,04 | −0,95 | 0,01 | 40,00 | 1,0153 | 0,1764 | |||
| VTI / Vanguard Index Funds - Vanguard Total Stock Market ETF | 0,01 | 0,00 | 0,00 | 0,00 | 0,4642 | 0,0308 | |||
| JNJ / Johnson & Johnson | 0,02 | −2,50 | 0,00 | −33,33 | 0,3842 | −0,0575 | |||
| GOOGL / Alphabet Inc. | 0,01 | −2,39 | 0,00 | 0,00 | 0,2560 | 0,0185 | |||
| GJR / Strats Trust For Procter & Gambel Security - Preferred Security | 0,01 | 0,00 | 0,00 | 0,00 | 0,2484 | −0,0260 | |||
| VOO / Vanguard Index Funds - Vanguard S&P 500 ETF | 0,00 | 2,72 | 0,00 | 0,00 | 0,2416 | 0,0220 | |||
| NVDA / NVIDIA Corporation | 0,01 | −0,12 | 0,00 | 0,1793 | 0,0522 | ||||
| SPY / SPDR S&P 500 ETF | 0,00 | −14,96 | 0,00 | 0,00 | 0,1730 | −0,0172 | |||
| PKB / Invesco Exchange-Traded Fund Trust - Invesco Building & Construction ETF | 0,01 | 29,14 | 0,00 | 0,1604 | 0,0381 | ||||
| US9229087104 / VANGUARD 500 INDEX FUND VANGUARD 500 INDEX ADM | 0,00 | 0,00 | 0,00 | 0,00 | 0,1528 | 0,0102 | |||
| IBM / International Business Machines Corporation | 0,00 | 0,00 | 0,00 | 0,1173 | 0,0152 | ||||
| XOM / Exxon Mobil Corporation | 0,01 | −1,76 | 0,00 | 0,1125 | −0,0179 | ||||
| BA / The Boeing Company | 0,00 | 0,00 | 0,00 | 0,1051 | 0,0168 | ||||
| BRK.A / Berkshire Hathaway Inc. | 0,00 | 0,00 | 0,00 | 0,0989 | −0,0129 | ||||
| HD / The Home Depot, Inc. | 0,00 | 0,00 | 0,00 | 0,0895 | −0,0029 | ||||
| MRK / Merck & Co., Inc. | 0,01 | −9,06 | 0,00 | 0,0856 | −0,0246 | ||||
| PFE / Pfizer Inc. | 0,02 | −0,84 | 0,00 | 0,0802 | −0,0071 | ||||
| CHVD / Chevron Corporation | 0,00 | 0,00 | 0,00 | 0,0796 | −0,0164 | ||||
| ABBV / AbbVie Inc. | 0,00 | −0,37 | 0,00 | 0,0756 | −0,0128 | ||||
| VTSAX / Vanguard Index Funds - Vanguard Total Stock Market Index Fund Admiral | 0,00 | 0,00 | 0,00 | 0,0739 | 0,0049 | ||||
| CSCO / Cisco Systems, Inc. | 0,01 | 0,00 | 0,00 | 0,0708 | 0,0057 | ||||
| LOW / Lowe's Companies, Inc. | 0,00 | 0,00 | 0,00 | 0,0707 | −0,0061 | ||||
| CI / The Cigna Group | 0,00 | 0,00 | 0,00 | 0,0684 | −0,0019 | ||||
| DIS / The Walt Disney Company | 0,00 | −0,30 | 0,00 | 0,0673 | 0,0118 | ||||
| PAYX / Paychex, Inc. | 0,00 | 0,00 | 0,00 | 0,0672 | −0,0064 | ||||
| IWF / iShares Trust - iShares Russell 1000 Growth ETF | 0,00 | 0,00 | 0,00 | 0,0667 | 0,0082 | ||||
| AXP / American Express Company | 0,00 | 0,00 | 0,00 | 0,0648 | 0,0083 | ||||
| ABT / Abbott Laboratories | 0,00 | 0,00 | 0,00 | 0,0554 | −0,0004 | ||||
| NEE / NextEra Energy, Inc. | 0,01 | −13,59 | 0,00 | 0,0539 | −0,0120 | ||||
| VNQ / Vanguard Specialized Funds - Vanguard Real Estate ETF | 0,00 | 0,00 | 0,00 | 0,0524 | −0,0027 | ||||
| IWM / iShares Trust - iShares Russell 2000 ETF | 0,00 | 0,00 | 0,00 | 0,0507 | 0,0023 | ||||
| AZO / AutoZone, Inc. | 0,00 | 0,00 | 0,00 | 0,0503 | −0,0030 | ||||
| VTWG / Vanguard Scottsdale Funds - Vanguard Russell 2000 Growth ETF | 0,00 | 0,00 | 0,00 | 0,0473 | 0,0036 | ||||
| NKE_KZ / NIKE, Inc. | 0,00 | 0,00 | 0,00 | 0,0471 | 0,0037 | ||||
| CTBI / Community Trust Bancorp, Inc. | 0,01 | −0,40 | 0,00 | 0,0445 | 0,0005 | ||||
| BAC / Bank of America Corporation | 0,01 | 0,00 | 0,00 | 0,0400 | 0,0036 | ||||
| US9229086940 / Vanguard Extended Market Index Admiral Shares | 0,00 | 0,00 | 0,00 | 0,0392 | 0,0029 | ||||
| VEEV / Veeva Systems Inc. | 0,00 | 0,00 | 0,00 | 0,0391 | 0,0066 | ||||
| ROK / Rockwell Automation, Inc. | 0,00 | 0,00 | 0,00 | 0,0383 | 0,0074 | ||||
| WMT / Walmart Inc. | 0,00 | 0,00 | 0,00 | 0,0378 | 0,0028 | ||||
| PM / Philip Morris International Inc. | 0,00 | 0,00 | 0,00 | 0,0370 | 0,0037 | ||||
| MPC / Marathon Petroleum Corporation | 0,00 | 0,00 | 0,00 | 0,0357 | 0,0033 | ||||
| AME / AMETEK, Inc. | 0,00 | 0,00 | 0,00 | 0,0331 | 0,0006 | ||||
| US3159108022 / Fidelity Diversified International Fund | 0,00 | 0,00 | 0,00 | 0,0320 | 0,0029 | ||||
| CSW / CSW Industrials, Inc. | 0,00 | 0,00 | 0,00 | 0,0311 | −0,0016 | ||||
| 77956H302 / T. Rowe Price International Discovery | 0,00 | 0,00 | 0,0308 | 0,0308 | |||||
| SIGHTLOGIX / (82699A903) | 0,08 | 0,00 | 0,0000 | ||||||
| ONC / Oncolytics Biotech Inc. | 0,02 | 33,33 | 0,00 | 0,0020 | 0,0009 | ||||
| IZOZF / Izotropic Corporation | 0,03 | 76,47 | 0,00 | 0,0007 | 0,0001 | ||||
| NKLAQ / Nikola Corporation | 0,01 | 0,00 | 0,00 | 0,0001 | −0,0000 | ||||
| NESS ENERGY INTERNATIONAL / (64104P105) | 0,02 | 0,00 | 0,0000 | ||||||
| DG / Dollar General Corporation | 0,00 | −100,00 | 0,00 | 0,0000 |