Grundläggande statistik
| Institutionella ägare | 230 total, 229 long only, 0 short only, 1 long/short - change of 5,02% MRQ |
| Genomsnittlig portföljallokering | 0.2478 % - change of −6,47% MRQ |
| Institutionella aktier (lång) | 9 789 220 (ex 13D/G) - change of 0,19MM shares 2,02% MRQ |
| Institutionellt värde (lång) | $ 1 558 879 USD ($1000) |
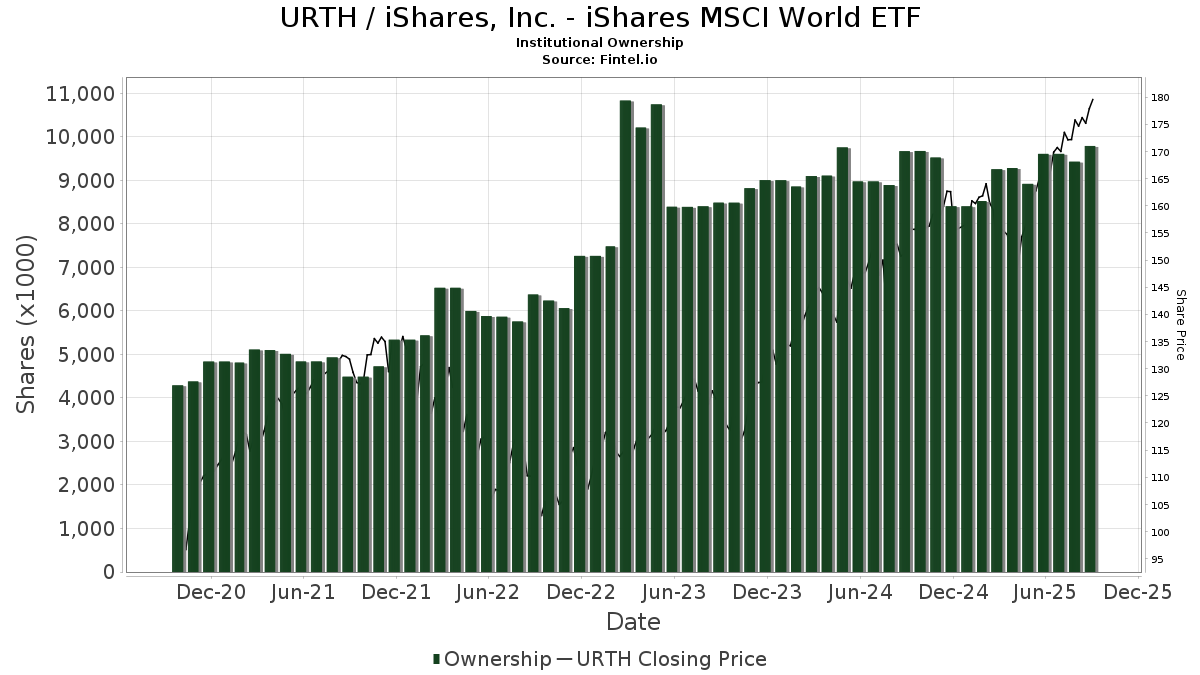
Institutionellt ägande och aktieägare
iShares, Inc. - iShares MSCI World ETF (US:URTH) har 230 Institutionella ägare och aktieägare som har lämnat in 13D/G- eller 13F-formulär till Securities Exchange Commission (SEC). Dessa institut innehar totalt 9,789,220 aktier. Största aktieägare inkluderar Royal Bank Of Canada, Morgan Stanley, Goldman Sachs Group Inc, Prudential Plc, Sumitomo Mitsui DS Asset Management Company, Ltd, Barings Llc, Obermeyer Wood Investment Counsel, Lllp, Evensky & Katz LLC, Mirae Asset Global Investments Co., Ltd., and Jpmorgan Chase & Co .
iShares, Inc. - iShares MSCI World ETF (ARCA:URTH) Institutionell ägarstruktur visar institutioners och fonders nuvarande positioner i företaget, samt de senaste förändringarna i positionernas storlek. Större aktieägare kan vara enskilda investerare, fonder, hedgefonder eller institutioner. Bilaga 13D visar att investeraren äger (eller ägde) mer än 5% av företaget och avser (eller avsåg) att aktivt eftersträva en förändring av affärsstrategin. Schedule 13G indikerar en passiv investering på över 5%.
The share price as of September 8, 2025 is 177,26 / share. Previously, on September 9, 2024, the share price was 149,33 / share. This represents an increase of 18,70% over that period.
Fondsentimentets poäng
Fondsentimentet poängen(fka Ägarackumulation-poäng) visar vilka aktier som är mest köpta av fonder. Det är resultatet av en sofistikerad kvantitativ flerfaktormodell som identifierar företag med de högsta nivåerna av institutionell ackumulering. Poängsättningsmodellen använder en kombination av den totala ökningen av redovisade ägare, förändringarna i portföljallokeringarna för dessa ägare och andra mått. Siffran sträcker sig från 0 till 100, där högre siffror indikerar en högre nivå av ackumulering i förhållande till sina konkurrenter, och 50 är genomsnittet.
Uppdateringsfrekvens: Dagligen
Se Ownership Explorer, som innehåller en lista över de högst rankade företagen.
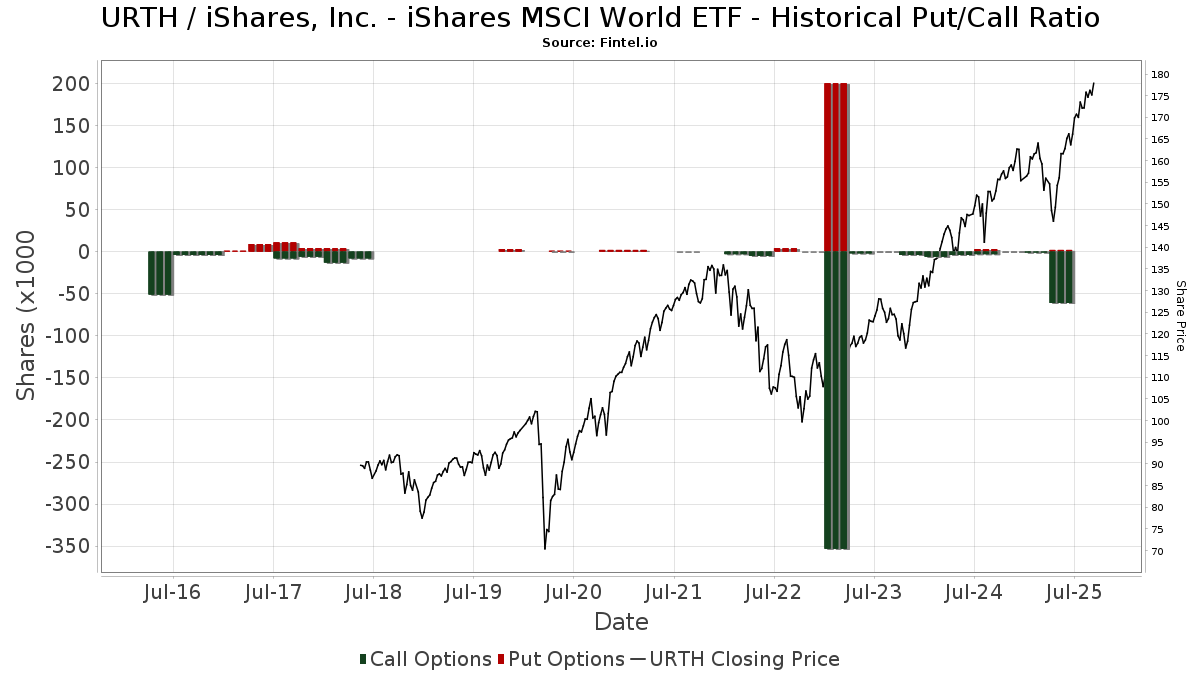
Institutionell sälj/köp-kvot
Förutom att rapportera vanliga eget kapital- och skuldemissioner måste institutioner med mer än 100MM tillgångar under förvaltning också avslöja sina innehav av sälj- och köpoptioner. Eftersom säljoptioner i allmänhet indikerar ett negativt sentiment och köpoptioner indikerar ett positivt sentiment, kan vi få en uppfattning om det övergripande institutionella sentimentet genom att plotta förhållandet mellan säljoptioner och köpoptioner. Diagrammet till höger visar det historiska förhållandet mellan sälj- och köpoptioner för detta instrument.
Genom att använda sälj/köp-kvoten som en indikator på aktieägarnas sentiment undviker man en av de största bristerna med att använda det totala institutionella ägandet, nämligen att en betydande del av de förvaltade tillgångarna investeras passivt för att följa index. Passivt förvaltade fonder köper vanligtvis inte optioner, så indikatorn för sälj/köp-kvoten ger en bättre bild av stämningen i aktivt förvaltade fonder.
13F- och NPORT-arkiveringar
Detaljer om 13F-arkiveringar är gratis. Detaljer om NP-arkiveringar kräver ett premiummedlemskap. Gröna rader indikerar nya positioner. Röda rader indikerar stängda positioner. Klicka på länk symbolen för att se hela transaktionshistoriken.
Uppgradera
för att låsa upp premiumdata och exportera till Excel ![]() .
.
| Fil Datum | Källa | Investerare | Typ | Genomsnittligt pris (beräknat) |
Aktier | Δ Aktier (%) |
Rapporterat värde (1000 USD) |
Δ Värde (%) |
Portföljallokering (%) |
|
|---|---|---|---|---|---|---|---|---|---|---|
| 2025-08-14 | 13F | Raymond James Financial Inc | 115 770 | 5,26 | 19 609 | 16,39 | ||||
| 2025-04-09 | 13F | LVW Advisors, LLC | 0 | −100,00 | 0 | |||||
| 2025-08-14 | 13F/A | Bank Julius Baer & Co. Ltd, Zurich | 84 860 | −18,21 | 14 374 | −19,98 | ||||
| 2025-08-12 | 13F | Prudential Financial Inc | 67 050 | 10 504 | ||||||
| 2025-08-08 | 13F | Emerald Investment Partners, Llc | 600 | 0,00 | 102 | 10,99 | ||||
| 2025-09-04 | 13F/A | Advisor Group Holdings, Inc. | 9 762 | −4,73 | 1 654 | 5,42 | ||||
| 2025-04-18 | 13F | Insigneo Advisory Services, Llc | 0 | −100,00 | 0 | −100,00 | ||||
| 2025-08-04 | 13F | Roble, Belko & Company, Inc | 14 | 0,00 | 0 | |||||
| 2025-08-14 | 13F | Main Street Financial Solutions, LLC | 3 029 | 513 | ||||||
| 2025-07-22 | 13F | Evensky & Katz LLC | 287 317 | 0,12 | 49 | 11,63 | ||||
| 2025-07-30 | 13F | Arbor Investment Advisors, LLC | 2 793 | 43,82 | 473 | 59,26 | ||||
| 2025-07-24 | 13F | Us Bancorp \de\ | 801 | 136 | ||||||
| 2025-08-11 | 13F | Wealthgarden F.s. Llc | 1 730 | 10,33 | 296 | 23,33 | ||||
| 2025-08-14 | 13F | BTG Pactual Asset Management US LLC | 1 470 | 0,00 | 225 | 0,00 | ||||
| 2025-08-14 | 13F | Financial Advisory Service, Inc. | 1 060 | 0,86 | 179 | 11,18 | ||||
| 2025-07-31 | 13F | Buckingham Strategic Partners | 1 650 | 0,00 | 279 | 10,71 | ||||
| 2025-07-30 | 13F | Bleakley Financial Group, LLC | 55 444 | 4,09 | 9 391 | 15,10 | ||||
| 2025-08-13 | 13F | Northwestern Mutual Wealth Management Co | 37 659 | −20,69 | 6 379 | −12,31 | ||||
| 2025-08-14 | 13F | Fmr Llc | 6 308 | 794,75 | 1 068 | 898,13 | ||||
| 2025-07-08 | 13F | Parallel Advisors, LLC | 187 | 0,54 | 32 | 10,71 | ||||
| 2025-07-10 | 13F | Exchange Traded Concepts, Llc | 714 | 121 | ||||||
| 2025-08-08 | 13F | Principal Financial Group Inc | 207 424 | 6,57 | 35 133 | 17,84 | ||||
| 2025-07-31 | 13F | AlTi Global, Inc. | 6 072 | 0,00 | 1 028 | 10,54 | ||||
| 2025-08-08 | 13F | SG Americas Securities, LLC | 3 553 | 0,65 | 1 | |||||
| 2025-08-14 | 13F | Federation des caisses Desjardins du Quebec | 3 135 | −58,82 | 531 | −54,46 | ||||
| 2025-08-07 | 13F | Runnymede Capital Advisors, Inc. | 0 | −100,00 | 0 | |||||
| 2025-08-14 | 13F | Ausdal Financial Partners, Inc. | 2 720 | 0,00 | 461 | 10,58 | ||||
| 2025-07-18 | 13F | Union Bancaire Privee, UBP SA | 7 851 | 823,65 | 1 199 | 829,46 | ||||
| 2025-07-10 | 13F | Sumitomo Mitsui DS Asset Management Company, Ltd | 473 643 | −24,05 | 80 226 | −16,01 | ||||
| 2025-08-14 | 13F | Bbr Partners, Llc | 22 957 | −2,11 | 3 888 | 8,24 | ||||
| 2025-07-11 | 13F | Compass Ion Advisors, LLC | 0 | −100,00 | 0 | |||||
| 2025-08-11 | 13F | Wealthspire Advisors, LLC | 3 866 | 0,00 | 655 | 10,47 | ||||
| 2025-07-08 | 13F | Webster Bank, N. A. | 300 | 0,00 | 51 | 11,11 | ||||
| 2025-07-24 | 13F | Blair William & Co/il | 6 694 | 3,37 | 1 134 | 14,33 | ||||
| 2025-08-14 | 13F | Atomi Financial Group, Inc. | 6 842 | 4,97 | 1 159 | 16,03 | ||||
| 2025-08-07 | 13F | Nwam Llc | 3 210 | 6,93 | 553 | 20,26 | ||||
| 2025-08-04 | 13F | Keybank National Association/oh | 3 050 | 0,00 | 517 | 10,49 | ||||
| 2025-08-14 | 13F | Gen-Wealth Partners Inc | 617 | 0,00 | 105 | 10,64 | ||||
| 2025-08-05 | 13F | KDT Advisors, LLC | 3 100 | 0,00 | 525 | 10,76 | ||||
| 2025-05-02 | 13F | BluePointe Capital Management, LLC | 41 546 | 25,51 | 6 364 | 23,63 | ||||
| 2025-08-14 | 13F | Waterford Advisors, LLC | 24 250 | 557,54 | 625 | 10,64 | ||||
| 2025-05-06 | 13F | Assetmark, Inc | 0 | −100,00 | 0 | |||||
| 2025-07-25 | 13F | Atria Wealth Solutions, Inc. | 1 256 | 213 | ||||||
| 2025-07-16 | 13F | Beaumont Financial Advisors, LLC | 2 110 | 0,00 | 357 | 10,53 | ||||
| 2025-08-14 | 13F | Mariner, LLC | 7 217 | 2,25 | 1 222 | 13,04 | ||||
| 2025-08-21 | NP | LAZARD RETIREMENT SERIES INC - Lazard Retirement Global Dynamic Multi-Asset Portfolio Investor Shares | 50 300 | 184,82 | 8 520 | 214,94 | ||||
| 2025-07-16 | 13F | Banque Pictet & Cie Sa | 28 523 | −0,63 | 4 831 | 9,87 | ||||
| 2025-08-08 | 13F | Banco Bilbao Vizcaya Argentaria, S.a. | 21 670 | −1,68 | 3 670 | 8,71 | ||||
| 2025-08-14 | 13F | Ameriprise Financial Inc | 4 879 | −0,14 | 826 | 10,43 | ||||
| 2025-07-15 | 13F | CHB Investment Group, LLC | 7 594 | −1,52 | 1 | 0,00 | ||||
| 2025-08-05 | 13F | MidAtlantic Capital Management, Inc. | 6 444 | 0,23 | 1 091 | 10,87 | ||||
| 2025-08-14 | 13F | DRW Securities, LLC | 0 | −100,00 | 0 | −100,00 | ||||
| 2025-08-13 | 13F | Holos Integrated Wealth LLC | 1 285 | −10,70 | 223 | 1,36 | ||||
| 2025-07-25 | 13F | We Are One Seven, LLC | 0 | −100,00 | 0 | |||||
| 2025-07-31 | 13F | Washington Trust Advisors, Inc. | 393 | 5,08 | 67 | 15,79 | ||||
| 2025-08-11 | 13F | Aptus Capital Advisors, LLC | 165 | −7,30 | 28 | 0,00 | ||||
| 2025-08-12 | 13F | Archer Investment Corp | 484 | 188,10 | 82 | 224,00 | ||||
| 2025-08-12 | 13F | Prudential Plc | 560 510 | −3,88 | 94 939 | 6,28 | ||||
| 2025-04-30 | 13F | Stratos Wealth Advisors, LLC | 0 | −100,00 | 0 | |||||
| 2025-08-13 | 13F | M&t Bank Corp | 8 382 | 4,70 | 1 420 | 15,74 | ||||
| 2025-08-14 | 13F | Colony Group, LLC | 4 598 | 0,24 | 779 | 10,83 | ||||
| 2025-08-15 | 13F | Tower Research Capital LLC (TRC) | 0 | −100,00 | 0 | |||||
| 2025-08-14 | 13F | Xponance, Inc. | 58 494 | 57,69 | 9 908 | 74,36 | ||||
| 2025-07-28 | 13F | BRYN MAWR TRUST Co | 4 793 | 0,00 | 812 | 10,49 | ||||
| 2025-08-12 | 13F | Personal Cfo Solutions, Llc | 3 002 | 508 | ||||||
| 2025-08-15 | 13F | Equitable Holdings, Inc. | 4 056 | 16,65 | 687 | 29,14 | ||||
| 2025-08-14 | 13F | Arizona PSPRS Trust | 0 | −100,00 | 0 | |||||
| 2025-05-15 | 13F | Squarepoint Ops LLC | 0 | −100,00 | 0 | |||||
| 2025-08-04 | 13F | Impact Partnership Wealth, LLC | 1 685 | −16,38 | 285 | −7,47 | ||||
| 2025-07-21 | 13F | Mirae Asset Global Investments Co., Ltd. | 264 024 | 8,79 | 44 720 | 20,54 | ||||
| 2025-08-04 | 13F | GAM Holding AG | 143 421 | 24 293 | ||||||
| 2025-07-23 | 13F | Joel Isaacson & Co., LLC | 4 793 | 0,00 | 812 | 10,49 | ||||
| 2025-08-06 | 13F | Pekin Hardy Strauss, Inc. | 8 800 | 0,00 | 1 491 | 10,62 | ||||
| 2025-07-15 | 13F | Financial Management Professionals, Inc. | 52 | 0,00 | 9 | 14,29 | ||||
| 2025-08-14 | 13F | Citadel Advisors Llc | 69 327 | 11 743 | ||||||
| 2025-07-24 | 13F | Fischer Investment Strategies, Llc | 52 943 | 13,34 | 8 967 | 25,32 | ||||
| 2025-07-17 | 13F | Nelson, Van Denburg & Campbell Wealth Management Group, LLC | 5 627 | −4,47 | 953 | 5,65 | ||||
| 2025-07-24 | 13F | Robertson Stephens Wealth Management, LLC | 3 272 | 0,77 | 554 | 11,47 | ||||
| 2025-08-08 | 13F | Cetera Investment Advisers | 74 235 | −5,83 | 12 574 | 4,13 | ||||
| 2025-08-13 | 13F | Lido Advisors, LLC | 48 589 | 664,70 | 8 230 | 745,84 | ||||
| 2025-08-04 | 13F | Atria Investments Llc | 1 630 | 276 | ||||||
| 2025-07-15 | 13F | Retirement Income Solutions, Inc | 3 985 | 0,00 | 675 | 10,49 | ||||
| 2025-08-08 | 13F | Hartland & Co., LLC | 126 | 0,00 | 21 | 10,53 | ||||
| 2025-08-14 | 13F | Lazard Asset Management Llc | 50 300 | 184,82 | 9 | 300,00 | ||||
| 2025-08-14 | 13F | Smartleaf Asset Management LLC | 1 315 | −29,57 | 222 | −22,46 | ||||
| 2025-07-29 | 13F | Horst & Graben Wealth Management LLC | 1 614 | 0,00 | 273 | 10,53 | ||||
| 2025-08-14 | 13F | Mercer Global Advisors Inc /adv | 2 488 | −2,66 | 421 | 7,67 | ||||
| 2025-08-12 | 13F | J.w. Cole Advisors, Inc. | 1 828 | 310 | ||||||
| 2025-08-12 | 13F | Barings Llc | 358 101 | 13,96 | 60 655 | 26,01 | ||||
| 2025-04-21 | 13F | Envestnet Portfolio Solutions, Inc. | 0 | −100,00 | 0 | |||||
| 2025-07-16 | 13F | Perigon Wealth Management, LLC | 2 561 | 0,08 | 434 | 10,74 | ||||
| 2025-08-11 | 13F | HighTower Advisors, LLC | 2 857 | 9,59 | 484 | 21,05 | ||||
| 2025-08-11 | 13F | TD Waterhouse Canada Inc. | 29 211 | −0,17 | 4 938 | 9,90 | ||||
| 2025-08-13 | 13F | Taikang Asset Management (Hong Kong) Co Ltd | 9 769 | −33,49 | 1 655 | −26,49 | ||||
| 2025-07-24 | 13F | IFP Advisors, Inc | 11 | 0,00 | 2 | 0,00 | ||||
| 2025-08-12 | 13F | LPL Financial LLC | 187 256 | 13,80 | 31 717 | 25,84 | ||||
| 2025-07-29 | 13F | Fundamentun, Llc | 5 051 | 39,96 | 856 | 54,89 | ||||
| 2025-07-29 | 13F | JTC Employer Solutions Trusteee Ltd | 878 | 0,00 | 0 | |||||
| 2025-08-15 | 13F | CI Private Wealth, LLC | 1 304 | 221 | ||||||
| 2025-08-12 | 13F | Seeds Investor Llc | 9 433 | 66,57 | 1 598 | 84,20 | ||||
| 2025-08-19 | 13F | Advisory Services Network, LLC | 3 290 | 67,60 | 563 | 87,33 | ||||
| 2025-08-05 | 13F | Dunhill Financial, LLC | 400 | 68 | ||||||
| 2025-08-14 | 13F | Old Mission Capital Llc | 0 | −100,00 | 0 | |||||
| 2025-08-05 | 13F | Tsfg, Llc | 403 | 0,00 | 0 | |||||
| 2025-07-22 | 13F | Valeo Financial Advisors, LLC | 4 068 | 0,00 | 689 | 10,59 | ||||
| 2025-08-14 | 13F | EP Wealth Advisors, Inc. | 905 | 0,33 | 153 | 10,87 | ||||
| 2025-07-28 | 13F | Sagespring Wealth Partners, Llc | 3 363 | −20,94 | 570 | −12,60 | ||||
| 2025-08-13 | 13F | Cerity Partners LLC | 5 374 | 0,00 | 910 | 10,57 | ||||
| 2025-08-13 | 13F | Silphium Asset Management Ltd | 44 830 | 7 593 | ||||||
| 2025-08-14 | 13F | Ieq Capital, Llc | 3 006 | 3,62 | 509 | 14,64 | ||||
| 2025-07-29 | 13F | Private Trust Co Na | 238 | 0,00 | 40 | 11,11 | ||||
| 2025-08-14 | 13F | Tudor Investment Corp Et Al | 1 881 | 319 | ||||||
| 2025-08-14 | 13F | Bank Of America Corp /de/ | 202 674 | −32,93 | 34 329 | −25,84 | ||||
| 2025-08-14 | 13F | Warren Averett Asset Management, LLC | 3 822 | 647 | ||||||
| 2025-08-04 | 13F | JDM Financial Group LLC | 1 457 | 0,00 | 247 | 10,31 | ||||
| 2025-08-08 | 13F | Pnc Financial Services Group, Inc. | 18 935 | 0,00 | 3 207 | 10,59 | ||||
| 2025-08-13 | 13F | Qtron Investments LLC | 5 337 | 904 | ||||||
| 2025-08-12 | 13F | CIBC Private Wealth Group, LLC | 50 | 0,00 | 8 | 33,33 | ||||
| 2025-08-12 | 13F | Bokf, Na | 0 | −100,00 | 0 | |||||
| 2025-08-12 | 13F | Jpmorgan Chase & Co | 263 989 | 15,82 | 44 715 | 28,07 | ||||
| 2025-08-14 | 13F | Comerica Bank | 186 | 84,16 | 31 | 106,67 | ||||
| 2025-08-14 | 13F | Two Sigma Securities, Llc | 2 052 | 42,70 | 348 | 57,73 | ||||
| 2025-05-13 | 13F | Sterling Capital Management LLC | 0 | −100,00 | 0 | |||||
| 2025-08-14 | 13F | Susquehanna International Group, Llp | 2 031 | 344 | ||||||
| 2025-07-17 | 13F | Keystone Global Partners, LLC | 124 | 195,24 | 21 | 250,00 | ||||
| 2025-08-11 | 13F | Principal Securities, Inc. | 1 155 | 178,99 | 196 | 204,69 | ||||
| 2025-08-14 | 13F | Susquehanna International Group, Llp | Call | 61 000 | 3 488,24 | 10 332 | 3 873,85 | |||
| 2025-08-14 | 13F | C M Bidwell & Associates Ltd | 432 | 0,23 | 73 | 10,61 | ||||
| 2025-08-14 | 13F | Susquehanna International Group, Llp | Put | 2 300 | 390 | |||||
| 2025-07-30 | 13F | Strategic Blueprint, LLC | 4 320 | 167,00 | 732 | 195,95 | ||||
| 2025-08-08 | 13F | Avantax Advisory Services, Inc. | 0 | −100,00 | 0 | |||||
| 2025-07-28 | 13F | Arlington Financial Advisors, LLC | 2 975 | −29,88 | 504 | −22,50 | ||||
| 2025-07-29 | 13F | Signature Estate & Investment Advisors Llc | 1 420 | 8,48 | 241 | 20,00 | ||||
| 2025-08-14 | 13F | Brevan Howard Capital Management LP | 0 | −100,00 | 0 | |||||
| 2025-08-15 | 13F | Captrust Financial Advisors | 2 757 | 467 | ||||||
| 2025-08-18 | 13F | Geneos Wealth Management Inc. | 1 012 | 0,10 | 171 | 11,04 | ||||
| 2025-08-25 | 13F | Fulcrum Equity Management | 46 192 | 0,00 | 7 824 | 10,59 | ||||
| 2025-08-11 | 13F | Citigroup Inc | 2 713 | 1,95 | 460 | 12,78 | ||||
| 2025-08-13 | 13F | EverSource Wealth Advisors, LLC | 6 | 0,00 | 1 | |||||
| 2025-07-17 | 13F | BFI Infinity Ltd. | 2 056 | 348 | ||||||
| 2025-08-06 | 13F | AE Wealth Management LLC | 150 | 1 400,00 | 25 | 2 400,00 | ||||
| 2025-08-12 | 13F | Auxano Advisors, LLC | 1 270 | 215 | ||||||
| 2025-08-07 | 13F | LOM Asset Management Ltd | 5 165 | 1 | ||||||
| 2025-05-15 | 13F | Rakuten Investment Management, Inc. | 1 | 0 | ||||||
| 2025-07-18 | 13F | First Pacific Financial | 0 | −100,00 | 0 | −100,00 | ||||
| 2025-07-30 | 13F | Lorne Steinberg Wealth Management Inc. | 9 779 | 109,58 | 1 656 | 131,93 | ||||
| 2025-08-14 | 13F | Great Valley Advisor Group, Inc. | 7 347 | −3,62 | 1 244 | 6,60 | ||||
| 2025-08-13 | 13F | Quadrature Capital Ltd | 0 | −100,00 | 0 | |||||
| 2025-08-07 | 13F | LFA - Lugano Financial Advisors SA | 108 | 18 | ||||||
| 2025-08-14 | 13F | Financial Engines Advisors L.L.C. | 1 250 | −36,42 | 212 | −29,57 | ||||
| 2025-07-30 | 13F | Retirement Planning Group | 7 236 | −0,44 | 1 226 | 10,06 | ||||
| 2025-08-11 | 13F | Sierra Capital LLC | 10 814 | 1,72 | 2 | 0,00 | ||||
| 2025-07-15 | 13F | Compagnie Lombard Odier SCmA | 48 329 | 10,54 | 8 186 | 22,22 | ||||
| 2025-07-31 | 13F | Glass Jacobson Investment Advisors llc | 0 | −100,00 | 0 | |||||
| 2025-08-12 | 13F | Ci Investments Inc. | 122 633 | −5,70 | 21 | 5,26 | ||||
| 2025-08-14 | 13F | Snowden Capital Advisors LLC | 3 700 | 0,00 | 627 | 10,60 | ||||
| 2025-08-13 | 13F | Rsm Us Wealth Management Llc | 2 364 | 400 | ||||||
| 2025-07-16 | 13F/A | CX Institutional | 5 041 | −6,04 | 1 | |||||
| 2025-08-04 | 13F | Creekmur Asset Management LLC | 103 | 0,00 | 17 | 13,33 | ||||
| 2025-08-13 | 13F | Mackenzie Financial Corp | 39 843 | 22,61 | 6 749 | 35,58 | ||||
| 2025-04-28 | 13F | D.a. Davidson & Co. | 0 | −100,00 | 0 | |||||
| 2025-08-15 | 13F | Kestra Advisory Services, LLC | 0 | −100,00 | 0 | |||||
| 2025-08-01 | 13F | Envestnet Asset Management Inc | 128 615 | −8,40 | 21 785 | 1,28 | ||||
| 2025-07-18 | 13F | Centricity Wealth Management, LLC | 450 | 0,00 | 76 | 11,76 | ||||
| 2025-08-27 | NP | PRUDENTIAL SERIES FUND - GLOBAL PORTFOLIO Class I | 67 050 | 11 357 | ||||||
| 2025-07-30 | 13F | Wbh Advisory Inc | 18 917 | 15,71 | 3 204 | 27,96 | ||||
| 2025-07-23 | 13F | Litman Gregory Asset Management LLC | 9 348 | 9,10 | 1 583 | 20,66 | ||||
| 2025-05-14 | 13F | Causeway Capital Management Llc | 0 | −100,00 | 0 | |||||
| 2025-07-16 | 13F | Magnus Financial Group LLC | 3 017 | 0,87 | 511 | 11,57 | ||||
| 2025-08-05 | 13F | Main Street Research LLC | 18 688 | 0,99 | 3 165 | 11,68 | ||||
| 2025-08-13 | 13F | Brown Advisory Inc | 30 272 | 0,60 | 5 127 | 11,24 | ||||
| 2025-08-12 | 13F | AlphaCore Capital LLC | 1 075 | 217,11 | 182 | 256,86 | ||||
| 2025-08-14 | 13F | DZ BANK AG Deutsche Zentral Genossenschafts Bank, Frankfurt am Main | 0 | −100,00 | 0 | |||||
| 2025-08-14 | 13F | LWM Advisory Services, LLC | 3 242 | 0,00 | 549 | 10,69 | ||||
| 2025-08-14 | 13F | Banque Transatlantique SA | 0 | −100,00 | 0 | |||||
| 2025-08-14 | 13F | Jane Street Group, Llc | 0 | −100,00 | 0 | |||||
| 2025-05-08 | 13F | Letko, Brosseau & Associates Inc | 0 | −100,00 | 0 | |||||
| 2025-08-14 | 13F | Gerber Kawasaki Wealth & Investment Management | 79 757 | 3,34 | 13 509 | 14,27 | ||||
| 2025-07-30 | 13F | Rehmann Capital Advisory Group | 2 373 | 0,00 | 402 | 10,47 | ||||
| 2025-08-04 | 13F | Migdal Insurance & Financial Holdings Ltd. | 1 300 | 0,00 | 0 | |||||
| 2025-07-28 | 13F | J.Safra Asset Management Corp | 1 274 | 0,00 | 215 | 9,74 | ||||
| 2025-08-13 | 13F | Jones Financial Companies Lllp | 3 108 | 71,52 | 524 | 88,81 | ||||
| 2025-08-12 | 13F | Jefferies Financial Group Inc. | 0 | −100,00 | 0 | |||||
| 2025-08-13 | 13F | Mount Capital Ltd | 23 725 | −8,75 | 4 019 | 0,90 | ||||
| 2025-08-13 | 13F | Hsbc Holdings Plc | 34 600 | 0,00 | 5 861 | 10,57 | ||||
| 2025-08-12 | 13F | BlackRock, Inc. | 145 072 | 43,37 | 24 572 | 58,54 | ||||
| 2025-08-13 | 13F | Avestar Capital, LLC | 17 137 | −18,69 | 2 903 | −10,10 | ||||
| 2025-07-29 | 13F | Angeles Wealth Management, Llc | 119 304 | 5,68 | 20 208 | 16,86 | ||||
| 2025-08-14 | 13F | Bnp Paribas Arbitrage, Sa | 4 521 | −1,42 | 766 | 8,97 | ||||
| 2025-08-12 | 13F | Investments & Financial Planning, LLC | 54 495 | 6,40 | 9 230 | 17,65 | ||||
| 2025-04-23 | 13F | Corundum Group, Inc. | 0 | −100,00 | 0 | |||||
| 2025-08-13 | 13F | First Trust Advisors Lp | 17 137 | −18,69 | 2 903 | −10,10 | ||||
| 2025-08-12 | 13F | Edmond De Rothschild Holding S.a. | 5 615 | 0,00 | 951 | 10,58 | ||||
| 2025-05-12 | 13F | Independent Advisor Alliance | 0 | −100,00 | 0 | |||||
| 2025-08-14 | 13F | CIBC World Markets Inc. | 2 610 | 1,05 | 442 | 11,90 | ||||
| 2025-08-14 | 13F | Empire Life Investments Inc. | 76 900 | 9,54 | 13 025 | 21,13 | ||||
| 2025-08-14 | 13F | Centerstone Investors, LLC | 0 | −100,00 | 0 | |||||
| 2025-08-14 | 13F | Glen Eagle Advisors, LLC | 200 | 0,00 | 34 | 10,00 | ||||
| 2025-05-09 | 13F | Headlands Technologies LLC | 0 | −100,00 | 0 | |||||
| 2025-08-14 | 13F | Goldman Sachs Group Inc | 571 899 | −5,43 | 96 868 | 4,58 | ||||
| 2025-07-23 | 13F | Vontobel Holding Ltd. | 14 042 | 37,80 | 2 378 | 52,44 | ||||
| 2025-07-29 | 13F | Activest Wealth Management | 443 | 0,68 | 75 | 11,94 | ||||
| 2025-08-18 | 13F/A | National Bank Of Canada /fi/ | 574 | 731,88 | 97 | 870,00 | ||||
| 2025-07-29 | 13F | Chicago Partners Investment Group LLC | 3 031 | 0,76 | 526 | 11,94 | ||||
| 2025-08-05 | 13F | Cassaday & Co Wealth Management LLC | 1 740 | −2,79 | 295 | 7,30 | ||||
| 2025-07-31 | 13F | Nisa Investment Advisors, Llc | 1 500 | 0,00 | 254 | 10,92 | ||||
| 2025-08-08 | 13F | Gts Securities Llc | 1 727 | 293 | ||||||
| 2025-08-14 | 13F | ICONIQ Capital, LLC | 29 109 | 0,00 | 4 930 | 10,59 | ||||
| 2025-08-01 | 13F | SYM FINANCIAL Corp | 1 546 | 94,22 | 262 | 115,70 | ||||
| 2025-08-14 | 13F | Scientech Research LLC | 0 | −100,00 | 0 | |||||
| 2025-08-14 | 13F | GWM Advisors LLC | 25 404 | 70 466,67 | 4 303 | 85 940,00 | ||||
| 2025-08-14 | 13F | Partners Capital Investment Group, Llp | 28 981 | −83,53 | 4 909 | −81,79 | ||||
| 2025-07-23 | 13F | Ameliora Wealth Management Ltd. | 440 | −25,42 | 75 | −17,78 | ||||
| 2025-08-14 | 13F | Hrt Financial Lp | 1 876 | 0 | ||||||
| 2025-08-13 | 13F | StoneX Group Inc. | 2 347 | 2,62 | 398 | 13,43 | ||||
| 2025-08-13 | 13F | PineBridge Investments, L.P. | 59 103 | 75,49 | 10 011 | 94,07 | ||||
| 2025-07-16 | 13F | Signaturefd, Llc | 74 | 0,00 | 13 | 9,09 | ||||
| 2025-08-13 | 13F | Schroder Investment Management Group | 94 784 | 2,78 | 15 980 | 13,33 | ||||
| 2025-08-13 | 13F | Allie Family Office LLC | 2 478 | 0,00 | 420 | 10,55 | ||||
| 2025-07-30 | 13F | Whittier Trust Co | 1 775 | 0,00 | 301 | 10,70 | ||||
| 2025-08-01 | 13F | Banco Santander, S.A. | 206 346 | −14,41 | 34 951 | −5,36 | ||||
| 2025-08-05 | 13F | Mission Wealth Management, Lp | 2 641 | 0,00 | 447 | 10,64 | ||||
| 2025-08-14 | 13F | Glenmede Investment Management, LP | 3 927 | 665 | ||||||
| 2025-07-30 | 13F | LGT Financial Advisors LLC | 12 | 2 | ||||||
| 2025-08-12 | 13F | Steward Partners Investment Advisory, Llc | 17 | 0,00 | 3 | 0,00 | ||||
| 2025-08-07 | 13F | Resources Investment Advisors, LLC. | 2 284 | 387 | ||||||
| 2025-08-14 | 13F | Mml Investors Services, Llc | 4 026 | −60,57 | 1 | −100,00 | ||||
| 2025-07-17 | 13F | Fifth Third Securities, Inc. | 11 651 | 8,30 | 1 973 | 19,72 | ||||
| 2025-07-14 | 13F | Park Avenue Securities Llc | 4 172 | −30,20 | 1 | |||||
| 2025-08-15 | 13F | First Heartland Consultants, Inc. | 1 630 | 276 | ||||||
| 2025-08-14 | 13F | Sunbelt Securities, Inc. | 173 | 0,00 | 27 | 0,00 | ||||
| 2025-08-11 | 13F | Y.D. More Investments Ltd | 215 | 0,00 | 36 | 12,50 | ||||
| 2025-05-16 | 13F | Guardian Partners Inc. | 0 | −100,00 | 0 | |||||
| 2025-08-05 | 13F | Bank of New York Mellon Corp | 1 996 | −4,36 | 338 | 5,96 | ||||
| 2025-08-12 | 13F | Jaffetilchin Investment Partners, LLC | 2 625 | 0,77 | 445 | 11,28 | ||||
| 2025-08-13 | 13F | Cresset Asset Management, LLC | 21 749 | 30,45 | 3 684 | 44,26 | ||||
| 2025-08-14 | 13F | Qube Research & Technologies Ltd | 95 | −92,33 | 16 | −91,53 | ||||
| 2025-08-07 | 13F | Allworth Financial LP | 2 026 | −3,48 | 343 | 7,52 | ||||
| 2025-08-14 | 13F | UBS Group AG | 126 409 | 3,26 | 21 411 | 14,18 | ||||
| 2025-05-15 | 13F | Glenmede Trust Co Na | 3 927 | 0,00 | 602 | −1,48 | ||||
| 2025-08-14 | 13F | Royal Bank Of Canada | 1 538 407 | 5,49 | 260 576 | 16,65 | ||||
| 2025-08-13 | 13F | GeoWealth Management, LLC | 206 | 0,98 | 35 | 9,68 | ||||
| 2025-08-05 | 13F | Simplex Trading, Llc | 1 997 | 0 | ||||||
| 2025-08-06 | 13F | Vestmark Advisory Solutions, Inc. | 0 | −100,00 | 0 | |||||
| 2025-05-15 | 13F | Citadel Advisors Llc | Put | 0 | −100,00 | 0 | −100,00 | |||
| 2025-08-05 | 13F | BEAM Asset Management, LLC | 22 996 | −6,38 | 3 895 | 3,54 | ||||
| 2025-05-15 | 13F | Citadel Advisors Llc | Call | 0 | −100,00 | 0 | −100,00 | |||
| 2025-07-21 | 13F | J. Safra Sarasin Holding AG | 15 869 | 2 688 | ||||||
| 2025-04-10 | 13F | Veracity Capital LLC | 0 | −100,00 | 0 | −100,00 | ||||
| 2025-04-29 | 13F | Truist Financial Corp | 0 | −100,00 | 0 | |||||
| 2025-07-15 | 13F | Pictet North America Advisors SA | 16 365 | −81,06 | 2 772 | −79,07 | ||||
| 2025-07-17 | 13F/A | Capital Investment Advisors, LLC | 10 073 | −11,13 | 1 706 | −1,73 | ||||
| 2025-08-12 | 13F | Global Retirement Partners, LLC | 1 | 0,00 | 0 | |||||
| 2025-08-01 | 13F | Brookwood Investment Group LLC | 1 662 | 0,73 | 281 | 11,51 | ||||
| 2025-08-13 | 13F | 1832 Asset Management L.P. | 1 995 | 338 | ||||||
| 2025-08-13 | 13F | Victory Capital Management Inc | 9 664 | 0,00 | 1 637 | 10,54 | ||||
| 2025-08-15 | 13F | Morgan Stanley | 875 450 | 52,61 | 148 284 | 68,75 | ||||
| 2025-07-22 | 13F | BridgePort Financial Solutions, LLC | 2 148 | 0,75 | 364 | 11,35 | ||||
| 2025-07-31 | 13F | PKO Investment Management Joint-Stock Co | 24 800 | 0,00 | 4 201 | 10,58 | ||||
| 2025-08-05 | 13F | Sheridan Capital Management, LLC | 16 621 | 0,00 | 2 815 | 10,57 | ||||
| 2025-08-13 | 13F | Renaissance Technologies Llc | 22 600 | 370,83 | 3 828 | 420,68 | ||||
| 2025-08-05 | 13F | Bank Of Montreal /can/ | 151 032 | −10,67 | 25 582 | −1,22 | ||||
| 2025-07-07 | 13F | Investors Research Corp | 396 | −27,47 | 67 | −19,28 | ||||
| 2025-08-05 | 13F | Obermeyer Wood Investment Counsel, Lllp | 341 698 | 57 877 | ||||||
| 2025-08-06 | 13F | Stone House Investment Management, LLC | 39 | 0,00 | 7 | 20,00 | ||||
| 2025-07-25 | 13F | Sequoia Financial Advisors, LLC | 22 262 | 29,36 | 3 771 | 43,02 | ||||
| 2025-08-04 | 13F | Mesirow Financial Investment Management, Inc. | 0 | −100,00 | 0 | |||||
| 2025-08-14 | 13F | Wells Fargo & Company/mn | 26 501 | −1,27 | 4 489 | 9,17 | ||||
| 2025-08-06 | 13F | Commonwealth Equity Services, Llc | 26 018 | −14,48 | 4 | 0,00 | ||||
| 2025-07-15 | 13F | Td Private Client Wealth Llc | 7 818 | −1,39 | 1 324 | 9,06 | ||||
| 2025-07-31 | 13F | Cambridge Investment Research Advisors, Inc. | 21 370 | 133,48 | 4 | 200,00 | ||||
| 2025-07-07 | 13F | RDA Financial Network | 2 361 | 1,29 | 400 | 11,76 | ||||
| 2025-08-12 | 13F | Proequities, Inc. | 0 | 0 |
Other Listings
| MX:URTH |