Grundläggande statistik
| Institutionella ägare | 134 total, 134 long only, 0 short only, 0 long/short - change of 6,35% MRQ |
| Genomsnittlig portföljallokering | 0.5912 % - change of 32,59% MRQ |
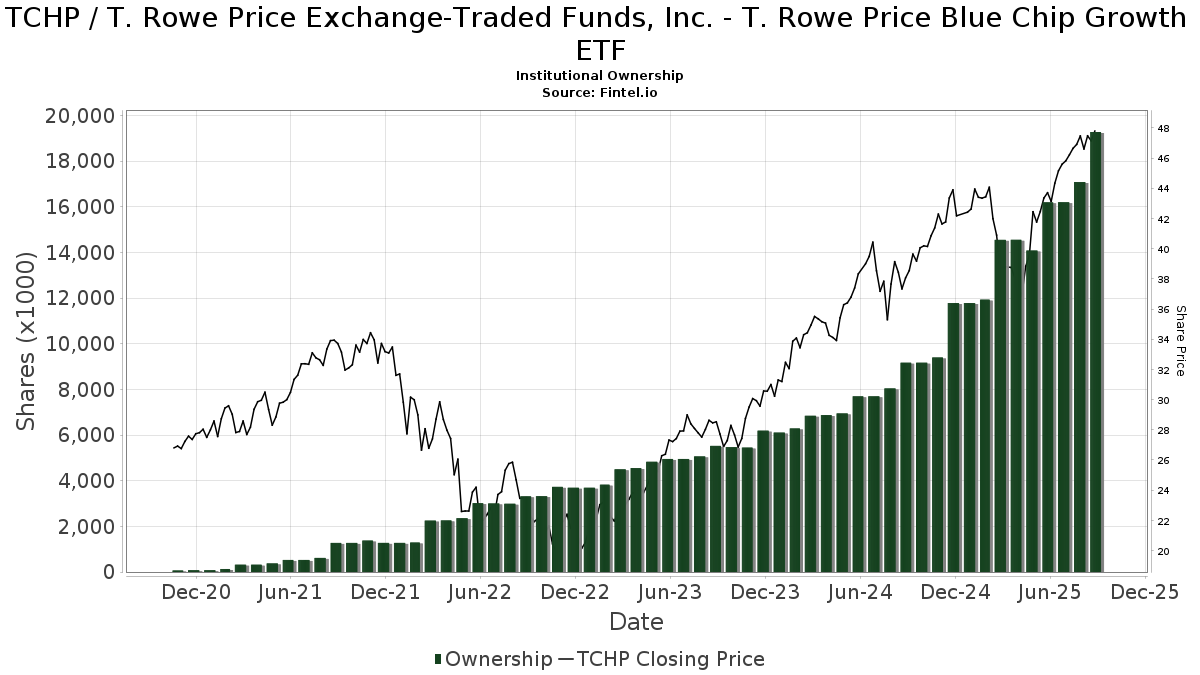
| Institutionella aktier (lång) | 19 276 564 (ex 13D/G) - change of 3,08MM shares 19,01% MRQ |
| Institutionellt värde (lång) | $ 709 461 USD ($1000) |
Institutionellt ägande och aktieägare
T. Rowe Price Exchange-Traded Funds, Inc. - T. Rowe Price Blue Chip Growth ETF (US:TCHP) har 134 Institutionella ägare och aktieägare som har lämnat in 13D/G- eller 13F-formulär till Securities Exchange Commission (SEC). Dessa institut innehar totalt 19,276,564 aktier. Största aktieägare inkluderar Cetera Investment Advisers, Northwestern Mutual Wealth Management Co, Glenview Trust Co, Bank Of America Corp /de/, PRSGX - Spectrum Growth Fund, Price T Rowe Associates Inc /md/, Trust Co of Kansas, Envestnet Asset Management Inc, Commonwealth Equity Services, Llc, and Jones Financial Companies Lllp .
T. Rowe Price Exchange-Traded Funds, Inc. - T. Rowe Price Blue Chip Growth ETF (ARCA:TCHP) Institutionell ägarstruktur visar institutioners och fonders nuvarande positioner i företaget, samt de senaste förändringarna i positionernas storlek. Större aktieägare kan vara enskilda investerare, fonder, hedgefonder eller institutioner. Bilaga 13D visar att investeraren äger (eller ägde) mer än 5% av företaget och avser (eller avsåg) att aktivt eftersträva en förändring av affärsstrategin. Schedule 13G indikerar en passiv investering på över 5%.
The share price as of September 11, 2025 is 47,92 / share. Previously, on September 12, 2024, the share price was 38,62 / share. This represents an increase of 24,08% over that period.
Fondsentimentets poäng
Fondsentimentet poängen(fka Ägarackumulation-poäng) visar vilka aktier som är mest köpta av fonder. Det är resultatet av en sofistikerad kvantitativ flerfaktormodell som identifierar företag med de högsta nivåerna av institutionell ackumulering. Poängsättningsmodellen använder en kombination av den totala ökningen av redovisade ägare, förändringarna i portföljallokeringarna för dessa ägare och andra mått. Siffran sträcker sig från 0 till 100, där högre siffror indikerar en högre nivå av ackumulering i förhållande till sina konkurrenter, och 50 är genomsnittet.
Uppdateringsfrekvens: Dagligen
Se Ownership Explorer, som innehåller en lista över de högst rankade företagen.
Institutionell sälj/köp-kvot
Förutom att rapportera vanliga eget kapital- och skuldemissioner måste institutioner med mer än 100MM tillgångar under förvaltning också avslöja sina innehav av sälj- och köpoptioner. Eftersom säljoptioner i allmänhet indikerar ett negativt sentiment och köpoptioner indikerar ett positivt sentiment, kan vi få en uppfattning om det övergripande institutionella sentimentet genom att plotta förhållandet mellan säljoptioner och köpoptioner. Diagrammet till höger visar det historiska förhållandet mellan sälj- och köpoptioner för detta instrument.
Genom att använda sälj/köp-kvoten som en indikator på aktieägarnas sentiment undviker man en av de största bristerna med att använda det totala institutionella ägandet, nämligen att en betydande del av de förvaltade tillgångarna investeras passivt för att följa index. Passivt förvaltade fonder köper vanligtvis inte optioner, så indikatorn för sälj/köp-kvoten ger en bättre bild av stämningen i aktivt förvaltade fonder.
13F- och NPORT-arkiveringar
Detaljer om 13F-arkiveringar är gratis. Detaljer om NP-arkiveringar kräver ett premiummedlemskap. Gröna rader indikerar nya positioner. Röda rader indikerar stängda positioner. Klicka på länk symbolen för att se hela transaktionshistoriken.
Uppgradera
för att låsa upp premiumdata och exportera till Excel ![]() .
.
| Fil Datum | Källa | Investerare | Typ | Genomsnittligt pris (beräknat) |
Aktier | Δ Aktier (%) |
Rapporterat värde (1000 USD) |
Δ Värde (%) |
Portföljallokering (%) |
|
|---|---|---|---|---|---|---|---|---|---|---|
| 2025-08-13 | 13F | Jones Financial Companies Lllp | 689 919 | 38,09 | 31 074 | 63,33 | ||||
| 2025-08-11 | 13F | Landaas & Co /wi /adv | 17 617 | 60,64 | 799 | 91,15 | ||||
| 2025-07-28 | 13F | Mitchell Mcleod Pugh & Williams Inc | 20 362 | 3,00 | 923 | 22,58 | ||||
| 2025-07-29 | 13F | Stratos Wealth Advisors, LLC | 17 994 | −27,28 | 816 | −13,38 | ||||
| 2025-08-14 | 13F | Destination Wealth Management | 0 | −100,00 | 0 | |||||
| 2025-08-14 | 13F | Wells Fargo & Company/mn | 1 849 | 84 | ||||||
| 2025-05-09 | 13F | GeoWealth Management, LLC | 0 | −100,00 | 0 | −100,00 | ||||
| 2025-08-08 | 13F | Cetera Investment Advisers | 3 282 913 | 108,91 | 148 880 | 148,73 | ||||
| 2025-08-14 | 13F | Fmr Llc | 1 100 | 50 | ||||||
| 2025-08-13 | 13F | Legacy Capital Wealth Partners, LLC | 25 661 | 9,60 | 1 164 | 30,53 | ||||
| 2025-08-14 | 13F | Glenview Trust Co | 1 759 213 | 4,68 | 79 780 | 24,64 | ||||
| 2025-08-14 | 13F | GWM Advisors LLC | 34 013 | −32,44 | 1 542 | −19,56 | ||||
| 2025-07-08 | 13F | Goldstone Financial Group, LLC | 13 736 | −0,95 | 627 | 18,56 | ||||
| 2025-07-29 | 13F | Elevation Capital Advisory, LLC | 288 685 | 254,21 | 13 092 | 321,75 | ||||
| 2025-07-17 | 13F | Janney Montgomery Scott LLC | 286 763 | 18,24 | 13 | 44,44 | ||||
| 2025-05-12 | 13F | Jpmorgan Chase & Co | 0 | −100,00 | 0 | |||||
| 2025-08-07 | 13F | Traynor Capital Management, Inc. | 0 | −100,00 | 0 | |||||
| 2025-08-14 | 13F | Raymond James Financial Inc | 353 837 | −1,54 | 16 047 | 17,23 | ||||
| 2025-08-11 | 13F | Private Advisor Group, LLC | 11 209 | −11,91 | 508 | 4,96 | ||||
| 2025-08-12 | 13F | MAI Capital Management | 13 986 | 41,20 | 634 | 68,17 | ||||
| 2025-05-15 | 13F | National Wealth Management Group, LLC | 226 539 | 5,77 | 8 629 | −4,34 | ||||
| 2025-04-25 | 13F | BankPlus Wealth Management LLC | 0 | −100,00 | 0 | |||||
| 2025-07-15 | 13F | Verum Partners LLC | 7 399 | 0,00 | 336 | 19,22 | ||||
| 2025-08-26 | NP | PRSGX - Spectrum Growth Fund This fund is a listed as child fund of Price T Rowe Associates Inc /md/ and if that institution has disclosed ownership in this security, then these positions will not be double counted when calculating total shares and total value | 1 250 001 | 0,00 | 56 688 | 19,06 | ||||
| 2025-07-23 | 13F | Citizens National Bank Trust Department | 12 536 | −5,46 | 569 | 12,48 | ||||
| 2025-08-06 | 13F | Souders Financial Advisors | 302 768 | 6,14 | 13 731 | 26,37 | ||||
| 2025-08-08 | 13F | Maple Capital Management, Inc. | 40 895 | 3,37 | 1 855 | 23,11 | ||||
| 2025-08-12 | 13F | Heritage Trust Co | 49 454 | 33,74 | 2 243 | 59,23 | ||||
| 2025-07-25 | 13F | Cwm, Llc | 93 359 | 25,12 | 4 | 100,00 | ||||
| 2025-08-11 | 13F | John & Kathleen Schreiber Foundation | 111 349 | 0,00 | 5 050 | 19,05 | ||||
| 2025-08-12 | 13F | Bedel Financial Consulting, Inc. | 31 295 | 3,43 | 1 419 | 18,74 | ||||
| 2025-07-02 | 13F | Central Pacific Bank - Trust Division | 168 | 0,00 | 8 | 16,67 | ||||
| 2025-07-10 | 13F | Wealth Enhancement Advisory Services, Llc | 61 952 | 1,47 | 2 826 | 21,55 | ||||
| 2025-07-21 | 13F | DHJJ Financial Advisors, Ltd. | 85 | 0,00 | 4 | 0,00 | ||||
| 2025-07-25 | 13F | Cascade Investment Advisors, Inc. | 6 193 | 7,33 | 281 | 27,85 | ||||
| 2025-08-04 | 13F | NBZ Investment Advisors LLC | 60 764 | 6,94 | 2 756 | 27,31 | ||||
| 2025-08-07 | 13F | Kestra Private Wealth Services, Llc | 7 476 | 1,41 | 339 | 21,07 | ||||
| 2025-07-23 | 13F | Armstrong, Fleming & Moore, Inc | 437 876 | 19 858 | ||||||
| 2025-08-08 | 13F | Capital Investment Advisory Services, LLC | 1 288 | 77,66 | 58 | 114,81 | ||||
| 2025-07-29 | 13F | Fundamentun, Llc | 0 | −100,00 | 0 | |||||
| 2025-08-07 | 13F/A | Ellerson Group Inc /adv | 22 632 | 2,49 | 1 026 | 22,00 | ||||
| 2025-07-31 | 13F | Glass Jacobson Investment Advisors llc | 1 222 | 0,00 | 55 | 7,84 | ||||
| 2025-08-01 | 13F | Equita Financial Network, Inc. | 6 093 | −10,67 | 276 | 6,56 | ||||
| 2025-07-30 | 13F | Atlantic Edge Private Wealth Management, LLC | 652 | 0,00 | 30 | 20,83 | ||||
| 2025-08-19 | 13F | Cape Investment Advisory, Inc. | 248 | 0,00 | 11 | 22,22 | ||||
| 2025-07-11 | 13F | Pinnacle Bancorp, Inc. | 56 | 0,00 | 3 | 0,00 | ||||
| 2025-08-05 | 13F | Sigma Planning Corp | 18 167 | −69,04 | 824 | −63,16 | ||||
| 2025-07-24 | 13F | Capital Advisors, Ltd. LLC | 73 072 | −0,25 | 3 | 50,00 | ||||
| 2025-08-13 | 13F | Marshall Wace, Llp | 19 701 | 893 | ||||||
| 2025-08-18 | 13F | Hershey Financial Advisers, LLC | 9 414 | −24,49 | 427 | −18,86 | ||||
| 2025-07-24 | 13F | Bey-Douglas LLC | 6 849 | 15,85 | 311 | 37,78 | ||||
| 2025-07-25 | 13F | Apollon Wealth Management, LLC | 4 828 | 219 | ||||||
| 2025-07-16 | 13F | Swisher Financial Concepts, Inc. | 18 133 | −6,95 | 822 | 10,78 | ||||
| 2025-08-14 | 13F | Great Valley Advisor Group, Inc. | 6 356 | −19,65 | 288 | −4,32 | ||||
| 2025-08-14 | 13F | Advisor OS, LLC | 181 924 | −19,57 | 8 250 | −4,24 | ||||
| 2025-07-14 | 13F | Lighthouse Wealth Management Inc. | 28 213 | 3,58 | 1 279 | 23,34 | ||||
| 2025-07-11 | 13F | SILVER OAK SECURITIES, Inc | 35 551 | 259,36 | 1 612 | 328,72 | ||||
| 2025-08-12 | 13F | LPL Financial LLC | 40 556 | 21,00 | 1 839 | 44,12 | ||||
| 2025-08-08 | 13F | Comprehensive Financial Planning, Inc./PA | 43 421 | 1,46 | 1 969 | 20,80 | ||||
| 2025-04-30 | 13F | POM Investment Strategies, LLC | 0 | −100,00 | 0 | |||||
| 2025-08-14 | 13F | Cascades Capital Asset Management, LLC | 5 573 | −18,58 | 253 | −3,08 | ||||
| 2025-05-15 | 13F | Gotham Asset Management, LLC | 0 | −100,00 | 0 | −100,00 | ||||
| 2025-08-13 | 13F | Ted Buchan & Co | 30 439 | −2,94 | 1 380 | 15,58 | ||||
| 2025-07-30 | 13F | Cornerstone Advisory, LLC | 5 264 | 239 | ||||||
| 2025-08-06 | 13F | Prospera Financial Services Inc | 7 152 | −89,55 | 324 | −87,56 | ||||
| 2025-09-04 | 13F/A | Advisor Group Holdings, Inc. | 23 418 | −51,70 | 1 062 | −42,52 | ||||
| 2025-07-14 | 13F | Harbor Group, Inc. | 442 912 | 10,17 | 20 086 | 31,17 | ||||
| 2025-08-13 | 13F | Capital Analysts, Inc. | 55 996 | 2,04 | 3 | 0,00 | ||||
| 2025-08-14 | 13F | Royal Bank Of Canada | 56 211 | −13,89 | 2 549 | 2,49 | ||||
| 2025-07-28 | 13F | Harbour Investments, Inc. | 35 177 | 1,36 | 1 595 | 20,74 | ||||
| 2025-08-14 | 13F | First Foundation Advisors | 86 476 | −0,19 | 3 922 | 18,82 | ||||
| 2025-08-18 | 13F/A | National Bank Of Canada /fi/ | 2 155 | 13,12 | 97 | 35,21 | ||||
| 2025-04-25 | 13F | MidAtlantic Capital Management, Inc. | 0 | −100,00 | 0 | |||||
| 2025-08-18 | 13F | Geneos Wealth Management Inc. | 898 | 29,39 | 41 | 53,85 | ||||
| 2025-08-04 | 13F | REDW Wealth LLC | 10 084 | 7,31 | 457 | 28,01 | ||||
| 2025-05-06 | 13F | PFG Advisors | 0 | −100,00 | 0 | −100,00 | ||||
| 2025-08-06 | 13F | Mark Sheptoff Financial Planning, Llc | 200 | 0,00 | 9 | 28,57 | ||||
| 2025-08-14 | 13F | Comerica Bank | 1 000 | 0,00 | 45 | 18,42 | ||||
| 2025-07-09 | 13F | Sapient Capital Llc | 5 723 | 0,00 | 260 | 19,35 | ||||
| 2025-07-21 | 13F | Keystone Financial Group, Inc. | 0 | −100,00 | 0 | |||||
| 2025-08-13 | 13F | Per Stirling Capital Management, LLC. | 8 133 | 0,00 | 369 | 19,09 | ||||
| 2025-08-14 | 13F | Goldman Sachs Group Inc | 7 929 | 360 | ||||||
| 2025-07-24 | 13F | IFP Advisors, Inc | 25 120 | 0,00 | 1 139 | 19,14 | ||||
| 2025-07-25 | 13F | Concord Wealth Partners | 65 | 3 | ||||||
| 2025-07-24 | 13F | Forefront Analytics, LLC | 76 981 | 3 490 | ||||||
| 2025-08-13 | 13F | Dana Investment Advisors, Inc. | 9 916 | 0,00 | 450 | 19,10 | ||||
| 2025-08-11 | 13F | TD Waterhouse Canada Inc. | 4 561 | 192,18 | 202 | 242,37 | ||||
| 2025-08-12 | 13F | Calton & Associates, Inc. | 5 198 | 236 | ||||||
| 2025-08-15 | 13F | Morgan Stanley | 602 | −46,35 | 27 | −35,71 | ||||
| 2025-08-08 | 13F | Sittner & Nelson, Llc | 23 049 | 21,84 | 1 045 | 45,14 | ||||
| 2025-08-11 | 13F | Principal Securities, Inc. | 9 598 | −64,21 | 435 | −61,47 | ||||
| 2025-08-13 | 13F | Northwestern Mutual Wealth Management Co | 1 959 197 | 28,54 | 88 850 | 53,04 | ||||
| 2025-07-23 | 13F | Roundview Capital LLC | 28 740 | 78,11 | 1 303 | 112,21 | ||||
| 2025-08-13 | 13F | M Holdings Securities, Inc. | 10 249 | 0 | ||||||
| 2025-08-08 | 13F | Avantax Advisory Services, Inc. | 4 775 | 217 | ||||||
| 2025-08-12 | 13F | CIBC Private Wealth Group, LLC | 200 | 0,00 | 9 | 50,00 | ||||
| 2025-08-14 | 13F | Empire Life Investments Inc. | 68 100 | 3 092 | ||||||
| 2025-08-14 | 13F | Two Sigma Investments, Lp | 233 900 | 73,00 | 10 607 | 106,00 | ||||
| 2025-08-14 | 13F | Diversify Wealth Management, Llc | 8 985 | 0,00 | 427 | 22,70 | ||||
| 2025-07-24 | 13F | Robertson Stephens Wealth Management, LLC | 13 232 | −86,26 | 600 | −83,64 | ||||
| 2025-08-04 | 13F | Saxony Capital Management, LLC | 5 100 | −12,07 | 231 | 5,00 | ||||
| 2025-07-21 | 13F | Ameritas Advisory Services, LLC | 23 733 | 301,91 | 1 076 | 337,40 | ||||
| 2025-08-14 | 13F | Bank Of America Corp /de/ | 1 585 204 | −5,72 | 71 889 | 12,25 | ||||
| 2025-08-01 | 13F | Envestnet Asset Management Inc | 793 857 | −1,13 | 36 001 | 17,72 | ||||
| 2025-08-13 | 13F/A | Matrix Asset Advisors Inc/ny | 64 641 | 4,05 | 2 931 | 23,88 | ||||
| 2025-07-16 | 13F | Signaturefd, Llc | 1 775 | 0,00 | 80 | 19,40 | ||||
| 2025-08-14 | 13F | Mml Investors Services, Llc | 52 264 | 46,41 | 2 | 100,00 | ||||
| 2025-08-12 | 13F | DiMeo Schneider & Associates, L.L.C. | 19 200 | 871 | ||||||
| 2025-08-13 | 13F | Maia Wealth LLC | 42 251 | 40,40 | 1 916 | 70,31 | ||||
| 2025-08-11 | 13F | Tidemark, LLC | 173 | 0,00 | 8 | 16,67 | ||||
| 2025-08-14 | 13F | Stifel Financial Corp | 95 569 | 2,79 | 4 334 | 22,39 | ||||
| 2025-07-22 | 13F | DAVENPORT & Co LLC | 15 997 | 6,90 | 725 | 27,19 | ||||
| 2025-08-06 | 13F | Commonwealth Equity Services, Llc | 737 938 | 12,00 | 33 | 32,00 | ||||
| 2025-08-14 | 13F | Susquehanna International Group, Llp | 35 518 | −42,45 | 1 611 | −31,49 | ||||
| 2025-08-29 | 13F | Centaurus Financial, Inc. | 0 | −100,00 | 0 | |||||
| 2025-07-16 | 13F | Essex Financial Services, Inc. | 36 809 | 38,93 | 1 669 | 65,41 | ||||
| 2025-07-17 | 13F | Mokosak Advisory Group, LLC | 5 384 | 0,00 | 244 | 19,02 | ||||
| 2025-07-07 | 13F | Trust Co | 1 465 | 0,00 | 66 | 20,00 | ||||
| 2025-08-14 | 13F | Wiley Bros.-aintree Capital, Llc | 18 761 | 851 | ||||||
| 2025-08-08 | 13F | Creative Planning | 73 347 | −53,27 | 3 326 | −44,36 | ||||
| 2025-07-11 | 13F | CMH Wealth Management LLC | 157 427 | −5,81 | 7 139 | 12,14 | ||||
| 2025-07-14 | 13F | Toth Financial Advisory Corp | 14 | 0,00 | 1 | |||||
| 2025-08-05 | 13F | Carolinas Wealth Consulting Llc | 0 | −100,00 | 0 | |||||
| 2025-08-07 | 13F | Allworth Financial LP | 393 | 0,00 | 18 | 13,33 | ||||
| 2025-08-12 | 13F | SRS Capital Advisors, Inc. | 605 | 65,30 | 27 | 107,69 | ||||
| 2025-07-22 | 13F | Wealthcare Advisory Partners LLC | 6 205 | 2,14 | 281 | 21,65 | ||||
| 2025-08-04 | 13F | WNY Asset Management, LLC | 14 683 | −47,86 | 666 | −37,97 | ||||
| 2025-08-08 | 13F | Croban | 76 981 | −3,88 | 3 490 | 14,43 | ||||
| 2025-07-16 | 13F | Stephenson National Bank & Trust | 4 062 | 4,07 | 184 | 24,32 | ||||
| 2025-08-14 | 13F | Benjamin Edwards Inc | 119 614 | 18,72 | 5 424 | 41,36 | ||||
| 2025-08-04 | 13F | Linscomb & Williams, Inc. | 249 386 | 0,32 | 11 310 | 19,44 | ||||
| 2025-08-13 | 13F | Certior Financial Group, Llc | 5 879 | 10,22 | 267 | 31,03 | ||||
| 2025-08-11 | 13F | Aptus Capital Advisors, LLC | 347 | 0,00 | 16 | 15,38 | ||||
| 2025-07-30 | 13F | D.a. Davidson & Co. | 212 216 | −0,74 | 9 624 | 18,18 | ||||
| 2025-08-12 | 13F | Proequities, Inc. | 0 | 0 | ||||||
| 2025-08-12 | 13F | J.w. Cole Advisors, Inc. | 6 333 | 0,00 | 287 | 19,09 | ||||
| 2025-08-12 | 13F | Global Retirement Partners, LLC | 345 | 0,00 | 16 | 7,14 | ||||
| 2025-05-15 | 13F | Citadel Advisors Llc | 0 | −100,00 | 0 | |||||
| 2025-08-11 | 13F | HighTower Advisors, LLC | 10 637 | −0,34 | 482 | 18,72 | ||||
| 2025-08-14 | 13F | Price T Rowe Associates Inc /md/ | 1 250 001 | 0,00 | 57 | 19,15 | ||||
| 2025-08-13 | 13F | Russell Investments Group, Ltd. | 272 | −84,47 | 12 | −81,82 | ||||
| 2025-07-16 | 13F | Spirepoint Private Client, Llc | 0 | −100,00 | 0 | |||||
| 2025-07-18 | 13F | Truist Financial Corp | 80 580 | −0,55 | 3 654 | 18,41 | ||||
| 2025-08-15 | 13F | Kestra Advisory Services, LLC | 42 760 | 23,12 | 1 939 | 46,67 | ||||
| 2025-08-08 | 13F | Mjp Associates Inc /adv | 184 102 | −18,61 | 8 349 | −3,09 | ||||
| 2025-08-07 | 13F | Summit Asset Management, LLC | 56 047 | −3,61 | 2 542 | 14,77 | ||||
| 2025-07-09 | 13F | Massmutual Trust Co Fsb/adv | 65 | 0,00 | 3 | 0,00 | ||||
| 2025-08-11 | 13F | Hopwood Financial Services, Inc. | 99 249 | 4,50 | 4 501 | 24,41 | ||||
| 2025-07-31 | 13F | Cambridge Investment Research Advisors, Inc. | 99 201 | 2,97 | 4 | 33,33 | ||||
| 2025-07-21 | 13F | Trust Co of Kansas | 935 625 | 12,25 | 42 | 35,48 |