Grundläggande statistik
| Institutionella ägare | 235 total, 233 long only, 0 short only, 2 long/short - change of 21,76% MRQ |
| Genomsnittlig portföljallokering | 0.2755 % - change of −1,12% MRQ |
| Institutionella aktier (lång) | 11 782 408 (ex 13D/G) - change of 2,70MM shares 29,76% MRQ |
| Institutionellt värde (lång) | $ 570 597 USD ($1000) |
Institutionellt ägande och aktieägare
NEOS ETF Trust - NEOS S&P 500 High Income ETF (US:SPYI) har 235 Institutionella ägare och aktieägare som har lämnat in 13D/G- eller 13F-formulär till Securities Exchange Commission (SEC). Dessa institut innehar totalt 11,782,408 aktier. Största aktieägare inkluderar LPL Financial LLC, Gradient Investments LLC, Stifel Financial Corp, UBS Group AG, Private Advisor Group, LLC, Second Half Financial Partners, LLC, Cascade Wealth Advisors, Inc, Mml Investors Services, Llc, Two Sigma Investments, Lp, and International Assets Investment Management, Llc .
NEOS ETF Trust - NEOS S&P 500 High Income ETF (BATS:SPYI) Institutionell ägarstruktur visar institutioners och fonders nuvarande positioner i företaget, samt de senaste förändringarna i positionernas storlek. Större aktieägare kan vara enskilda investerare, fonder, hedgefonder eller institutioner. Bilaga 13D visar att investeraren äger (eller ägde) mer än 5% av företaget och avser (eller avsåg) att aktivt eftersträva en förändring av affärsstrategin. Schedule 13G indikerar en passiv investering på över 5%.
The share price as of September 12, 2025 is 52,22 / share. Previously, on September 13, 2024, the share price was 50,81 / share. This represents an increase of 2,77% over that period.

Fondsentimentets poäng
Fondsentimentet poängen(fka Ägarackumulation-poäng) visar vilka aktier som är mest köpta av fonder. Det är resultatet av en sofistikerad kvantitativ flerfaktormodell som identifierar företag med de högsta nivåerna av institutionell ackumulering. Poängsättningsmodellen använder en kombination av den totala ökningen av redovisade ägare, förändringarna i portföljallokeringarna för dessa ägare och andra mått. Siffran sträcker sig från 0 till 100, där högre siffror indikerar en högre nivå av ackumulering i förhållande till sina konkurrenter, och 50 är genomsnittet.
Uppdateringsfrekvens: Dagligen
Se Ownership Explorer, som innehåller en lista över de högst rankade företagen.
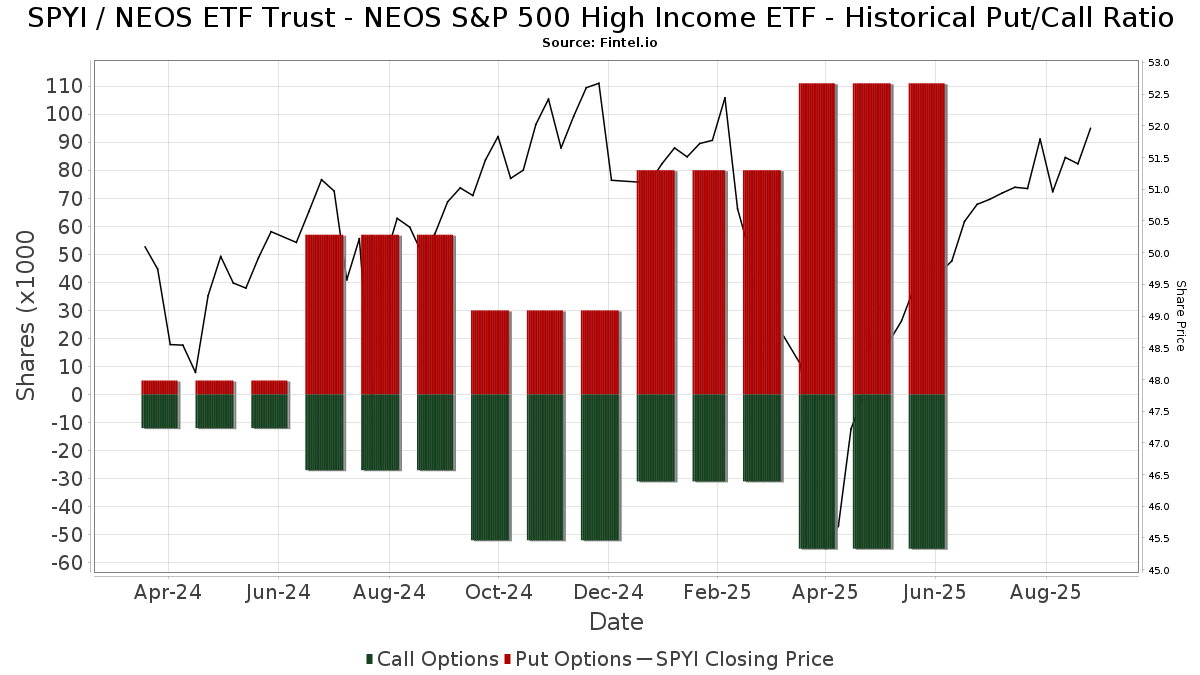
Institutionell sälj/köp-kvot
Förutom att rapportera vanliga eget kapital- och skuldemissioner måste institutioner med mer än 100MM tillgångar under förvaltning också avslöja sina innehav av sälj- och köpoptioner. Eftersom säljoptioner i allmänhet indikerar ett negativt sentiment och köpoptioner indikerar ett positivt sentiment, kan vi få en uppfattning om det övergripande institutionella sentimentet genom att plotta förhållandet mellan säljoptioner och köpoptioner. Diagrammet till höger visar det historiska förhållandet mellan sälj- och köpoptioner för detta instrument.
Genom att använda sälj/köp-kvoten som en indikator på aktieägarnas sentiment undviker man en av de största bristerna med att använda det totala institutionella ägandet, nämligen att en betydande del av de förvaltade tillgångarna investeras passivt för att följa index. Passivt förvaltade fonder köper vanligtvis inte optioner, så indikatorn för sälj/köp-kvoten ger en bättre bild av stämningen i aktivt förvaltade fonder.
13F- och NPORT-arkiveringar
Detaljer om 13F-arkiveringar är gratis. Detaljer om NP-arkiveringar kräver ett premiummedlemskap. Gröna rader indikerar nya positioner. Röda rader indikerar stängda positioner. Klicka på länk symbolen för att se hela transaktionshistoriken.
Uppgradera
för att låsa upp premiumdata och exportera till Excel ![]() .
.
| Fil Datum | Källa | Investerare | Typ | Genomsnittligt pris (beräknat) |
Aktier | Δ Aktier (%) |
Rapporterat värde (1000 USD) |
Δ Värde (%) |
Portföljallokering (%) |
|
|---|---|---|---|---|---|---|---|---|---|---|
| 2025-07-15 | 13F | MCF Advisors LLC | 4 964 | 1,97 | 250 | 6,87 | ||||
| 2025-08-04 | 13F | Atria Investments Llc | 8 681 | 82,14 | 437 | 91,23 | ||||
| 2025-07-24 | 13F | PDS Planning, Inc | 24 805 | 11,32 | 1 248 | 16,96 | ||||
| 2025-07-24 | 13F | IFP Advisors, Inc | 13 003 | −4,07 | 654 | 0,77 | ||||
| 2025-07-31 | 13F | Guardian Financial Partners, LLC | 52 401 | 6,02 | 2 637 | 11,36 | ||||
| 2025-07-31 | 13F | Gill Capital Partners, Llc | 4 325 | 218 | ||||||
| 2025-08-27 | 13F/A | Brinker Capital Investments, LLC | 90 042 | 6,55 | 4 531 | 11,96 | ||||
| 2025-08-13 | 13F | EverSource Wealth Advisors, LLC | 1 800 | 91 | ||||||
| 2025-07-11 | 13F | Seacrest Wealth Management, Llc | 9 336 | 470 | ||||||
| 2025-07-28 | 13F | Harbour Investments, Inc. | 15 911 | −6,69 | 801 | −1,96 | ||||
| 2025-08-08 | 13F | Capital Investment Advisory Services, LLC | 71 825 | 63,80 | 3 614 | 72,18 | ||||
| 2025-08-05 | 13F | Strategic Financial Concepts, LLC | 5 120 | 248 | ||||||
| 2025-07-31 | 13F | Buckingham Strategic Partners | 0 | −100,00 | 0 | |||||
| 2025-08-14 | 13F | Raymond James Financial Inc | 15 596 | 785 | ||||||
| 2025-08-14 | 13F | Citadel Advisors Llc | Put | 89 900 | 36,63 | 4 524 | 43,54 | |||
| 2025-08-01 | 13F | Brookwood Investment Group LLC | 10 974 | 47,16 | 552 | 54,62 | ||||
| 2025-08-04 | 13F | Roble, Belko & Company, Inc | 185 | 128,40 | 0 | |||||
| 2025-08-05 | 13F | Bank of New York Mellon Corp | 8 740 | 440 | ||||||
| 2025-08-05 | 13F | Claro Advisors LLC | 16 918 | −39,42 | 851 | −36,35 | ||||
| 2025-07-21 | 13F | Triad Wealth Partners, LLC | 7 787 | 392 | ||||||
| 2025-08-14 | 13F | Banco BTG Pactual S.A. | 0 | −100,00 | 0 | |||||
| 2025-07-15 | 13F | World Equity Group, Inc. | 14 941 | 132,76 | 752 | 144,63 | ||||
| 2025-08-14 | 13F | Citadel Advisors Llc | Call | 43 400 | 36,91 | 2 184 | 43,81 | |||
| 2025-07-30 | 13F | Bogart Wealth, LLC | 26 | 1 | ||||||
| 2025-08-06 | 13F | Commonwealth Equity Services, Llc | 84 600 | −5,74 | 4 | 0,00 | ||||
| 2025-08-13 | 13F | Gateway Wealth Partners, LLC | 4 830 | 243 | ||||||
| 2025-08-14 | 13F | Citadel Advisors Llc | 77 138 | 68,30 | 3 882 | 76,89 | ||||
| 2025-07-29 | 13F | Mattson Financial Services, LLC | 113 215 | 0,47 | 5 697 | 5,56 | ||||
| 2025-08-14 | 13F | Stifel Financial Corp | 567 247 | 3,90 | 28 544 | 9,17 | ||||
| 2025-07-08 | 13F | Parallel Advisors, LLC | 1 524 | 77 | ||||||
| 2025-08-13 | 13F | Continuum Advisory, LLC | 0 | −100,00 | 0 | |||||
| 2025-09-11 | 13F | Silicon Valley Capital Partners | 105 | 2,94 | 5 | 25,00 | ||||
| 2025-08-13 | 13F | Cary Street Partners Financial Llc | 10 258 | −34,59 | 516 | −31,29 | ||||
| 2025-07-25 | 13F | Alpha Financial Partners, LLC | 10 101 | 508 | ||||||
| 2025-07-25 | 13F | Cwm, Llc | 3 871 | 54,22 | 0 | |||||
| 2025-08-13 | 13F | Level Four Advisory Services, Llc | 20 596 | 1 036 | ||||||
| 2025-08-11 | 13F | Cornerstone Planning Group LLC | 30 | 2 | ||||||
| 2025-07-18 | 13F | Truist Financial Corp | 24 377 | 22,69 | 1 227 | 28,92 | ||||
| 2025-05-14 | 13F | Napa Wealth Management | 0 | −100,00 | 0 | |||||
| 2025-07-25 | 13F | Astoria Portfolio Advisors LLC. | 27 263 | 100,08 | 1 389 | 123,31 | ||||
| 2025-08-18 | 13F | Geneos Wealth Management Inc. | 412 | 312,00 | 21 | 400,00 | ||||
| 2025-05-15 | 13F | Tower Research Capital LLC (TRC) | 0 | −100,00 | 0 | |||||
| 2025-07-17 | 13F | Robbins Farley Llc | 2 | 0,00 | 0 | |||||
| 2025-08-08 | 13F | Crossmark Global Holdings, Inc. | 12 212 | 4,72 | 615 | 10,04 | ||||
| 2025-08-19 | 13F | Newbridge Financial Services Group, Inc. | 60 639 | 7,98 | 3 051 | 13,46 | ||||
| 2025-08-13 | 13F | SCS Capital Management LLC | 0 | −100,00 | 0 | |||||
| 2025-07-29 | 13F | International Assets Investment Management, Llc | 164 380 | 5,87 | 8 272 | 11,24 | ||||
| 2025-05-15 | 13F | Old Mission Capital Llc | 0 | −100,00 | 0 | |||||
| 2025-08-05 | 13F | Centennial Bank/AR/ | 19 289 | 71,06 | 971 | 79,63 | ||||
| 2025-07-25 | 13F | Apollon Wealth Management, LLC | 45 002 | 45,29 | 2 265 | 52,66 | ||||
| 2025-07-28 | 13F | Mutual Advisors, LLC | 39 217 | 8,30 | 2 003 | 17,89 | ||||
| 2025-07-15 | 13F | StoneCrest Wealth Management, Inc. | 79 321 | 3 991 | ||||||
| 2025-07-23 | 13F | RiverTree Advisors, LLC | 103 203 | 172,15 | 5 193 | 185,96 | ||||
| 2025-08-12 | 13F | Coston, McIsaac & Partners | 5 | 0 | ||||||
| 2025-07-29 | 13F | Stephens Inc /ar/ | 0 | −100,00 | 0 | |||||
| 2025-07-21 | 13F | HighMark Wealth Management LLC | 4 101 | 4 613,79 | 206 | 5 050,00 | ||||
| 2025-08-18 | 13F | Tactive Advisors, LLC | 15 257 | 768 | ||||||
| 2025-08-07 | 13F | American Alpha Advisors, LLC | 0 | −100,00 | 0 | |||||
| 2025-08-11 | 13F | Independent Advisor Alliance | 47 704 | −28,15 | 2 400 | −24,50 | ||||
| 2025-07-22 | 13F | Willner & Heller, Llc | 4 202 | −57,29 | 211 | −55,20 | ||||
| 2025-08-13 | 13F | Financial & Tax Architects, LLC | 6 378 | 321 | ||||||
| 2025-07-14 | 13F | Armstrong Advisory Group, Inc | 249 | 0,00 | 13 | 0,00 | ||||
| 2025-08-13 | 13F | Lido Advisors, LLC | 4 518 | 227 | ||||||
| 2025-08-14 | 13F | Quartz Partners, LLC | 5 869 | −17,67 | 295 | −13,49 | ||||
| 2025-07-09 | 13F | Reyes Financial Architecture, Inc. | 17 281 | 39,83 | 870 | 47,04 | ||||
| 2025-08-14 | 13F | Mariner, LLC | 36 545 | 28,68 | 1 839 | 35,15 | ||||
| 2025-07-10 | 13F | Capital Advisory Group Advisory Services, LLC | 19 990 | 1 006 | ||||||
| 2025-04-17 | 13F | Dynamic Advisor Solutions LLC | 0 | −100,00 | 0 | |||||
| 2025-07-31 | 13F | Moloney Securities Asset Management, LLC | 33 988 | 25,26 | 1 710 | 31,64 | ||||
| 2025-07-22 | 13F | Chung Wu Investment Group, LLC | 300 | 15 | ||||||
| 2025-08-01 | 13F | Pasadena Private Wealth, LLC | 4 970 | 17,49 | 250 | 23,76 | ||||
| 2025-08-14 | 13F | Great Valley Advisor Group, Inc. | 12 858 | 9,72 | 647 | 15,33 | ||||
| 2025-08-07 | 13F | Montag A & Associates Inc | 4 592 | 43,41 | 231 | 50,98 | ||||
| 2025-08-15 | 13F | Northeast Financial Consultants Inc | 10 944 | 0,00 | 551 | 4,96 | ||||
| 2025-07-30 | 13F | Brookstone Capital Management | 14 129 | 165,33 | 711 | 178,43 | ||||
| 2025-08-04 | 13F | IFG Advisory, LLC | 65 023 | 29,31 | 3 272 | 35,84 | ||||
| 2025-07-21 | 13F | Ameritas Advisory Services, LLC | 8 217 | 4,61 | 413 | 4,29 | ||||
| 2025-07-25 | 13F | Second Half Financial Partners, LLC | 409 806 | 0,59 | 20 621 | 5,69 | ||||
| 2025-07-09 | 13F | Triumph Capital Management | 16 547 | −3,26 | 833 | 1,59 | ||||
| 2025-08-04 | 13F | ELCO Management Co., LLC | 10 125 | 5,19 | 509 | 10,65 | ||||
| 2025-08-13 | 13F | Northwestern Mutual Wealth Management Co | 42 648 | 291,30 | 2 146 | 311,90 | ||||
| 2025-08-14 | 13F | Comerica Bank | 2 539 | 128 | ||||||
| 2025-05-01 | 13F | Grant/GrossMendelsohn, LLC | 10 616 | 40,50 | 499 | 29,69 | ||||
| 2025-08-12 | 13F | MAI Capital Management | 650 | 0,00 | 33 | 3,23 | ||||
| 2025-07-25 | 13F | Envestnet Portfolio Solutions, Inc. | 0 | −100,00 | 0 | |||||
| 2025-08-08 | 13F | Avantax Advisory Services, Inc. | 50 376 | 39,55 | 2 535 | 46,64 | ||||
| 2025-08-14 | 13F | Scientech Research LLC | 5 774 | 291 | ||||||
| 2025-04-24 | 13F | Decker Retirement Planning Inc. | 0 | −100,00 | 0 | |||||
| 2025-05-15 | 13F | Talon Private Wealth, LLC | 0 | −100,00 | 0 | −100,00 | ||||
| 2025-07-31 | 13F | Oppenheimer & Co Inc | 27 465 | 1 382 | ||||||
| 2025-04-28 | 13F | Defender Capital, LLC. | 0 | −100,00 | 0 | |||||
| 2025-08-14 | 13F | Ausdal Financial Partners, Inc. | 147 662 | 41,33 | 7 430 | 48,51 | ||||
| 2025-08-14 | 13F | CoreCap Advisors, LLC | 15 867 | 13,53 | 798 | 19,28 | ||||
| 2025-08-14 | 13F | Atomi Financial Group, Inc. | 19 780 | 189,10 | 995 | 204,28 | ||||
| 2025-07-30 | 13F | Crewe Advisors LLC | 25 | 0,00 | 1 | 0,00 | ||||
| 2025-07-31 | 13F | CAP Partners, LLC | 25 394 | 4,01 | 1 278 | 9,24 | ||||
| 2025-08-13 | 13F | VestGen Advisors, LLC | 6 769 | 341 | ||||||
| 2025-08-14 | 13F | Royal Bank Of Canada | 163 595 | 163,08 | 8 233 | 176,46 | ||||
| 2025-07-22 | 13F | DAVENPORT & Co LLC | 5 700 | −24,00 | 287 | −20,33 | ||||
| 2025-08-05 | 13F | Tme Financial, Inc. | 7 184 | 3,09 | 361 | 8,41 | ||||
| 2025-07-14 | 13F | U.S. Capital Wealth Advisors, LLC | 37 212 | 0,13 | 1 873 | 5,23 | ||||
| 2025-08-11 | 13F | Anfield Capital Management, LLC | 1 086 | 0,00 | 55 | 3,85 | ||||
| 2025-08-11 | 13F | NewEdge Wealth, LLC | 12 753 | 0,00 | 650 | 6,56 | ||||
| 2025-05-15 | 13F | EP Wealth Advisors, Inc. | 0 | −100,00 | 0 | |||||
| 2025-08-12 | 13F | Gladstone Institutional Advisory LLC | 5 911 | −74,55 | 297 | −73,29 | ||||
| 2025-08-15 | 13F | Equitable Holdings, Inc. | 9 428 | 474 | ||||||
| 2025-08-04 | 13F | Arkadios Wealth Advisors | 8 966 | 75,56 | 451 | 84,84 | ||||
| 2025-07-22 | 13F | MBL Wealth, LLC | 14 000 | 180,00 | 704 | 194,56 | ||||
| 2025-08-14 | 13F | Garden State Investment Advisory Services LLC | 50 519 | 672,58 | 2 542 | 712,14 | ||||
| 2025-07-10 | 13F | High Net Worth Advisory Group LLC | 53 838 | 6,24 | 2 709 | 11,67 | ||||
| 2025-07-29 | 13F | Stratos Wealth Partners, LTD. | 93 828 | 33,41 | 4 721 | 40,17 | ||||
| 2025-08-01 | 13F | Ashton Thomas Private Wealth, LLC | 4 146 | 209 | ||||||
| 2025-07-23 | 13F | MADDEN SECURITIES Corp | 116 020 | 59,18 | 5 838 | 67,28 | ||||
| 2025-08-11 | 13F | Pin Oak Investment Advisors Inc | 75 | 0,00 | 0 | |||||
| 2025-08-11 | 13F | Perennial Investment Advisors, LLC | 47 252 | 787,03 | 2 378 | 832,16 | ||||
| 2025-07-28 | 13F | Naviter Wealth, LLC | 5 325 | −8,74 | 268 | −3,61 | ||||
| 2025-07-29 | 13F | Fundamentun, Llc | 11 282 | 568 | ||||||
| 2025-07-09 | 13F | Westbourne Investments, Inc. | 9 220 | −6,35 | 464 | −1,70 | ||||
| 2025-08-14 | 13F | Money Concepts Capital Corp | 10 248 | 1,59 | 516 | 6,63 | ||||
| 2025-07-10 | 13F | Tompkins Financial Corp | 1 062 | 53 | ||||||
| 2025-08-05 | 13F | Milestone Asset Management, Llc | 24 157 | 56,20 | 1 216 | 64,19 | ||||
| 2025-08-14 | 13F | Snowden Capital Advisors LLC | 28 124 | 357,67 | 1 415 | 381,29 | ||||
| 2025-08-08 | 13F | Cetera Investment Advisers | 143 390 | 20,87 | 7 215 | 27,00 | ||||
| 2025-09-04 | 13F/A | Advisor Group Holdings, Inc. | 45 759 | 24,02 | 2 303 | 30,28 | ||||
| 2025-08-12 | 13F | Proequities, Inc. | 0 | 0 | ||||||
| 2025-08-15 | 13F | Semmax Financial Advisors Inc. | 2 136 | 0,00 | 110 | 6,86 | ||||
| 2025-07-08 | 13F | Paladin Wealth, LLC | 32 238 | 3,21 | 1 622 | 8,49 | ||||
| 2025-08-11 | 13F | HighTower Advisors, LLC | 41 105 | 17,74 | 2 068 | 23,76 | ||||
| 2025-07-31 | 13F | Oppenheimer Asset Management Inc. | 12 675 | 9,37 | 638 | 14,98 | ||||
| 2025-07-24 | 13F | Leo Wealth, LLC | 9 799 | 493 | ||||||
| 2025-04-29 | 13F | Raleigh Capital Management Inc. | 0 | −100,00 | 0 | |||||
| 2025-08-12 | 13F | Weaver Consulting Group | 5 373 | −66,15 | 270 | −64,47 | ||||
| 2025-07-24 | 13F | Us Bancorp \de\ | 2 505 | −64,21 | 126 | −62,39 | ||||
| 2025-08-13 | 13F | Grantvest Financial Group LLC | 29 367 | 14,24 | 1 478 | 19,98 | ||||
| 2025-07-11 | 13F | SILVER OAK SECURITIES, Inc | 6 846 | −1,25 | 344 | 4,24 | ||||
| 2025-08-07 | 13F | Allworth Financial LP | 10 872 | 272,07 | 547 | 302,21 | ||||
| 2025-08-08 | 13F | Kingsview Wealth Management, LLC | 22 058 | 104,09 | 1 110 | 114,51 | ||||
| 2025-07-07 | 13F | Teamwork Financial Advisors, LLC | 88 212 | 4 439 | ||||||
| 2025-07-22 | 13F | Unique Wealth, Llc | 37 898 | −6,16 | 1 907 | −1,40 | ||||
| 2025-08-05 | 13F | GHP Investment Advisors, Inc. | 2 013 | 26,44 | 101 | 32,89 | ||||
| 2025-08-11 | 13F | Novak & Powell Financial Services, Inc. | 7 157 | 7,56 | 360 | 13,21 | ||||
| 2025-08-14 | 13F | UBS Group AG | 448 139 | 253,87 | 22 550 | 271,87 | ||||
| 2025-08-14 | 13F | IHT Wealth Management, LLC | 21 160 | 58,53 | 1 065 | 66,51 | ||||
| 2025-08-08 | 13F | Intrua Financial, LLC | 19 078 | 76,84 | 960 | 86,05 | ||||
| 2025-07-17 | 13F | CWA Asset Management Group, LLC | 6 798 | 342 | ||||||
| 2025-08-14 | 13F | Diversify Wealth Management, Llc | 18 971 | 11,84 | 980 | 22,35 | ||||
| 2025-08-05 | 13F | Carolinas Wealth Consulting Llc | 0 | −100,00 | 0 | −100,00 | ||||
| 2025-05-14 | 13F | Ameriprise Financial Inc | 0 | −100,00 | 0 | −100,00 | ||||
| 2025-08-12 | 13F | Jpmorgan Chase & Co | 476 | −89,93 | 24 | −89,82 | ||||
| 2025-07-23 | 13F | Gainplan LLC | 39 477 | 9,62 | 1 986 | 15,20 | ||||
| 2025-08-13 | 13F | Jump Financial, LLC | 22 492 | 1 132 | ||||||
| 2025-08-11 | 13F | Cascade Wealth Advisors, Inc | 367 420 | 38,00 | 18 860 | 52,89 | ||||
| 2025-07-23 | 13F | Kingswood Wealth Advisors, Llc | 12 107 | 11,36 | 609 | 17,12 | ||||
| 2025-08-13 | 13F/A | Claudia M.p. Batlle, Crp (r) Llc | 16 224 | 5,65 | 816 | 11,02 | ||||
| 2025-08-15 | 13F | Morgan Stanley | 5 647 | 53,08 | 284 | 61,36 | ||||
| 2025-07-16 | 13F | Brown, Lisle/cummings, Inc. | 29 175 | 2,46 | 1 468 | 7,70 | ||||
| 2025-07-16 | 13F | Spinnaker Investment Group, LLC | 8 651 | 435 | ||||||
| 2025-08-15 | 13F | CI Private Wealth, LLC | 25 548 | 1 286 | ||||||
| 2025-07-17 | 13F | Janney Montgomery Scott LLC | 7 503 | −55,10 | 0 | |||||
| 2025-08-11 | 13F | Private Advisor Group, LLC | 426 424 | 13,15 | 21 458 | 18,89 | ||||
| 2025-07-23 | 13F | Abel Hall, LLC | 5 000 | 252 | ||||||
| 2025-08-11 | 13F | Nations Financial Group Inc, /ia/ /adv | 62 305 | 707,06 | 3 135 | 749,59 | ||||
| 2025-08-12 | 13F | BlackRock, Inc. | 3 171 | 24,60 | 160 | 31,40 | ||||
| 2025-07-29 | 13F | Activest Wealth Management | 387 | 2,93 | 19 | 5,56 | ||||
| 2025-08-04 | 13F | Creative Financial Designs Inc /adv | 922 | −16,18 | 46 | −11,54 | ||||
| 2025-08-07 | 13F | PFG Advisors | 6 739 | 10,33 | 339 | 16,10 | ||||
| 2025-08-04 | 13F | Spire Wealth Management | 0 | −100,00 | 0 | |||||
| 2025-08-01 | 13F | Gwn Securities Inc. | 0 | −100,00 | 0 | |||||
| 2025-08-14 | 13F | MGB Wealth Management, LLC | 2 502 | 126 | ||||||
| 2025-08-07 | 13F | Readystate Asset Management Lp | 98 496 | 4 956 | ||||||
| 2025-08-12 | 13F | Cornerstone Wealth Management, LLC | 10 626 | 535 | ||||||
| 2025-08-18 | 13F | Wolverine Trading, Llc | Put | 21 900 | 52,08 | 1 100 | 60,58 | |||
| 2025-08-18 | 13F | Wolverine Trading, Llc | Call | 11 600 | 583 | |||||
| 2025-08-12 | 13F | Coldstream Capital Management Inc | 0 | −100,00 | 0 | |||||
| 2025-08-14 | 13F | Arete Wealth Advisors, LLC | 35 714 | 110,37 | 2 | |||||
| 2025-07-08 | 13F | Gradient Investments LLC | 1 668 983 | 1,63 | 83 983 | 6,79 | ||||
| 2025-08-13 | 13F | Crescent Grove Advisors, LLC | 0 | −100,00 | 0 | |||||
| 2025-07-21 | 13F | DHJJ Financial Advisors, Ltd. | 37 | 0,00 | 2 | 0,00 | ||||
| 2025-07-15 | 13F | Sheets Smith Wealth Management | 22 005 | 0,00 | 1 107 | 5,13 | ||||
| 2025-08-01 | 13F | Chilton Capital Management Llc | 250 | 0,00 | 13 | 9,09 | ||||
| 2025-08-11 | 13F | TD Waterhouse Canada Inc. | 0 | −100,00 | 0 | |||||
| 2025-08-13 | 13F | Twin Peaks Wealth Advisors, LLC | 133 | 7 | ||||||
| 2025-08-14 | 13F | Federation des caisses Desjardins du Quebec | 20 | 0,00 | 1 | |||||
| 2025-08-14 | 13F | Sunbelt Securities, Inc. | 85 | 0,00 | 4 | 0,00 | ||||
| 2025-07-14 | 13F | Palacios Wealth Management, LLC | 63 960 | 12,09 | 3 218 | 17,79 | ||||
| 2025-08-01 | 13F | Facet Wealth, Inc. | 5 016 | 255 | ||||||
| 2025-08-04 | 13F | Assetmark, Inc | 339 | 17 | ||||||
| 2025-07-25 | 13F | Atria Wealth Solutions, Inc. | 22 606 | −50,39 | 1 141 | −47,75 | ||||
| 2025-08-18 | 13F | Front Row Advisors LLC | 66 | 3 | ||||||
| 2025-07-29 | 13F | Latitude Advisors, LLC | 13 437 | 123,35 | 676 | 134,72 | ||||
| 2025-07-15 | 13F | BCS Wealth Management | 7 590 | 0 | ||||||
| 2025-08-14 | 13F/A | Rockefeller Capital Management L.P. | 40 963 | −13,45 | 2 061 | −9,05 | ||||
| 2025-08-07 | 13F | Bradley & Co. Private Wealth Management, LLC | 1 | 0,00 | 0 | |||||
| 2025-09-02 | 13F | Pvg Asset Management Corp | 13 163 | 662 | ||||||
| 2025-07-10 | 13F | Wealth Enhancement Advisory Services, Llc | 88 317 | 22,58 | 4 482 | 29,91 | ||||
| 2025-07-21 | 13F | Mirae Asset Global Investments Co., Ltd. | 14 000 | 0,00 | 704 | 5,71 | ||||
| 2025-07-16 | 13F | Owen LaRue, LLC | 41 151 | 10,14 | 2 071 | 15,71 | ||||
| 2025-07-11 | 13F/A | Umb Bank N A/mo | 2 016 | 101 | ||||||
| 2025-08-01 | 13F | FSA Advisors, Inc. | 35 442 | 70,06 | 1 783 | 78,66 | ||||
| 2025-07-21 | 13F | Capital Planning LLC | 14 793 | 744 | ||||||
| 2025-08-11 | 13F | Principal Securities, Inc. | 20 | −94,38 | 1 | −94,44 | ||||
| 2025-08-13 | 13F | WCG Wealth Advisors LLC | 13 905 | 700 | ||||||
| 2025-07-31 | 13F | Cambridge Investment Research Advisors, Inc. | 76 211 | −17,69 | 4 | −25,00 | ||||
| 2025-08-18 | 13F | Wolverine Trading, Llc | 0 | −100,00 | 0 | −100,00 | ||||
| 2025-08-13 | 13F | Renaissance Technologies Llc | 103 700 | 289,85 | 5 218 | 309,90 | ||||
| 2025-08-14 | 13F | Mml Investors Services, Llc | 230 323 | 11,56 | 12 | 22,22 | ||||
| 2025-08-07 | 13F | Traynor Capital Management, Inc. | 4 397 | −1,43 | 221 | 3,76 | ||||
| 2025-05-15 | 13F/A | Orion Portfolio Solutions, LLC | 84 505 | 4,32 | 4 047 | −1,70 | ||||
| 2025-08-12 | 13F | LPL Financial LLC | 1 821 981 | 41,19 | 91 682 | 48,35 | ||||
| 2025-08-15 | 13F | Captrust Financial Advisors | 7 702 | 388 | ||||||
| 2025-07-09 | 13F | Key Client Fiduciary Advisors, LLC | 18 164 | 2,04 | 914 | 7,28 | ||||
| 2025-08-04 | 13F | Flagship Harbor Advisors, Llc | 9 541 | 3,62 | 480 | 9,09 | ||||
| 2025-08-08 | 13F | Foundations Investment Advisors, LLC | 4 594 | 231 | ||||||
| 2025-07-29 | 13F | Private Trust Co Na | 7 160 | 24,22 | 360 | 30,43 | ||||
| 2025-08-13 | 13F | Baird Financial Group, Inc. | 14 000 | 704 | ||||||
| 2025-08-13 | 13F | Smith, Moore & Co. | 48 176 | −15,96 | 2 424 | −11,69 | ||||
| 2025-08-14 | 13F | Susquehanna International Group, Llp | 0 | −100,00 | 0 | |||||
| 2025-07-10 | 13F | Signal Advisors Wealth, LLC | 12 003 | 604 | ||||||
| 2025-08-15 | 13F | Kestra Advisory Services, LLC | 157 902 | 116,74 | 7 946 | 127,78 | ||||
| 2025-08-06 | 13F | Walkner Condon Financial Advisors LLC | 6 865 | 41,11 | 345 | 48,71 | ||||
| 2025-07-10 | 13F | Fortress Wealth Management, Inc. | 26 474 | 0,33 | 1 332 | 5,46 | ||||
| 2025-07-21 | 13F | Patriot Financial Group Insurance Agency, LLC | 4 413 | 1,68 | 222 | 7,25 | ||||
| 2025-08-11 | 13F | Aptus Capital Advisors, LLC | 40 970 | 18,97 | 2 062 | 24,98 | ||||
| 2025-08-14 | 13F | Wiley Bros.-aintree Capital, Llc | 5 103 | 257 | ||||||
| 2025-07-29 | 13F | Stratos Wealth Advisors, LLC | 30 503 | 1,04 | 1 535 | 6,16 | ||||
| 2025-07-22 | 13F | Steele Capital Management, Inc. | 92 860 | 14,08 | 4 673 | 19,86 | ||||
| 2025-08-12 | 13F | J.w. Cole Advisors, Inc. | 27 719 | 313,84 | 1 395 | 335,63 | ||||
| 2025-07-28 | 13F | RFG Advisory, LLC | 38 675 | −13,91 | 1 946 | −9,53 | ||||
| 2025-08-13 | 13F | Brown Advisory Inc | 9 750 | 0,02 | 491 | 5,15 | ||||
| 2025-08-14 | 13F | GWM Advisors LLC | 4 230 | 106,54 | 213 | 116,33 | ||||
| 2025-08-01 | 13F | Vision Financial Markets Llc | 884 | 3,03 | 44 | 7,32 | ||||
| 2025-07-17 | 13F | Lee Johnson Capital Management, Llc | 0 | −100,00 | 0 | |||||
| 2025-08-12 | 13F | Global Retirement Partners, LLC | 688 | 421,21 | 35 | 466,67 | ||||
| 2025-07-24 | 13F | Cascade Investment Group, Inc. | 37 045 | 0,01 | 1 864 | 5,13 | ||||
| 2025-07-24 | 13F | Game Plan Financial Advisors, LLC | 200 | 10 | ||||||
| 2025-08-12 | 13F | BlueStem Wealth Partners, LLC | 21 358 | 1 075 | ||||||
| 2025-08-14 | 13F | Camarda Financial Advisors, LLC | 13 999 | 6,33 | 704 | 11,75 | ||||
| 2025-08-12 | 13F | Insigneo Advisory Services, Llc | 0 | −100,00 | 0 | |||||
| 2025-08-08 | 13F | Pnc Financial Services Group, Inc. | 11 715 | 4,46 | 589 | 9,68 | ||||
| 2025-04-22 | 13F | Castleview Partners, Llc | 0 | −100,00 | 0 | |||||
| 2025-07-31 | 13F | City State Bank | 2 000 | 100,00 | 101 | 112,77 | ||||
| 2025-07-25 | 13F | Concurrent Investment Advisors, LLC | 9 306 | 468 | ||||||
| 2025-07-14 | 13F | Pacifica Partners Inc. | 221 | 0,00 | 11 | 10,00 | ||||
| 2025-08-13 | 13F | Legacy Capital Wealth Partners, LLC | 29 190 | 1 469 | ||||||
| 2025-08-14 | 13F | Wells Fargo & Company/mn | 694 | 129,80 | 35 | 142,86 | ||||
| 2025-08-15 | 13F | Brown Financial Advisors | 120 855 | −1,76 | 6 081 | 3,23 | ||||
| 2025-08-01 | 13F | Delta Investment Management, LLC | 77 506 | 4,75 | 3 900 | 10,08 | ||||
| 2025-07-23 | 13F | Heck Capital Advisors, LLC | 16 276 | −0,04 | 819 | 5,13 | ||||
| 2025-07-31 | 13F | FSM Wealth Advisors, LLC | 6 466 | 327 | ||||||
| 2025-08-06 | 13F | AE Wealth Management LLC | 2 249 | −15,42 | 113 | −11,02 | ||||
| 2025-08-14 | 13F | Jupiter Wealth Management LLC | 17 999 | −5,26 | 932 | −1,17 | ||||
| 2025-05-05 | 13F | Hollencrest Capital Management | 0 | −100,00 | 0 | −100,00 | ||||
| 2025-08-01 | 13F | Envestnet Asset Management Inc | 85 890 | 110,15 | 4 322 | 120,80 | ||||
| 2025-08-14 | 13F | Murphy & Mullick Capital Management Corp | 200 | 10 | ||||||
| 2025-07-18 | 13F | PFG Investments, LLC | 64 799 | 17,40 | 3 261 | 23,34 | ||||
| 2025-07-22 | 13F | Foguth Wealth Management, LLC. | 5 638 | 284 | ||||||
| 2025-07-31 | 13F | 3EDGE Asset Management, LP | 0 | −100,00 | 0 | |||||
| 2025-08-14 | 13F | Integrated Wealth Concepts LLC | 29 085 | 170,58 | 1 464 | 184,63 | ||||
| 2025-05-16 | 13F | Coppell Advisory Solutions LLC | 0 | −100,00 | 0 | |||||
| 2025-08-14 | 13F | Two Sigma Investments, Lp | 206 100 | 10 371 | ||||||
| 2025-08-08 | 13F | Creative Planning | 5 447 | −25,79 | 274 | −21,94 | ||||
| 2025-08-13 | 13F | Capital Analysts, Inc. | 769 | 0 | ||||||
| 2025-08-14 | 13F | Bank Of America Corp /de/ | 22 077 | 194,71 | 1 111 | 210,06 | ||||
| 2025-07-10 | 13F | Atticus Wealth Management, Llc | 2 124 | 1,53 | 107 | 6,00 | ||||
| 2025-07-15 | 13F | Missouri Trust & Investment Co | 0 | −100,00 | 0 | |||||
| 2025-07-22 | 13F | Belpointe Asset Management LLC | 12 736 | −1,58 | 641 | 3,39 | ||||
| 2025-08-08 | 13F | Larson Financial Group LLC | 301 | 30 000,00 | 15 | |||||
| 2025-07-02 | 13F | HBW Advisory Services LLC | 37 822 | 29,94 | 1 903 | 36,61 | ||||
| 2025-08-14 | 13F | Ieq Capital, Llc | 38 000 | 1 912 | ||||||
| 2025-08-14 | 13F | Fmr Llc | 127 | 49,41 | 6 | 50,00 | ||||
| 2025-08-14 | 13F | Warren Averett Asset Management, LLC | 69 562 | 7,00 | 3 500 | 12,43 |
Other Listings
| PE:SPYI |