Grundläggande statistik
| Institutionella ägare | 173 total, 173 long only, 0 short only, 0 long/short - change of −2,81% MRQ |
| Genomsnittlig portföljallokering | 0.5292 % - change of 9,66% MRQ |
| Institutionella aktier (lång) | 34 506 497 (ex 13D/G) - change of 0,68MM shares 2,01% MRQ |
| Institutionellt värde (lång) | $ 769 254 USD ($1000) |
Institutionellt ägande och aktieägare
SPDR Series Trust - SPDR Portfolio Long Term Corporate Bond ETF (US:SPLB) har 173 Institutionella ägare och aktieägare som har lämnat in 13D/G- eller 13F-formulär till Securities Exchange Commission (SEC). Dessa institut innehar totalt 34,506,497 aktier. Största aktieägare inkluderar State Street Corp, LPL Financial LLC, RMG Wealth Management LLC, FISR - SPDR SSGA Fixed Income Sector Rotation ETF, Rockland Trust Co, SSTIX - State Street Total Return V.I.S. Fund Class 1 Shares, Nyl Investors Llc, Envestnet Asset Management Inc, Morgan Stanley, and Envestnet Portfolio Solutions, Inc. .
SPDR Series Trust - SPDR Portfolio Long Term Corporate Bond ETF (ARCA:SPLB) Institutionell ägarstruktur visar institutioners och fonders nuvarande positioner i företaget, samt de senaste förändringarna i positionernas storlek. Större aktieägare kan vara enskilda investerare, fonder, hedgefonder eller institutioner. Bilaga 13D visar att investeraren äger (eller ägde) mer än 5% av företaget och avser (eller avsåg) att aktivt eftersträva en förändring av affärsstrategin. Schedule 13G indikerar en passiv investering på över 5%.
The share price as of September 12, 2025 is 23,28 / share. Previously, on September 13, 2024, the share price was 24,25 / share. This represents a decline of 4,00% over that period.

Fondsentimentets poäng
Fondsentimentet poängen(fka Ägarackumulation-poäng) visar vilka aktier som är mest köpta av fonder. Det är resultatet av en sofistikerad kvantitativ flerfaktormodell som identifierar företag med de högsta nivåerna av institutionell ackumulering. Poängsättningsmodellen använder en kombination av den totala ökningen av redovisade ägare, förändringarna i portföljallokeringarna för dessa ägare och andra mått. Siffran sträcker sig från 0 till 100, där högre siffror indikerar en högre nivå av ackumulering i förhållande till sina konkurrenter, och 50 är genomsnittet.
Uppdateringsfrekvens: Dagligen
Se Ownership Explorer, som innehåller en lista över de högst rankade företagen.
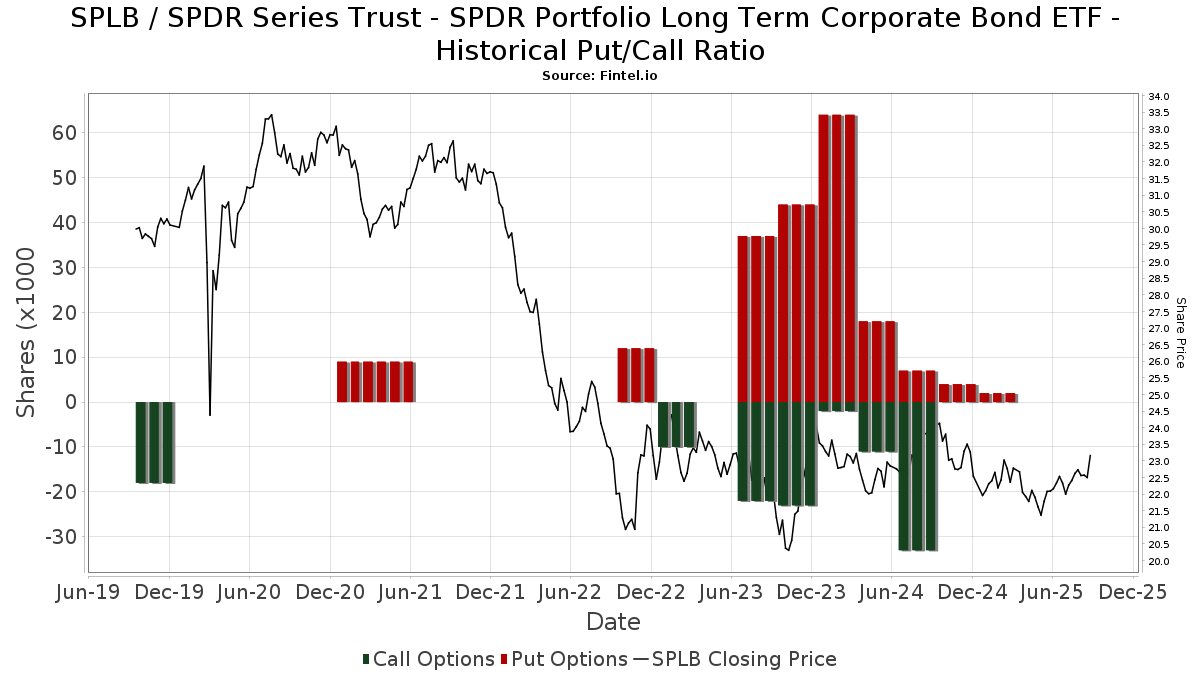
Institutionell sälj/köp-kvot
Förutom att rapportera vanliga eget kapital- och skuldemissioner måste institutioner med mer än 100MM tillgångar under förvaltning också avslöja sina innehav av sälj- och köpoptioner. Eftersom säljoptioner i allmänhet indikerar ett negativt sentiment och köpoptioner indikerar ett positivt sentiment, kan vi få en uppfattning om det övergripande institutionella sentimentet genom att plotta förhållandet mellan säljoptioner och köpoptioner. Diagrammet till höger visar det historiska förhållandet mellan sälj- och köpoptioner för detta instrument.
Genom att använda sälj/köp-kvoten som en indikator på aktieägarnas sentiment undviker man en av de största bristerna med att använda det totala institutionella ägandet, nämligen att en betydande del av de förvaltade tillgångarna investeras passivt för att följa index. Passivt förvaltade fonder köper vanligtvis inte optioner, så indikatorn för sälj/köp-kvoten ger en bättre bild av stämningen i aktivt förvaltade fonder.
13F- och NPORT-arkiveringar
Detaljer om 13F-arkiveringar är gratis. Detaljer om NP-arkiveringar kräver ett premiummedlemskap. Gröna rader indikerar nya positioner. Röda rader indikerar stängda positioner. Klicka på länk symbolen för att se hela transaktionshistoriken.
Uppgradera
för att låsa upp premiumdata och exportera till Excel ![]() .
.
| Fil Datum | Källa | Investerare | Typ | Genomsnittligt pris (beräknat) |
Aktier | Δ Aktier (%) |
Rapporterat värde (1000 USD) |
Δ Värde (%) |
Portföljallokering (%) |
|
|---|---|---|---|---|---|---|---|---|---|---|
| 2025-08-08 | 13F | Advyzon Investment Management, LLC | 52 428 | 2,38 | 1 183 | 2,42 | ||||
| 2025-08-06 | 13F | Prospera Financial Services Inc | 58 191 | −7,80 | 1 314 | −7,79 | ||||
| 2025-08-14 | 13F | Qube Research & Technologies Ltd | 224 | 0,00 | 5 | 0,00 | ||||
| 2025-05-14 | 13F | Joseph P. Lucia & Associates, LLC | 0 | −100,00 | 0 | |||||
| 2025-08-14 | 13F | Hrt Financial Lp | 0 | −100,00 | 0 | |||||
| 2025-08-28 | NP | SSTIX - State Street Total Return V.I.S. Fund Class 1 Shares | 1 671 861 | 2,26 | 37 734 | 2,25 | ||||
| 2025-07-28 | 13F | RFG Advisory, LLC | 44 063 | 7,35 | 995 | 7,34 | ||||
| 2025-08-14 | 13F | Integrated Wealth Concepts LLC | 0 | −100,00 | 0 | |||||
| 2025-08-14 | 13F | Jane Street Group, Llc | 23 224 | −97,85 | 524 | −97,85 | ||||
| 2025-07-17 | 13F | Raleigh Capital Management Inc. | 95 032 | 12,03 | 2 145 | 12,02 | ||||
| 2025-08-13 | 13F | Nyl Investors Llc | 1 450 074 | 0,22 | 32 728 | 0,22 | ||||
| 2025-08-01 | 13F | Austin Private Wealth, LLC | 205 918 | 82,69 | 4 648 | 82,74 | ||||
| 2025-04-10 | 13F | Matrix Trust Co | 0 | −100,00 | 0 | |||||
| 2025-07-22 | 13F | Iron Horse Wealth Management, LLC | 565 | 1,07 | 13 | 0,00 | ||||
| 2025-08-05 | 13F | Strategic Financial Concepts, LLC | 13 383 | −5,66 | 302 | −5,62 | ||||
| 2025-05-13 | 13F | Franklin Resources Inc | 0 | −100,00 | 0 | −100,00 | ||||
| 2025-07-11 | 13F | International Private Wealth Advisors LLC | 24 098 | 26,36 | 544 | 26,28 | ||||
| 2025-07-22 | 13F | White & Co Financial Planning Inc | 321 114 | 1,17 | 7 180 | 0,67 | ||||
| 2025-08-14 | 13F | Stifel Financial Corp | 12 299 | 278 | ||||||
| 2025-07-25 | 13F | Envestnet Portfolio Solutions, Inc. | 928 868 | 11,21 | 20 965 | 11,21 | ||||
| 2025-07-18 | 13F | Truist Financial Corp | 25 575 | −80,64 | 577 | −80,64 | ||||
| 2025-08-12 | 13F | Absolute Capital Management, LLC | 12 499 | −2,41 | 282 | −2,42 | ||||
| 2025-08-26 | 13F/A | Thrivent Financial For Lutherans | 0 | −100,00 | 0 | −100,00 | ||||
| 2025-07-08 | 13F | Boltwood Capital Management | 45 800 | −6,44 | 1 034 | −6,43 | ||||
| 2025-07-24 | 13F | IFP Advisors, Inc | 247 071 | 1,19 | 5 576 | 1,20 | ||||
| 2025-07-30 | 13F | Brookstone Capital Management | 0 | −100,00 | 0 | |||||
| 2025-07-16 | 13F | Twelve Points Wealth Management LLC | 17 428 | −12,00 | 393 | −12,08 | ||||
| 2025-08-12 | 13F | Jpmorgan Chase & Co | 150 974 | 2,45 | 3 407 | 2,44 | ||||
| 2025-08-14 | 13F | New England Asset Management Inc | 3 000 | 0,00 | 68 | 0,00 | ||||
| 2025-08-14 | 13F | Comerica Bank | 1 478 | 1,86 | 33 | 3,13 | ||||
| 2025-08-14 | 13F | Goldman Sachs Group Inc | 169 829 | 623,11 | 3 833 | 623,21 | ||||
| 2025-08-06 | 13F | Aspetuck Financial Management LLC | 121 648 | 5,64 | 2 746 | 5,66 | ||||
| 2025-08-12 | 13F | Ameritas Investment Partners, Inc. | 34 905 | 1,57 | 788 | 1,55 | ||||
| 2025-07-25 | 13F | Atria Wealth Solutions, Inc. | 19 080 | −11,92 | 431 | −11,89 | ||||
| 2025-08-28 | NP | INKM - SPDR SSGA Income Allocation ETF This fund is a listed as child fund of State Street Corp and if that institution has disclosed ownership in this security, then these positions will not be double counted when calculating total shares and total value | 57 166 | −10,58 | 1 290 | −10,54 | ||||
| 2025-08-14 | 13F | Transamerica Financial Advisors, Inc. | 81 | 0,00 | 2 | |||||
| 2025-08-14 | 13F | Smartleaf Asset Management LLC | 2 372 | 91,60 | 53 | 96,30 | ||||
| 2025-08-01 | 13F | Banco Santander, S.A. | 17 822 | 0,00 | 402 | 0,00 | ||||
| 2025-07-21 | 13F | Ameritas Advisory Services, LLC | 1 | 0 | ||||||
| 2025-07-28 | 13F | Harbour Investments, Inc. | 64 527 | 22,65 | 1 456 | 22,66 | ||||
| 2025-08-14 | 13F | Tudor Investment Corp Et Al | 0 | −100,00 | 0 | |||||
| 2025-08-08 | 13F | Collaborative Wealth Managment Inc. | 191 128 | −11,58 | 4 314 | −11,58 | ||||
| 2025-08-15 | 13F | Equitable Holdings, Inc. | 0 | −100,00 | 0 | |||||
| 2025-08-13 | 13F | Flow Traders U.s. Llc | 75 587 | 2 | ||||||
| 2025-08-13 | 13F | Rsm Us Wealth Management Llc | 10 788 | 243 | ||||||
| 2025-08-05 | 13F | Landmark Wealth Management, Inc. | 148 474 | 14,51 | 3 351 | 14,52 | ||||
| 2025-07-23 | 13F | RMG Wealth Management LLC | 2 097 447 | 46 400 | ||||||
| 2025-08-04 | 13F | Flagship Harbor Advisors, Llc | 171 121 | 3 862 | ||||||
| 2025-07-02 | 13F | HBW Advisory Services LLC | 0 | −100,00 | 0 | |||||
| 2025-08-14 | 13F | Fmr Llc | 0 | −100,00 | 0 | |||||
| 2025-07-10 | 13F | Global Financial Private Client, LLC | 29 802 | 20,67 | 673 | 20,65 | ||||
| 2025-07-14 | 13F | Caitlin John, LLC | 75 728 | −62,68 | 1 709 | −62,69 | ||||
| 2025-08-14 | 13F | Harwood Advisory Group, LLC | 10 | −44,44 | 0 | |||||
| 2025-08-14 | 13F | Bnp Paribas Arbitrage, Sa | 0 | −100,00 | 0 | |||||
| 2025-07-23 | 13F | Capstone Wealth Management Group, Llc | 53 273 | −80,87 | 1 202 | −80,87 | ||||
| 2025-08-14 | 13F | EP Wealth Advisors, Inc. | 5 000 | 1,34 | 113 | 0,90 | ||||
| 2025-08-14 | 13F | Heritage Wealth Management, Inc. | 9 250 | 0,00 | 209 | 0,00 | ||||
| 2025-07-10 | 13F | Rockland Trust Co | 1 681 304 | 3,46 | 37 947 | 3,47 | ||||
| 2025-09-04 | 13F/A | Advisor Group Holdings, Inc. | 409 259 | 32,29 | 9 237 | 32,28 | ||||
| 2025-07-21 | 13F | Mirae Asset Global Investments Co., Ltd. | 305 000 | 15,53 | 6 884 | 16,03 | ||||
| 2025-08-14 | 13F | GWM Advisors LLC | 137 711 | 3,52 | 3 108 | 3,53 | ||||
| 2025-08-12 | 13F | RiverFront Investment Group, LLC | 19 696 | −88,27 | 445 | −88,28 | ||||
| 2025-08-12 | 13F | J.w. Cole Advisors, Inc. | 90 285 | 2 038 | ||||||
| 2025-08-28 | NP | GPMIX - GuidePath(R) Multi-Asset Income Allocation Fund Service Shares | 61 824 | 33,38 | 1 395 | 33,37 | ||||
| 2025-07-25 | 13F | Northwest Capital Management Inc | 121 | −91,43 | 3 | −93,55 | ||||
| 2025-07-25 | 13F | Van Strum & Towne Inc. | 169 403 | −11,07 | 3 823 | −11,07 | ||||
| 2025-08-13 | 13F | Townsquare Capital Llc | 0 | −100,00 | 0 | |||||
| 2025-08-14 | 13F/A | Barclays Plc | 1 | 0,00 | 0 | |||||
| 2025-08-14 | 13F | Ameriprise Financial Inc | 48 857 | −17,89 | 1 103 | −17,88 | ||||
| 2025-07-11 | 13F | Farther Finance Advisors, LLC | 7 621 | 10,58 | 172 | 10,97 | ||||
| 2025-07-03 | 13F | City Center Advisors, LLC | 15 541 | 10,62 | 351 | 10,41 | ||||
| 2025-08-18 | 13F | Geneos Wealth Management Inc. | 30 128 | 2,76 | 680 | 2,72 | ||||
| 2025-08-01 | 13F | Gwn Securities Inc. | 59 854 | 105,04 | 1 353 | 105,31 | ||||
| 2025-07-09 | 13F | VisionPoint Advisory Group, LLC | 17 639 | 398 | ||||||
| 2025-04-10 | 13F | Legacy Financial Group LLC | 0 | −100,00 | 0 | |||||
| 2025-08-13 | 13F | Level Four Advisory Services, Llc | 19 007 | −3,48 | 429 | −3,60 | ||||
| 2025-08-13 | 13F | Cary Street Partners Financial Llc | 88 481 | −7,10 | 1 997 | −7,07 | ||||
| 2025-08-06 | NP | LINCOLN VARIABLE INSURANCE PRODUCTS TRUST - LVIP SSGA Global Tactical Allocation Managed Volatility Fund Standard Class | 908 039 | 73,18 | 20 494 | 73,18 | ||||
| 2025-08-15 | 13F | Truefg, Llc | 52 076 | 5,72 | 1 175 | 5,76 | ||||
| 2025-08-12 | 13F | Richard W. Paul & Associates, LLC | 6 266 | 5,63 | 141 | 6,02 | ||||
| 2025-05-09 | 13F | Frazier Financial Advisors, LLC | 0 | −100,00 | 0 | |||||
| 2025-08-14 | 13F | Two Sigma Securities, Llc | 44 693 | 119,48 | 1 009 | 119,61 | ||||
| 2025-08-11 | 13F | Outlook Wealth Advisors, LLC | 21 572 | 6,91 | 487 | 6,81 | ||||
| 2025-08-14 | 13F | Capitolis Liquid Global Markets LLC | 0 | −100,00 | 0 | |||||
| 2025-08-06 | 13F | Csenge Advisory Group | 10 365 | 0,88 | 228 | 1,79 | ||||
| 2025-08-01 | 13F | Envestnet Asset Management Inc | 1 366 362 | 6,33 | 30 839 | 6,33 | ||||
| 2025-08-07 | 13F | Guidance Capital, Inc | 17 799 | −35,34 | 401 | −33,39 | ||||
| 2025-08-08 | 13F | Capital Investment Advisory Services, LLC | 10 | 11,11 | 0 | |||||
| 2025-08-11 | 13F | Pineridge Advisors LLC | 15 | 0,00 | 0 | |||||
| 2025-07-24 | 13F | Blair William & Co/il | 994 | 22 | ||||||
| 2025-08-13 | 13F | Global Endowment Management, LP | 13 903 | 6,30 | 314 | 6,10 | ||||
| 2025-08-13 | 13F | Jones Financial Companies Lllp | 19 160 | −16,01 | 428 | −16,41 | ||||
| 2025-08-14 | 13F | Citadel Advisors Llc | Put | 0 | −100,00 | 0 | ||||
| 2025-08-11 | 13F | Private Advisor Group, LLC | 230 197 | −5,82 | 5 196 | −5,82 | ||||
| 2025-07-17 | 13F | LifeGoal Wealth Advisors | 11 669 | −20,01 | 263 | −20,06 | ||||
| 2025-05-15 | 13F | Tower Research Capital LLC (TRC) | 0 | −100,00 | 0 | |||||
| 2025-08-15 | 13F | Morgan Stanley | 1 055 906 | −3,45 | 23 832 | −3,45 | ||||
| 2025-08-14 | 13F | Citadel Advisors Llc | 0 | −100,00 | 0 | |||||
| 2025-08-05 | 13F | Westside Investment Management, Inc. | 48 599 | 95,46 | 1 097 | 95,37 | ||||
| 2025-08-14 | 13F | Citadel Advisors Llc | Call | 0 | −100,00 | 0 | ||||
| 2025-04-23 | 13F | IMG Wealth Management, Inc. | 0 | −100,00 | 0 | |||||
| 2025-08-13 | 13F | VestGen Advisors, LLC | 10 238 | 231 | ||||||
| 2025-07-21 | 13F | Ascent Group, LLC | 22 717 | 16,66 | 513 | 16,63 | ||||
| 2025-08-14 | 13F | Wiley Bros.-aintree Capital, Llc | 29 658 | −10,08 | 669 | −9,72 | ||||
| 2025-07-30 | 13F | Insight Advisors, LLC/ PA | 31 496 | −7,11 | 711 | −7,19 | ||||
| 2025-07-22 | 13F | Merit Financial Group, LLC | 27 372 | 618 | ||||||
| 2025-08-08 | 13F | Emerald Investment Partners, Llc | 10 330 | −48,03 | 233 | −47,99 | ||||
| 2025-08-14 | 13F | Susquehanna International Group, Llp | 16 692 | −85,67 | 377 | −85,70 | ||||
| 2025-08-14 | 13F | Talon Private Wealth, LLC | 1 908 | 43 | ||||||
| 2025-07-24 | 13F | Conning Inc. | 124 080 | 0,00 | 2 800 | 0,00 | ||||
| 2025-08-28 | NP | FISR - SPDR SSGA Fixed Income Sector Rotation ETF This fund is a listed as child fund of State Street Corp and if that institution has disclosed ownership in this security, then these positions will not be double counted when calculating total shares and total value | 2 039 540 | −2,28 | 46 032 | −2,28 | ||||
| 2025-08-08 | 13F | SBI Securities Co., Ltd. | 6 343 | 8,54 | 143 | 9,16 | ||||
| 2025-08-14 | 13F | Novus Advisors, Llc | 35 561 | 4,99 | 803 | 4,97 | ||||
| 2025-07-29 | 13F | Balboa Wealth Partners | 21 264 | 5,49 | 480 | 5,51 | ||||
| 2025-07-23 | 13F | Valmark Advisers, Inc. | 11 565 | −3,77 | 261 | −3,69 | ||||
| 2025-08-06 | 13F | Commonwealth Equity Services, Llc | 22 080 | 6,41 | 0 | |||||
| 2025-08-13 | 13F | GeoWealth Management, LLC | 16 424 | 11,55 | 371 | 11,45 | ||||
| 2025-05-01 | 13F | Quest 10 Wealth Builders, Inc. | 6 | 0 | ||||||
| 2025-08-14 | 13F | Wells Fargo & Company/mn | 373 193 | −27,34 | 8 423 | −27,35 | ||||
| 2025-07-10 | 13F | Sterling Financial Group, Inc. | 837 120 | 1,46 | 18 894 | 1,46 | ||||
| 2025-07-16 | 13F | Novem Group | 50 538 | 9,22 | 1 141 | 9,20 | ||||
| 2025-08-19 | 13F | Newbridge Financial Services Group, Inc. | 3 171 | 1,34 | 72 | 1,43 | ||||
| 2025-07-17 | 13F | Sound Income Strategies, LLC | 1 705 | −2,07 | 38 | −2,56 | ||||
| 2025-08-01 | 13F | Advisory Alpha, LLC | 13 251 | 5,91 | 299 | 6,03 | ||||
| 2025-08-05 | 13F | NewSquare Capital LLC | 420 | 0,00 | 9 | 0,00 | ||||
| 2025-08-13 | 13F | Northwestern Mutual Wealth Management Co | 690 540 | −22,25 | 15 585 | −22,25 | ||||
| 2025-08-06 | 13F | Decker Retirement Planning Inc. | 9 009 | 3,30 | 203 | 3,57 | ||||
| 2025-04-11 | 13F/A | Private Advisory Group LLC | 0 | −100,00 | 0 | −100,00 | ||||
| 2025-08-14 | 13F | IHT Wealth Management, LLC | 18 110 | −15,29 | 409 | −15,35 | ||||
| 2025-07-25 | 13F | Richardson Financial Services Inc. | 21 695 | 8,11 | 489 | 8,19 | ||||
| 2025-05-30 | NP | BRMSX - Bramshill Income Performance Fund Institutional Class | 106 266 | 2 398 | ||||||
| 2025-08-14 | 13F | Synovus Financial Corp | 111 543 | 6,29 | 2 518 | 6,29 | ||||
| 2025-08-13 | 13F | Vermillion & White Wealth Management Group, LLC | 44 | 0,00 | 1 | |||||
| 2025-07-14 | 13F | Iams Wealth Management, Llc | 18 024 | 27,90 | 407 | 27,67 | ||||
| 2025-07-08 | 13F | Goldstone Financial Group, LLC | 508 205 | −4,56 | 11 409 | −5,06 | ||||
| 2025-07-10 | 13F | Sharkey, Howes & Javer | 135 123 | 3 050 | ||||||
| 2025-08-28 | NP | GAL - SPDR SSGA Global Allocation ETF This fund is a listed as child fund of State Street Corp and if that institution has disclosed ownership in this security, then these positions will not be double counted when calculating total shares and total value | 405 905 | 7,84 | 9 161 | 7,84 | ||||
| 2025-08-11 | 13F | HighTower Advisors, LLC | 76 368 | 10,47 | 1 724 | 10,45 | ||||
| 2025-08-11 | 13F | Principal Securities, Inc. | 141 937 | 42,53 | 3 204 | 44,74 | ||||
| 2025-08-05 | 13F | Bank of New York Mellon Corp | 310 914 | 10,65 | 7 017 | 10,64 | ||||
| 2025-08-12 | 13F | Wayfinding Financial, LLC | 0 | −100,00 | 0 | |||||
| 2025-07-24 | 13F | Eastern Bank | 0 | −100,00 | 0 | |||||
| 2025-08-11 | 13F | Covestor Ltd | 253 | 328,81 | 0 | |||||
| 2025-08-04 | 13F | Creative Financial Designs Inc /adv | 2 617 | 36,73 | 59 | 37,21 | ||||
| 2025-07-24 | 13F | Ronald Blue Trust, Inc. | 792 | −66,89 | 18 | −67,92 | ||||
| 2025-07-28 | 13F | Axxcess Wealth Management, Llc | 49 915 | 7,00 | 1 127 | 7,03 | ||||
| 2025-08-14 | 13F | UBS Group AG | 77 937 | −77,93 | 1 759 | −77,93 | ||||
| 2025-08-12 | 13F | Proequities, Inc. | 0 | 0 | ||||||
| 2025-08-08 | 13F | Hedeker Wealth, LLC | 296 068 | −0,60 | 6 682 | −0,60 | ||||
| 2025-05-06 | 13F | Boyd Watterson Asset Management Llc/oh | 0 | −100,00 | 0 | |||||
| 2025-07-31 | 13F | Arrien Investments, Inc. | 169 298 | 3 821 | ||||||
| 2025-08-12 | 13F | BlackRock, Inc. | 173 382 | 0,90 | 3 913 | 0,90 | ||||
| 2025-08-14 | 13F | Graney & King, LLC | 172 636 | 8,73 | 3 896 | 8,74 | ||||
| 2025-08-08 | 13F | Pnc Financial Services Group, Inc. | 7 144 | −10,05 | 161 | −10,06 | ||||
| 2025-04-21 | 13F | Nelson, Van Denburg & Campbell Wealth Management Group, LLC | 0 | −100,00 | 0 | |||||
| 2025-08-14 | 13F | CoreCap Advisors, LLC | 9 111 | −9,70 | 206 | −9,69 | ||||
| 2025-04-28 | 13F | Horizon Financial Services, Llc | 0 | 0 | ||||||
| 2025-08-18 | 13F/A | National Bank Of Canada /fi/ | 2 571 | 0,00 | 58 | 0,00 | ||||
| 2025-08-08 | 13F | Cetera Investment Advisers | 128 289 | 18,69 | 2 895 | 18,70 | ||||
| 2025-08-12 | 13F | LPL Financial LLC | 3 441 026 | 6,08 | 77 664 | 6,08 | ||||
| 2025-07-18 | 13F | Lockerman Financial Group, Inc. | 23 267 | 14,14 | 525 | 14,13 | ||||
| 2025-07-10 | 13F | HF Advisory Group, LLC | 10 534 | 2,57 | 238 | 2,60 | ||||
| 2025-08-06 | 13F | AE Wealth Management LLC | 42 512 | 31,73 | 959 | 31,73 | ||||
| 2025-07-10 | 13F | Signal Advisors Wealth, LLC | 95 176 | 2 148 | ||||||
| 2025-07-10 | 13F | Wealth Enhancement Advisory Services, Llc | 27 629 | −5,01 | 620 | −5,49 | ||||
| 2025-08-08 | 13F | Gts Securities Llc | 0 | −100,00 | 0 | |||||
| 2025-08-13 | 13F | Ally Invest Advisors Inc. | 33 496 | 6,22 | 756 | 6,19 | ||||
| 2025-08-14 | 13F | Mariner, LLC | 0 | −100,00 | 0 | |||||
| 2025-08-07 | 13F | PFG Advisors | 348 930 | 8,43 | 7 875 | 8,43 | ||||
| 2025-08-11 | 13F | Advisor Resource Council | 0 | −100,00 | 0 | |||||
| 2025-08-14 | 13F | Gotham Asset Management, LLC | 347 329 | −0,27 | 7 839 | −0,27 | ||||
| 2025-08-12 | 13F | Spectrum Wealth Advisory Group, LLC | 250 218 | 5 647 | ||||||
| 2025-08-04 | 13F | Atria Investments Llc | 14 556 | −5,76 | 329 | −5,75 | ||||
| 2025-07-31 | 13F | Buckingham Strategic Partners | 9 282 | 209 | ||||||
| 2025-08-04 | 13F | Assetmark, Inc | 803 797 | 19,86 | 18 142 | 19,85 | ||||
| 2025-07-08 | 13F | Strategic Advocates LLC | 845 820 | 1,97 | 19 090 | 1,97 | ||||
| 2025-08-14 | 13F/A | Rockefeller Capital Management L.P. | 45 304 | 13,03 | 1 023 | 13,05 | ||||
| 2025-07-31 | 13F | Glass Jacobson Investment Advisors llc | 0 | −100,00 | 0 | |||||
| 2025-08-18 | 13F | N.E.W. Advisory Services LLC | 87 | 1,16 | 2 | 0,00 | ||||
| 2025-08-15 | 13F | Kestra Advisory Services, LLC | 14 089 | 318 | ||||||
| 2025-07-28 | 13F | RMR Capital Management, LLC | 23 971 | 0,00 | 541 | 0,00 | ||||
| 2025-08-14 | 13F | Sunbelt Securities, Inc. | 1 059 | 0,00 | 24 | 0,00 | ||||
| 2025-05-16 | 13F | Coppell Advisory Solutions LLC | 0 | −100,00 | 0 | −100,00 | ||||
| 2025-08-12 | 13F | O'shaughnessy Asset Management, Llc | 38 | −54,76 | 1 | −100,00 | ||||
| 2025-08-14 | 13F | Bank Of America Corp /de/ | 368 767 | −19,17 | 8 323 | −19,17 | ||||
| 2025-07-14 | 13F | Park Avenue Securities Llc | 149 248 | 0,77 | 3 | 0,00 | ||||
| 2025-08-14 | 13F | State Street Corp | 7 315 006 | 6,20 | 165 100 | 6,20 | ||||
| 2025-08-13 | 13F | Quadrature Capital Ltd | 0 | −100,00 | 0 | |||||
| 2025-08-14 | 13F | Royal Bank Of Canada | 379 880 | 9,25 | 8 574 | 9,25 | ||||
| 2025-07-29 | 13F | Koshinski Asset Management, Inc. | 48 111 | −10,31 | 1 086 | −10,33 | ||||
| 2025-07-17 | 13F | Fifth Third Securities, Inc. | 103 699 | 8,22 | 2 340 | 8,23 | ||||
| 2025-08-14 | 13F | KKM Financial LLC | 37 273 | 2,35 | 842 | 6,05 | ||||
| 2025-04-22 | 13F | Nilsine Partners, LLC | 0 | −100,00 | 0 | |||||
| 2025-08-14 | 13F | Hilltop Holdings Inc. | 10 307 | 233 | ||||||
| 2025-08-14 | 13F | Raymond James Financial Inc | 328 441 | −6,64 | 7 413 | −6,65 | ||||
| 2025-08-14 | 13F | State Of Wisconsin Investment Board | 42 920 | 0,00 | 969 | 0,00 | ||||
| 2025-07-22 | 13F | Aspire Private Capital, LLC | 178 086 | 6,84 | 4 019 | 6,86 | ||||
| 2025-08-13 | 13F | Transce3nd, LLC | 1 214 | 68,61 | 27 | 68,75 | ||||
| 2025-08-27 | NP | FFSAX - Touchstone Flexible Income Fund Class A | 0 | −100,00 | 0 | −100,00 | ||||
| 2025-08-12 | 13F | Change Path, LLC | 55 498 | 36,97 | 1 253 | 36,98 | ||||
| 2025-07-25 | 13F | Cwm, Llc | 10 373 | −7,70 | 0 | |||||
| 2025-05-02 | 13F | Transcendent Capital Group LLC | 0 | −100,00 | 0 | |||||
| 2025-08-14 | 13F | Harvest Investment Services, LLC | 10 085 | 8,98 | 228 | 9,13 | ||||
| 2025-05-02 | 13F | Capital A Wealth Management, LLC | 19 | 0 | ||||||
| 2025-08-12 | 13F | Archer Investment Corp | 2 843 | −24,63 | 64 | −24,71 | ||||
| 2025-04-09 | 13F | Milestone Asset Management, Llc | 0 | −100,00 | 0 | |||||
| 2025-07-29 | 13F | Private Trust Co Na | 8 092 | −60,91 | 183 | −61,03 | ||||
| 2025-08-14 | 13F | Mml Investors Services, Llc | 56 239 | −22,25 | 1 | 0,00 | ||||
| 2025-07-31 | 13F | Cambridge Investment Research Advisors, Inc. | 58 714 | 9,17 | 1 | 0,00 | ||||
| 2025-08-05 | 13F | Fourth Dimension Wealth, LLC | 56 170 | 13,27 | 1 268 | 13,23 | ||||
| 2025-08-12 | 13F | Global Retirement Partners, LLC | 1 933 | 28,52 | 44 | 30,30 |
Other Listings
| MX:SPLB |