Grundläggande statistik
| Institutionella ägare | 134 total, 134 long only, 0 short only, 0 long/short - change of 8,06% MRQ |
| Genomsnittlig portföljallokering | 0.6744 % - change of −2,59% MRQ |
| Institutionella aktier (lång) | 12 213 590 (ex 13D/G) - change of 1,72MM shares 16,34% MRQ |
| Institutionellt värde (lång) | $ 324 611 USD ($1000) |
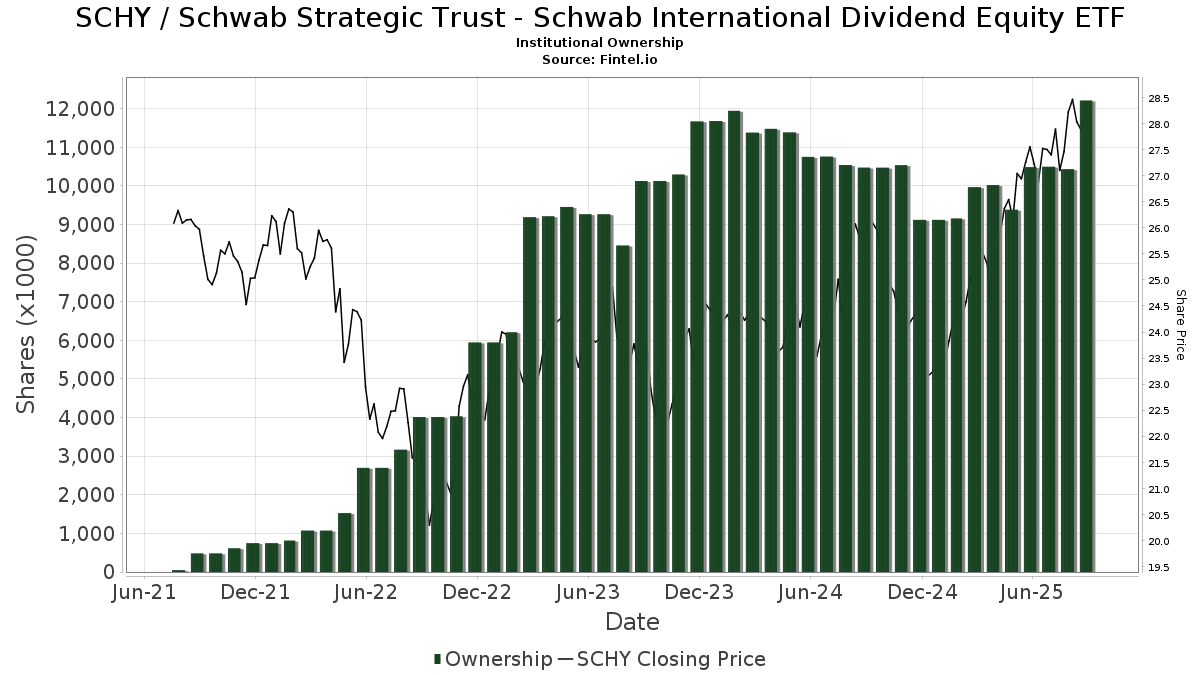
Institutionellt ägande och aktieägare
Schwab Strategic Trust - Schwab International Dividend Equity ETF (US:SCHY) har 134 Institutionella ägare och aktieägare som har lämnat in 13D/G- eller 13F-formulär till Securities Exchange Commission (SEC). Dessa institut innehar totalt 12,213,590 aktier. Största aktieägare inkluderar Cresset Asset Management, LLC, Summit Asset Management, LLC, Hamel Associates, Inc., HighTower Advisors, LLC, SWKRX - Schwab Monthly Income Fund - Enhanced Payout, Advisor Group Holdings, Inc., Bank Of America Corp /de/, SWJRX - Schwab Monthly Income Fund - Moderate Payout, LeConte Wealth Management, LLC, and Jane Street Group, Llc .
Schwab Strategic Trust - Schwab International Dividend Equity ETF (ARCA:SCHY) Institutionell ägarstruktur visar institutioners och fonders nuvarande positioner i företaget, samt de senaste förändringarna i positionernas storlek. Större aktieägare kan vara enskilda investerare, fonder, hedgefonder eller institutioner. Bilaga 13D visar att investeraren äger (eller ägde) mer än 5% av företaget och avser (eller avsåg) att aktivt eftersträva en förändring av affärsstrategin. Schedule 13G indikerar en passiv investering på över 5%.
The share price as of September 9, 2025 is 28,27 / share. Previously, on September 10, 2024, the share price was 25,86 / share. This represents an increase of 9,32% over that period.
Fondsentimentets poäng
Fondsentimentet poängen(fka Ägarackumulation-poäng) visar vilka aktier som är mest köpta av fonder. Det är resultatet av en sofistikerad kvantitativ flerfaktormodell som identifierar företag med de högsta nivåerna av institutionell ackumulering. Poängsättningsmodellen använder en kombination av den totala ökningen av redovisade ägare, förändringarna i portföljallokeringarna för dessa ägare och andra mått. Siffran sträcker sig från 0 till 100, där högre siffror indikerar en högre nivå av ackumulering i förhållande till sina konkurrenter, och 50 är genomsnittet.
Uppdateringsfrekvens: Dagligen
Se Ownership Explorer, som innehåller en lista över de högst rankade företagen.
Institutionell sälj/köp-kvot
Förutom att rapportera vanliga eget kapital- och skuldemissioner måste institutioner med mer än 100MM tillgångar under förvaltning också avslöja sina innehav av sälj- och köpoptioner. Eftersom säljoptioner i allmänhet indikerar ett negativt sentiment och köpoptioner indikerar ett positivt sentiment, kan vi få en uppfattning om det övergripande institutionella sentimentet genom att plotta förhållandet mellan säljoptioner och köpoptioner. Diagrammet till höger visar det historiska förhållandet mellan sälj- och köpoptioner för detta instrument.
Genom att använda sälj/köp-kvoten som en indikator på aktieägarnas sentiment undviker man en av de största bristerna med att använda det totala institutionella ägandet, nämligen att en betydande del av de förvaltade tillgångarna investeras passivt för att följa index. Passivt förvaltade fonder köper vanligtvis inte optioner, så indikatorn för sälj/köp-kvoten ger en bättre bild av stämningen i aktivt förvaltade fonder.
13F- och NPORT-arkiveringar
Detaljer om 13F-arkiveringar är gratis. Detaljer om NP-arkiveringar kräver ett premiummedlemskap. Gröna rader indikerar nya positioner. Röda rader indikerar stängda positioner. Klicka på länk symbolen för att se hela transaktionshistoriken.
Uppgradera
för att låsa upp premiumdata och exportera till Excel ![]() .
.
| Fil Datum | Källa | Investerare | Typ | Genomsnittligt pris (beräknat) |
Aktier | Δ Aktier (%) |
Rapporterat värde (1000 USD) |
Δ Värde (%) |
Portföljallokering (%) |
|
|---|---|---|---|---|---|---|---|---|---|---|
| 2025-08-19 | 13F | Advisory Services Network, LLC | 8 204 | 0,55 | 221 | 6,28 | ||||
| 2025-08-12 | 13F | Accredited Wealth Management, LLC | 4 672 | −5,08 | 128 | 2,42 | ||||
| 2025-07-14 | 13F/A | Seek First Inc. | 44 365 | 2,72 | 1 213 | 10,68 | ||||
| 2025-08-05 | 13F | Magnolia Capital Advisors Llc | 192 015 | 40,93 | 5 252 | 51,85 | ||||
| 2025-08-14 | 13F | Tennessee Valley Asset Management Partners | 0 | −100,00 | 0 | |||||
| 2025-04-10 | 13F | Beacon Financial Group | 0 | −100,00 | 0 | |||||
| 2025-05-06 | 13F | Principle Wealth Partners Llc | 0 | −100,00 | 0 | |||||
| 2025-08-15 | 13F | Kestra Advisory Services, LLC | 24 179 | 12,34 | 661 | 21,06 | ||||
| 2025-08-05 | 13F | Simplex Trading, Llc | 87 | 0 | ||||||
| 2025-06-03 | 13F | Invst, LLC | 0 | −100,00 | 0 | |||||
| 2025-07-25 | 13F | Iron Financial, LLC | 246 270 | 3,08 | 6 735 | 11,08 | ||||
| 2025-08-14 | 13F | Warren Averett Asset Management, LLC | 101 302 | 7,16 | 2 771 | 15,46 | ||||
| 2025-07-25 | 13F | Astoria Portfolio Advisors LLC. | 31 238 | 215,19 | 864 | 237,50 | ||||
| 2025-07-16 | 13F | Embree Financial Group | 45 544 | −0,87 | 1 246 | 6,78 | ||||
| 2025-07-31 | 13F | Cambridge Investment Research Advisors, Inc. | 77 993 | 8,66 | 2 | 100,00 | ||||
| 2025-07-08 | 13F | Parallel Advisors, LLC | 15 428 | 2,85 | 422 | 10,79 | ||||
| 2025-07-11 | 13F | Wolfstich Capital, LLC | 71 217 | −12,42 | 1 083 | −7,67 | ||||
| 2025-08-15 | 13F | Morgan Stanley | 22 839 | −7,08 | 625 | 0,16 | ||||
| 2025-07-15 | 13F | Hidden Cove Wealth Management, LLC | 11 962 | 327 | ||||||
| 2025-08-14 | 13F | Hara Capital LLC | 4 140 | −2,36 | 113 | 5,61 | ||||
| 2025-08-08 | 13F | D'Orazio & Associates, Inc. | 9 039 | 1,24 | 247 | 9,29 | ||||
| 2025-08-08 | 13F | Cetera Investment Advisers | 15 699 | 83,68 | 429 | 98,61 | ||||
| 2025-08-01 | 13F | Redwood Park Advisors LLC | 5 773 | 79,01 | 158 | 93,83 | ||||
| 2025-08-14 | 13F | Raymond James Financial Inc | 50 044 | 8,58 | 1 369 | 17,02 | ||||
| 2025-05-01 | 13F | Park Square Financial Group, LLC | 0 | −100,00 | 0 | |||||
| 2025-08-12 | 13F | Vawter Financial, Ltd. | 0 | −100,00 | 0 | |||||
| 2025-08-14 | 13F | UBS Group AG | 8 912 | 244 | ||||||
| 2025-07-10 | 13F | Oliver Lagore Vanvalin Investment Group | 0 | −100,00 | 0 | |||||
| 2025-08-14 | 13F | Susquehanna International Group, Llp | 27 362 | 748 | ||||||
| 2025-08-14 | 13F | Smartleaf Asset Management LLC | 4 995 | −15,42 | 136 | −10,00 | ||||
| 2025-04-28 | 13F | First Horizon Advisors, Inc. | 0 | −100,00 | 0 | |||||
| 2025-04-21 | 13F | Envestnet Portfolio Solutions, Inc. | 0 | −100,00 | 0 | |||||
| 2025-07-09 | 13F | Fiduciary Alliance LLC | 67 536 | 1 847 | ||||||
| 2025-07-21 | 13F | Keystone Financial Group, Inc. | 21 794 | −27,59 | 593 | −26,15 | ||||
| 2025-07-11 | 13F | Bell Bank | 9 939 | 0,00 | 272 | 7,54 | ||||
| 2025-07-09 | 13F | Breakwater Investment Management | 1 463 | 37,50 | 40 | 48,15 | ||||
| 2025-04-23 | 13F | JB Capital LLC | 0 | −100,00 | 0 | |||||
| 2025-08-12 | 13F | Tradition Wealth Management, LLC | 14 929 | 9,26 | 408 | 17,92 | ||||
| 2025-09-04 | 13F/A | Advisor Group Holdings, Inc. | 477 589 | −0,75 | 13 062 | 6,95 | ||||
| 2025-07-15 | 13F | LeConte Wealth Management, LLC | 294 602 | −28,60 | 8 057 | −23,05 | ||||
| 2025-08-25 | NP | SWJRX - Schwab Monthly Income Fund - Moderate Payout This fund is a listed as child fund of Charles Schwab Investment Management Inc and if that institution has disclosed ownership in this security, then these positions will not be double counted when calculating total shares and total value | 302 801 | 1,32 | 8 282 | 9,19 | ||||
| 2025-05-15 | 13F | GWM Advisors LLC | 0 | −100,00 | 0 | |||||
| 2025-07-09 | 13F | Bruce G. Allen Investments, LLC | 10 580 | 13,86 | 289 | 22,98 | ||||
| 2025-08-06 | 13F | Commonwealth Equity Services, Llc | 162 400 | 144,28 | 4 | 300,00 | ||||
| 2025-07-16 | 13F | Spinnaker Investment Group, LLC | 40 389 | 0,00 | 1 105 | 7,71 | ||||
| 2025-08-14 | 13F | Mml Investors Services, Llc | 39 522 | 2,93 | 1 | |||||
| 2025-05-12 | 13F | C2P Capital Advisory Group, LLC d.b.a. Prosperity Capital Advisors | 0 | −100,00 | 0 | −100,00 | ||||
| 2025-07-11 | 13F | Caldwell Securities, Inc | 3 398 | 10,15 | 93 | 17,95 | ||||
| 2025-04-21 | 13F | PSI Advisors, LLC | 0 | −100,00 | 0 | |||||
| 2025-08-14 | 13F | Mariner, LLC | 49 161 | 18,18 | 1 345 | 27,39 | ||||
| 2025-07-14 | 13F | AdvisorNet Financial, Inc | 1 892 | 1,23 | 52 | 8,51 | ||||
| 2025-08-12 | 13F | Kohmann Bosshard Financial Services, LLC | 69 055 | −2,67 | 1 889 | 4,89 | ||||
| 2025-08-14 | 13F | Jane Street Group, Llc | 293 318 | 136,50 | 8 022 | 154,91 | ||||
| 2025-07-29 | 13F | BXM Wealth LLC | 7 385 | 202 | ||||||
| 2025-08-14 | 13F | Wealth Preservation Advisors, LLC | 158 | 0,00 | 4 | 0,00 | ||||
| 2025-08-12 | 13F | Pathstone Holdings, LLC | 103 110 | 0,00 | 2 820 | 7,80 | ||||
| 2025-07-30 | 13F | Avidian Wealth Solutions, LLC | 38 089 | 3,37 | 1 042 | 11,34 | ||||
| 2025-08-13 | 13F | Hamel Associates, Inc. | 539 955 | 250,11 | 14 768 | 277,29 | ||||
| 2025-08-11 | 13F | Berkeley, Inc | 38 626 | −2,54 | 1 056 | 5,07 | ||||
| 2025-05-15 | 13F | Two Sigma Securities, Llc | 0 | −100,00 | 0 | −100,00 | ||||
| 2025-08-11 | 13F | Aptus Capital Advisors, LLC | 11 773 | 1,23 | 322 | 8,81 | ||||
| 2025-08-14 | 13F | Wells Fargo & Company/mn | 4 806 | 240 200,00 | 131 | |||||
| 2025-08-12 | 13F | Jpmorgan Chase & Co | 820 | −82,87 | 22 | −81,82 | ||||
| 2025-08-14 | 13F | Integrated Wealth Concepts LLC | 131 027 | 2,20 | 3 584 | 10,14 | ||||
| 2025-07-22 | 13F | D.B. Root & Company, LLC | 14 371 | 393 | ||||||
| 2025-07-25 | 13F | Concord Wealth Partners | 2 324 | 0,78 | 64 | 8,62 | ||||
| 2025-08-08 | 13F | Collaborative Wealth Managment Inc. | 14 620 | 0,00 | 400 | 7,55 | ||||
| 2025-04-14 | 13F | Park Avenue Securities Llc | 0 | −100,00 | 0 | |||||
| 2025-08-08 | 13F | Creative Planning | 0 | −100,00 | 0 | |||||
| 2025-05-06 | 13F | AE Wealth Management LLC | 0 | −100,00 | 0 | |||||
| 2025-08-01 | 13F | Envestnet Asset Management Inc | 14 967 | 28,37 | 409 | 38,64 | ||||
| 2025-08-07 | 13F | Summit Asset Management, LLC | 660 984 | 0,49 | 18 078 | 8,28 | ||||
| 2025-08-11 | 13F | Vanguard Group Inc | 42 807 | 0,00 | 1 171 | 7,73 | ||||
| 2025-07-15 | 13F | West Oak Capital, LLC | 645 | −56,12 | 0 | |||||
| 2025-08-12 | 13F | Global Retirement Partners, LLC | 503 | −51,59 | 14 | −45,83 | ||||
| 2025-07-10 | 13F | Farmers & Merchants Trust Co of Chambersburg PA | 822 | 0,00 | 0 | |||||
| 2025-07-17 | 13F | Charles Schwab Trust Co | 289 111 | 31,11 | 7 907 | 41,30 | ||||
| 2025-08-14 | 13F | Comerica Bank | 673 | −8,81 | 18 | 0,00 | ||||
| 2025-08-13 | 13F | Northwestern Mutual Wealth Management Co | 84 400 | −16,03 | 2 308 | −9,53 | ||||
| 2025-07-23 | 13F | First Merchants Corp | 97 014 | −41,17 | 2 653 | −36,61 | ||||
| 2025-08-14 | 13F | CoreCap Advisors, LLC | 2 553 | 0,00 | 70 | 7,81 | ||||
| 2025-07-22 | 13F | Noble Family Wealth, LLC | 79 540 | 1,89 | 2 175 | 9,79 | ||||
| 2025-07-28 | 13F | Harbour Investments, Inc. | 377 | 0,00 | 10 | 11,11 | ||||
| 2025-05-02 | 13F | Summit X, LLC | 0 | −100,00 | 0 | |||||
| 2025-07-30 | 13F | Exencial Wealth Advisors, Llc | 78 679 | −6,15 | 2 152 | 1,13 | ||||
| 2025-08-04 | 13F | Hantz Financial Services, Inc. | 0 | −100,00 | 0 | |||||
| 2025-08-06 | 13F | Wsfs Capital Management, Llc | 31 634 | 0,00 | 865 | 7,86 | ||||
| 2025-07-31 | 13F | Oppenheimer Asset Management Inc. | 12 016 | 5,05 | 329 | 13,10 | ||||
| 2025-08-12 | 13F | Proequities, Inc. | 0 | 0 | ||||||
| 2025-07-24 | 13F | Robertson Stephens Wealth Management, LLC | 152 959 | 10,04 | 4 183 | 18,60 | ||||
| 2025-08-19 | 13F | Cape Investment Advisory, Inc. | 41 908 | 8,43 | 1 146 | 16,94 | ||||
| 2025-07-17 | 13F | Janney Montgomery Scott LLC | 12 360 | 4,22 | 0 | |||||
| 2025-07-30 | 13F | OMC Financial Services LTD | 93 405 | 2 555 | ||||||
| 2025-07-22 | 13F | Carolina Wealth Advisors, LLC | 1 086 | 30 | ||||||
| 2025-07-25 | 13F | Cwm, Llc | 964 | 0 | ||||||
| 2025-08-08 | 13F | Capital Investment Advisory Services, LLC | 200 | 0,00 | 5 | 0,00 | ||||
| 2025-08-14 | 13F | Clarity Capital Advisors, LLC | 15 550 | 0,00 | 425 | 7,87 | ||||
| 2025-08-25 | NP | SWKRX - Schwab Monthly Income Fund - Enhanced Payout This fund is a listed as child fund of Charles Schwab Investment Management Inc and if that institution has disclosed ownership in this security, then these positions will not be double counted when calculating total shares and total value | 493 862 | −7,46 | 13 507 | −0,28 | ||||
| 2025-08-07 | 13F | Allworth Financial LP | 1 614 | 0,00 | 44 | 4,76 | ||||
| 2025-05-08 | 13F | LGT Financial Advisors LLC | 0 | −100,00 | 0 | |||||
| 2025-08-12 | 13F | Cowa, Llc | 16 955 | 6,85 | 464 | 15,17 | ||||
| 2025-08-14 | 13F | Peapack Gladstone Financial Corp | 15 800 | −0,63 | 0 | |||||
| 2025-04-28 | 13F | Private Trust Co Na | 0 | −100,00 | 0 | |||||
| 2025-07-16 | 13F/A | CX Institutional | 800 | 0,00 | 0 | |||||
| 2025-08-14 | 13F | Goldman Sachs Group Inc | 14 958 | 409 | ||||||
| 2025-07-16 | 13F | Signaturefd, Llc | 82 | 0,00 | 2 | 0,00 | ||||
| 2025-07-31 | 13F | CAP Partners, LLC | 36 141 | 62,05 | 988 | 74,56 | ||||
| 2025-08-15 | 13F | First Heartland Consultants, Inc. | 0 | −100,00 | 0 | |||||
| 2025-07-11 | 13F | Myecfo, Llc | 22 639 | −6,68 | 619 | 0,65 | ||||
| 2025-08-12 | 13F | Steward Partners Investment Advisory, Llc | 6 544 | 0,00 | 179 | 7,23 | ||||
| 2025-07-28 | 13F | Mutual Advisors, LLC | 160 971 | 4,92 | 4 444 | 11,29 | ||||
| 2025-08-06 | 13F | Souders Financial Advisors | 17 174 | −48,95 | 470 | −45,02 | ||||
| 2025-04-23 | 13F | Golden State Wealth Management, LLC | 0 | −100,00 | 0 | |||||
| 2025-08-04 | 13F | Assetmark, Inc | 887 | −70,04 | 24 | −68,00 | ||||
| 2025-08-08 | 13F | Gts Securities Llc | 16 992 | 465 | ||||||
| 2025-08-14 | 13F | C M Bidwell & Associates Ltd | 960 | 0,00 | 26 | 8,33 | ||||
| 2025-07-15 | 13F | Cranbrook Wealth Management, LLC | 218 | 6 | ||||||
| 2025-05-02 | 13F | BlackRock, Inc. | 0 | −100,00 | 0 | −100,00 | ||||
| 2025-05-14 | 13F | Change Path, LLC | 0 | −100,00 | 0 | |||||
| 2025-07-16 | 13F | Strategic Investment Solutions, Inc. /IL | 2 035 | −52,59 | 56 | −49,07 | ||||
| 2025-08-07 | 13F | Parkside Financial Bank & Trust | 1 000 | 0,00 | 27 | 8,00 | ||||
| 2025-08-14 | 13F | Bank Of America Corp /de/ | 313 387 | 38,19 | 8 571 | 48,93 | ||||
| 2025-08-13 | 13F | Cresset Asset Management, LLC | 3 224 309 | 1,61 | 88 185 | 9,50 | ||||
| 2025-08-11 | 13F | Resurgent Financial Advisors LLC | 9 678 | 265 | ||||||
| 2025-08-14 | 13F | Modern Wealth Management, LLC | 145 186 | −1,66 | 3 971 | 5,98 | ||||
| 2025-08-14 | 13F | Acorn Wealth Advisors, LLC | 20 445 | 5,85 | 559 | 14,08 | ||||
| 2025-05-09 | 13F | Atria Wealth Solutions, Inc. | 0 | −100,00 | 0 | |||||
| 2025-08-13 | 13F | Cerity Partners LLC | 9 775 | −53,16 | 267 | −49,53 | ||||
| 2025-08-13 | 13F | Flow Traders U.s. Llc | 0 | −100,00 | 0 | |||||
| 2025-07-15 | 13F | Fifth Third Bancorp | 1 151 | 11,32 | 31 | 19,23 | ||||
| 2025-08-12 | 13F | MAI Capital Management | 127 941 | −1,80 | 3 499 | 5,84 | ||||
| 2025-08-08 | 13F | ProVise Management Group, LLC | 31 401 | −0,14 | 859 | 7,52 | ||||
| 2025-08-14 | 13F | Royal Bank Of Canada | 57 983 | −34,39 | 1 586 | −29,29 | ||||
| 2025-08-14 | 13F | Guardian Wealth Advisors, Llc / Nc | 1 | 0 | ||||||
| 2025-07-31 | 13F | CVA Family Office, LLC | 8 484 | 0,18 | 232 | 8,41 | ||||
| 2025-07-11 | 13F | LongView Wealth Management | 166 623 | 6,27 | 4 557 | 14,53 | ||||
| 2025-08-05 | 13F | NewSquare Capital LLC | 1 | 0 | ||||||
| 2025-08-13 | 13F | Beacon Pointe Advisors, LLC | 7 555 | 207 | ||||||
| 2025-07-22 | 13F/A | Red Mountain Financial, LLC | 130 993 | 3,06 | 3 583 | 11,07 | ||||
| 2025-08-08 | 13F | Avantax Advisory Services, Inc. | 17 588 | 55,10 | 481 | 67,60 | ||||
| 2025-07-10 | 13F | Wedmont Private Capital | 39 549 | 3,25 | 1 088 | 14,66 | ||||
| 2025-08-14 | 13F | Stifel Financial Corp | 141 210 | −13,56 | 3 862 | −6,83 | ||||
| 2025-04-30 | 13F | Synergy Investment Management, LLC | 0 | −100,00 | 0 | |||||
| 2025-07-21 | 13F | Asset Advisors Investment Management, LLC | 17 446 | −92,65 | 477 | −92,08 | ||||
| 2025-07-11 | 13F | Farther Finance Advisors, LLC | 1 168 | 32 | ||||||
| 2025-05-07 | 13F | Motco | 0 | −100,00 | 0 | |||||
| 2025-08-14 | 13F | Fmr Llc | 2 650 | −13,14 | 72 | −6,49 | ||||
| 2025-08-12 | 13F | Martin Worley Group | 181 686 | 6,58 | 4 969 | 14,86 | ||||
| 2025-08-11 | 13F | PFG Private Wealth Management, LLC | 0 | −100,00 | 0 | |||||
| 2025-08-14 | 13F | Citadel Advisors Llc | 0 | −100,00 | 0 | |||||
| 2025-04-29 | 13F | Financial Network Wealth Management LLC | 2 234 | 0 | ||||||
| 2025-07-22 | 13F | Sage Investment Counsel LLC | 7 390 | 202 | ||||||
| 2025-05-08 | 13F | Plante Moran Financial Advisors, LLC | 0 | 0 | ||||||
| 2025-08-12 | 13F | Jaffetilchin Investment Partners, LLC | 12 350 | 51,98 | 338 | 63,59 | ||||
| 2025-08-13 | 13F | Per Stirling Capital Management, LLC. | 21 834 | 3,88 | 597 | 12,01 | ||||
| 2025-07-10 | 13F | Wealth Enhancement Advisory Services, Llc | 67 506 | 6,18 | 1 856 | 15,07 | ||||
| 2025-08-07 | 13F | Cahill Financial Advisors Inc | 79 564 | 14,86 | 2 176 | 23,78 | ||||
| 2025-08-12 | 13F | LPL Financial LLC | 224 619 | 10,00 | 6 143 | 18,54 | ||||
| 2025-08-14 | 13F | Citadel Advisors Llc | Call | 0 | −100,00 | 0 | ||||
| 2025-08-25 | NP | SWLRX - Schwab Monthly Income Fund - Maximum Payout This fund is a listed as child fund of Charles Schwab Investment Management Inc and if that institution has disclosed ownership in this security, then these positions will not be double counted when calculating total shares and total value | 242 236 | −8,68 | 6 625 | −1,59 | ||||
| 2025-09-02 | 13F/A | FSC Wealth Advisors, LLC | 14 159 | −4,07 | 387 | 3,48 | ||||
| 2025-07-22 | 13F | Red Tortoise LLC | 5 667 | 1,29 | 155 | 8,45 | ||||
| 2025-08-12 | 13F | Asset Management Group, Inc. | 9 437 | 15,95 | 258 | 25,24 | ||||
| 2025-07-25 | 13F | Lodestar Private Asset Management Llc | 34 620 | −11,96 | 947 | −5,21 | ||||
| 2025-08-19 | 13F | Anchor Investment Management, LLC | 2 824 | 29,13 | 77 | 40,00 | ||||
| 2025-08-11 | 13F | Principal Securities, Inc. | 970 | 0,00 | 27 | 18,18 | ||||
| 2025-07-21 | 13F | Ameriflex Group, Inc. | 258 | 0,00 | 7 | 16,67 | ||||
| 2025-08-11 | 13F | HighTower Advisors, LLC | 516 212 | 6,75 | 14 118 | 15,04 |