Grundläggande statistik
| Institutionella ägare | 216 total, 215 long only, 0 short only, 1 long/short - change of 8,50% MRQ |
| Genomsnittlig portföljallokering | 0.4410 % - change of −6,05% MRQ |
| Institutionella aktier (lång) | 73 162 994 (ex 13D/G) - change of 2,75MM shares 3,91% MRQ |
| Institutionellt värde (lång) | $ 2 173 820 USD ($1000) |
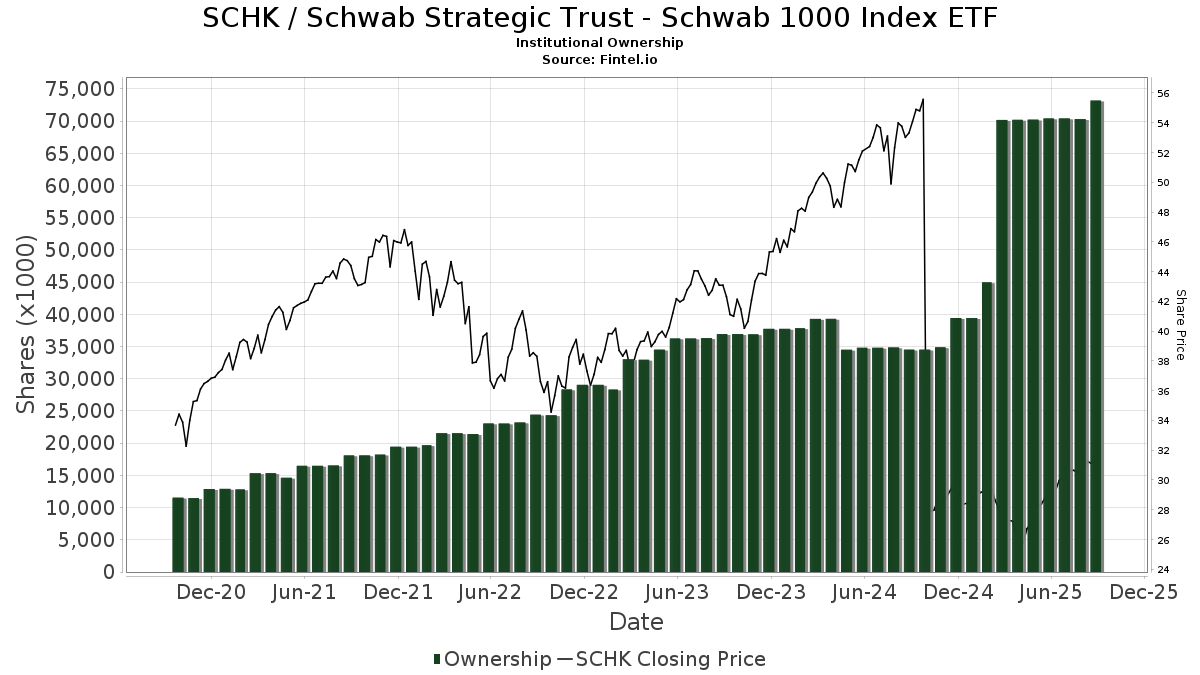
Institutionellt ägande och aktieägare
Schwab Strategic Trust - Schwab 1000 Index ETF (US:SCHK) har 216 Institutionella ägare och aktieägare som har lämnat in 13D/G- eller 13F-formulär till Securities Exchange Commission (SEC). Dessa institut innehar totalt 73,162,994 aktier. Största aktieägare inkluderar Financial Engines Advisors L.L.C., Legacy Wealth Management, Inc, Warwick Investment Management, Inc., Creative Planning, Armstrong Advisory Group, Inc, Waddell & Associates, Llc, Plum Street Advisors, LLC, Colony Group, LLC, Charles Schwab Investment Management Inc, and Goldman Sachs Group Inc .
Schwab Strategic Trust - Schwab 1000 Index ETF (ARCA:SCHK) Institutionell ägarstruktur visar institutioners och fonders nuvarande positioner i företaget, samt de senaste förändringarna i positionernas storlek. Större aktieägare kan vara enskilda investerare, fonder, hedgefonder eller institutioner. Bilaga 13D visar att investeraren äger (eller ägde) mer än 5% av företaget och avser (eller avsåg) att aktivt eftersträva en förändring av affärsstrategin. Schedule 13G indikerar en passiv investering på över 5%.
The share price as of September 16, 2025 is 31,87 / share. Previously, on September 17, 2024, the share price was 27,12 / share. This represents an increase of 17,49% over that period.
Fondsentimentets poäng
Fondsentimentet poängen(fka Ägarackumulation-poäng) visar vilka aktier som är mest köpta av fonder. Det är resultatet av en sofistikerad kvantitativ flerfaktormodell som identifierar företag med de högsta nivåerna av institutionell ackumulering. Poängsättningsmodellen använder en kombination av den totala ökningen av redovisade ägare, förändringarna i portföljallokeringarna för dessa ägare och andra mått. Siffran sträcker sig från 0 till 100, där högre siffror indikerar en högre nivå av ackumulering i förhållande till sina konkurrenter, och 50 är genomsnittet.
Uppdateringsfrekvens: Dagligen
Se Ownership Explorer, som innehåller en lista över de högst rankade företagen.
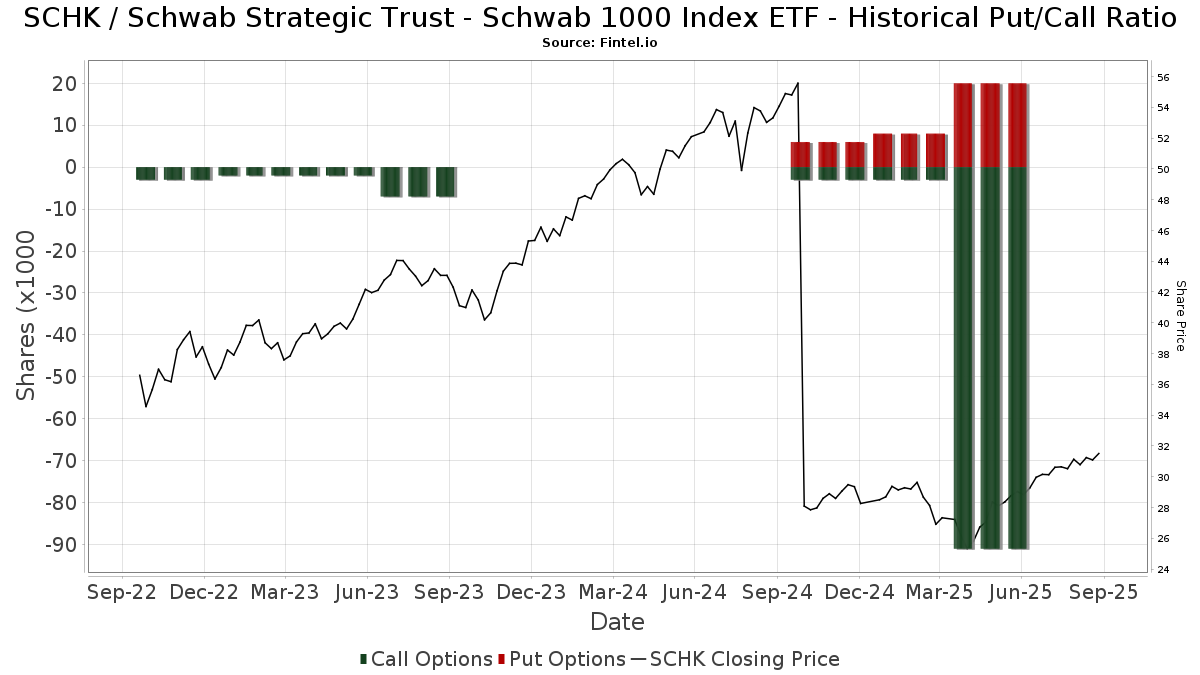
Institutionell sälj/köp-kvot
Förutom att rapportera vanliga eget kapital- och skuldemissioner måste institutioner med mer än 100MM tillgångar under förvaltning också avslöja sina innehav av sälj- och köpoptioner. Eftersom säljoptioner i allmänhet indikerar ett negativt sentiment och köpoptioner indikerar ett positivt sentiment, kan vi få en uppfattning om det övergripande institutionella sentimentet genom att plotta förhållandet mellan säljoptioner och köpoptioner. Diagrammet till höger visar det historiska förhållandet mellan sälj- och köpoptioner för detta instrument.
Genom att använda sälj/köp-kvoten som en indikator på aktieägarnas sentiment undviker man en av de största bristerna med att använda det totala institutionella ägandet, nämligen att en betydande del av de förvaltade tillgångarna investeras passivt för att följa index. Passivt förvaltade fonder köper vanligtvis inte optioner, så indikatorn för sälj/köp-kvoten ger en bättre bild av stämningen i aktivt förvaltade fonder.
13F- och NPORT-arkiveringar
Detaljer om 13F-arkiveringar är gratis. Detaljer om NP-arkiveringar kräver ett premiummedlemskap. Gröna rader indikerar nya positioner. Röda rader indikerar stängda positioner. Klicka på länk symbolen för att se hela transaktionshistoriken.
Uppgradera
för att låsa upp premiumdata och exportera till Excel ![]() .
.
| Fil Datum | Källa | Investerare | Typ | Genomsnittligt pris (beräknat) |
Aktier | Δ Aktier (%) |
Rapporterat värde (1000 USD) |
Δ Värde (%) |
Portföljallokering (%) |
|
|---|---|---|---|---|---|---|---|---|---|---|
| 2025-08-05 | 13F | Bank Of Montreal /can/ | 6 772 | −0,50 | 202 | 9,84 | ||||
| 2025-08-15 | 13F | Tower Research Capital LLC (TRC) | 15 | −99,84 | 0 | −100,00 | ||||
| 2025-07-30 | 13F | Atlantic Edge Private Wealth Management, LLC | 0 | 0 | ||||||
| 2025-07-10 | 13F | ARS Wealth Advisors Group, LLC | 10 009 | 0,29 | 298 | 11,19 | ||||
| 2025-07-31 | 13F | Leavell Investment Management, Inc. | 13 445 | −0,37 | 401 | 10,19 | ||||
| 2025-08-12 | 13F | Charles Schwab Investment Management Inc | 422 373 | 12 595 | ||||||
| 2025-08-14 | 13F | Two Sigma Securities, Llc | 6 870 | −20,54 | 205 | −12,07 | ||||
| 2025-04-16 | 13F | Thomasville National Bank | 0 | −100,00 | 0 | −100,00 | ||||
| 2025-08-14 | 13F | Raymond James Financial Inc | 48 307 | 1,57 | 1 441 | 12,50 | ||||
| 2025-07-31 | 13F | Cambridge Investment Research Advisors, Inc. | 9 782 | 0,46 | 0 | |||||
| 2025-05-09 | 13F | CoreCap Advisors, LLC | 0 | −100,00 | 0 | |||||
| 2025-08-14 | 13F | Avant Capital LLC | 26 950 | −3,99 | 804 | 6,36 | ||||
| 2025-07-29 | 13F | Manchester Financial Inc | 7 450 | 0,00 | 222 | 11,00 | ||||
| 2025-08-14 | 13F | Warren Averett Asset Management, LLC | 11 431 | −2,92 | 341 | 7,59 | ||||
| 2025-07-31 | 13F | Brighton Jones Llc | 13 617 | 406 | ||||||
| 2025-07-16 | 13F | Signature Resources Capital Management, LLC | 50 | 0,00 | 1 | 0,00 | ||||
| 2025-08-08 | 13F | Accredited Investors Inc. | 8 735 | 0,05 | 260 | 10,64 | ||||
| 2025-07-18 | 13F | SigFig Wealth Management, LLC | 26 167 | 41,24 | 776 | 56,77 | ||||
| 2025-08-14 | 13F | Mercer Global Advisors Inc /adv | 15 751 | 470 | ||||||
| 2025-08-18 | 13F | Geneos Wealth Management Inc. | 200 | 6 | ||||||
| 2025-08-11 | 13F | VSM Wealth Advisory, LLC | 402 | 0,25 | 12 | 20,00 | ||||
| 2025-07-09 | 13F | Breakwater Investment Management | 1 174 | 0,00 | 35 | 12,90 | ||||
| 2025-07-24 | 13F | Bernard Wealth Management Corp. | 750 | 0,00 | 22 | 10,00 | ||||
| 2025-07-30 | 13F | Mid-American Wealth Advisory Group, Inc. | 807 | 24 | ||||||
| 2025-08-13 | 13F | Russell Investments Group, Ltd. | 4 200 | 5,74 | 125 | 17,92 | ||||
| 2025-07-11 | 13F | Kingstone Capital Partners Texas, LLC | 105 096 | 4 | ||||||
| 2025-08-11 | 13F | Plum Street Advisors, LLC | 710 335 | −4,73 | 21 182 | 5,53 | ||||
| 2025-08-08 | 13F | Pnc Financial Services Group, Inc. | 710 | 0,00 | 21 | 10,53 | ||||
| 2025-07-23 | 13F | Opulen Financial Group LLC | 30 302 | 43,31 | 904 | 58,70 | ||||
| 2025-08-14 | 13F | Financial Engines Advisors L.L.C. | 46 607 159 | −0,78 | 1 389 825 | 9,91 | ||||
| 2025-08-14 | 13F | Engineers Gate Manager LP | 0 | −100,00 | 0 | |||||
| 2025-05-16 | 13F | Coppell Advisory Solutions LLC | 0 | −100,00 | 0 | |||||
| 2025-08-04 | 13F | HBK Sorce Advisory LLC | 126 274 | −5,86 | 3 765 | 4,26 | ||||
| 2025-07-15 | 13F | Bannerman Wealth Management Group, Llc | 9 427 | −2,64 | 281 | 8,08 | ||||
| 2025-07-23 | 13F | True Vision MN LLC | 8 000 | 0,00 | 239 | 10,70 | ||||
| 2025-07-21 | 13F | Crews Bank & Trust | 826 | 0,00 | 25 | 9,09 | ||||
| 2025-07-22 | 13F | Red Tortoise LLC | 34 963 | 0,08 | 1 043 | 10,85 | ||||
| 2025-08-08 | 13F | TD Capital Management LLC | 4 927 | 0,28 | 147 | 10,61 | ||||
| 2025-07-11 | 13F | Diversified Trust Co | 36 084 | 1 076 | ||||||
| 2025-08-11 | 13F | Anfield Capital Management, LLC | 134 | 0,00 | 4 | 0,00 | ||||
| 2025-08-04 | 13F | Hantz Financial Services, Inc. | 96 | 0,00 | 0 | |||||
| 2025-08-04 | 13F | Quaker Wealth Management, LLC | 210 | 6 | ||||||
| 2025-08-14 | 13F | GWM Advisors LLC | 2 949 | 0,03 | 88 | 10,13 | ||||
| 2025-08-13 | 13F | Kilter Group LLC | 595 | 18 | ||||||
| 2025-08-06 | 13F | Commonwealth Equity Services, Llc | 37 410 | −21,04 | 1 | 0,00 | ||||
| 2025-08-12 | 13F | Kohmann Bosshard Financial Services, LLC | 61 008 | 0,00 | 1 819 | 10,78 | ||||
| 2025-07-15 | 13F | Evanson Asset Management, LLC | 31 431 | 0,03 | 937 | 10,89 | ||||
| 2025-08-01 | 13F | Brookwood Investment Group LLC | 48 138 | −10,80 | 1 435 | −1,17 | ||||
| 2025-08-14 | 13F | Mariner, LLC | 307 814 | −0,74 | 9 179 | 9,94 | ||||
| 2025-08-11 | 13F | Aptus Capital Advisors, LLC | 76 840 | 1,51 | 2 291 | 12,47 | ||||
| 2025-08-12 | 13F | SRS Capital Advisors, Inc. | 3 969 | −5,21 | 118 | 5,36 | ||||
| 2025-07-24 | 13F | Costello Asset Management, INC | 1 568 | −0,57 | 47 | 9,52 | ||||
| 2025-08-14 | 13F | Wells Fargo & Company/mn | 909 | 0,00 | 27 | 12,50 | ||||
| 2025-08-08 | 13F | Glassman Wealth Services | 2 | 0,00 | 0 | |||||
| 2025-08-06 | 13F | Kcm Investment Advisors Llc | 9 712 | 0,00 | 290 | 10,73 | ||||
| 2025-08-01 | 13F | Envestnet Asset Management Inc | 11 872 | 40,98 | 354 | 56,64 | ||||
| 2025-08-11 | 13F | HighTower Advisors, LLC | 25 667 | 10,11 | 765 | 22,01 | ||||
| 2025-07-15 | 13F | DB Fitzpatrick & Co, Inc | 191 | 0,00 | 6 | 0,00 | ||||
| 2025-08-14 | 13F | Federation des caisses Desjardins du Quebec | 400 | 0,00 | 12 | 10,00 | ||||
| 2025-07-28 | 13F | Harbour Investments, Inc. | 3 921 | 3,37 | 117 | 13,73 | ||||
| 2025-08-06 | 13F | North Capital, Inc. | 564 | 0,36 | 17 | 6,67 | ||||
| 2025-08-13 | 13F | Grantvest Financial Group LLC | 6 777 | 202 | ||||||
| 2025-05-12 | 13F | NWK Group, Inc. | 0 | −100,00 | 0 | |||||
| 2025-07-24 | 13F | Jfs Wealth Advisors, Llc | 394 | 0,00 | 12 | 10,00 | ||||
| 2025-07-17 | 13F | Venture Visionary Partners LLC | 7 303 | 218 | ||||||
| 2025-07-24 | 13F | IFP Advisors, Inc | 3 509 | −6,65 | 105 | 2,97 | ||||
| 2025-05-15 | 13F | Windsor Advisory Group, LLC | 0 | −100,00 | 0 | |||||
| 2025-07-15 | 13F | MCF Advisors LLC | 8 000 | 0,00 | 239 | 10,70 | ||||
| 2025-07-22 | 13F | Miracle Mile Advisors, LLC | 8 220 | 0,51 | 245 | 11,36 | ||||
| 2025-08-12 | 13F | CIBC Private Wealth Group, LLC | 3 700 | 0,00 | 110 | 25,00 | ||||
| 2025-07-14 | 13F | Armstrong Advisory Group, Inc | 2 436 076 | −7,49 | 72 644 | −2,55 | ||||
| 2025-07-17 | 13F | Legacy Wealth Management, Inc | 6 650 328 | −3,53 | 198 313 | 6,86 | ||||
| 2025-08-14 | 13F | Main Street Financial Solutions, LLC | 394 821 | 16,07 | 11 774 | 28,58 | ||||
| 2025-08-06 | 13F | SOUTH STATE Corp | 35 212 | −18,88 | 1 050 | −10,10 | ||||
| 2025-07-22 | 13F | Red Door Wealth Management, LLC | 9 109 | 0,04 | 272 | 10,61 | ||||
| 2025-07-14 | 13F | GAMMA Investing LLC | 18 364 | 0,00 | 548 | 10,73 | ||||
| 2025-07-22 | 13F | Merit Financial Group, LLC | 33 995 | −15,41 | 1 014 | −6,29 | ||||
| 2025-07-22 | 13F | SOL Capital Management CO | 19 000 | 0,00 | 1 | |||||
| 2025-07-29 | 13F | BKD Wealth Advisors, LLC | 7 937 | 237 | ||||||
| 2025-07-24 | 13F | Blair William & Co/il | 6 124 | −10,10 | 183 | −0,55 | ||||
| 2025-08-14 | 13F | Jane Street Group, Llc | 0 | −100,00 | 0 | |||||
| 2025-08-14 | 13F | Goldman Sachs Group Inc | 421 110 | 1 703,70 | 12 558 | 1 899,52 | ||||
| 2025-08-04 | 13F | Spinnaker Trust | 7 244 | 216 | ||||||
| 2025-07-08 | 13F | Zrc Wealth Management, Llc | 30 757 | 361,54 | 917 | 412,29 | ||||
| 2025-07-22 | 13F | Gemmer Asset Management LLC | 28 934 | 58,56 | 863 | 75,56 | ||||
| 2025-07-30 | 13F | Crewe Advisors LLC | 20 153 | 0,11 | 601 | 10,91 | ||||
| 2025-08-15 | 13F | Morgan Stanley | 81 186 | 2,29 | 2 421 | 13,30 | ||||
| 2025-08-05 | 13F | Integrity Financial Corp /WA | 20 | 900,00 | 1 | |||||
| 2025-08-14 | 13F | Bank Of America Corp /de/ | 191 034 | −0,75 | 5 697 | 9,94 | ||||
| 2025-07-23 | 13F | Ironwood Financial, llc | 8 752 | 0,00 | 236 | 0,00 | ||||
| 2025-08-12 | 13F | Armor Investment Advisors, LLC | 43 | 16,22 | 1 | |||||
| 2025-07-25 | 13F | Welch Group, LLC | 14 380 | 0,00 | 429 | 11,46 | ||||
| 2025-04-28 | 13F | Salomon & Ludwin, LLC | 0 | −100,00 | 0 | −100,00 | ||||
| 2025-07-03 | 13F | Collective Family Office Llc | 22 650 | −17,67 | 675 | −8,78 | ||||
| 2025-07-11 | 13F | Sherrill & Hutchins Financial Advisory, Inc | 36 684 | 0,00 | 1 094 | 10,74 | ||||
| 2025-07-18 | 13F | Bartlett & Co. Wealth Management Llc | 3 275 | 0,31 | 98 | 11,49 | ||||
| 2025-08-07 | 13F | Everhart Financial Group, Inc. | 37 412 | 22,39 | 1 116 | 35,64 | ||||
| 2025-08-11 | 13F | Blue Bell Private Wealth Management, Llc | 13 752 | −1,45 | 410 | 9,33 | ||||
| 2025-08-14 | 13F | Guardian Wealth Advisors, Llc / Nc | 76 840 | 1,51 | 2 291 | 12,47 | ||||
| 2025-08-04 | 13F | Assetmark, Inc | 420 | 94,44 | 13 | 140,00 | ||||
| 2025-08-14 | 13F | Comerica Bank | 19 866 | 4,33 | 592 | 15,63 | ||||
| 2025-07-24 | 13F | Ronald Blue Trust, Inc. | 601 | 0,00 | 18 | 6,25 | ||||
| 2025-08-14 | 13F | Visionary Wealth Advisors | 28 084 | −1,10 | 837 | 9,55 | ||||
| 2025-07-17 | 13F | Sound Income Strategies, LLC | 1 498 | 49,20 | 45 | 62,96 | ||||
| 2025-07-15 | 13F | McAdam, LLC | 31 079 | 140,61 | 927 | 166,86 | ||||
| 2025-08-08 | 13F | Cornerstone Advisors Asset Management, Inc | 84 123 | 13,64 | 2 509 | 25,90 | ||||
| 2025-08-12 | 13F | MAI Capital Management | 110 935 | 0,00 | 3 308 | 10,78 | ||||
| 2025-04-22 | 13F | Synergy Financial Management, LLC | 0 | −100,00 | 0 | |||||
| 2025-08-13 | 13F | Brown Advisory Inc | 26 000 | 0,00 | 775 | 10,87 | ||||
| 2025-08-01 | 13F | Y-Intercept (Hong Kong) Ltd | 27 625 | 824 | ||||||
| 2025-08-14 | 13F | Stifel Financial Corp | 25 394 | 239,13 | 757 | 276,62 | ||||
| 2025-08-15 | 13F | CI Private Wealth, LLC | 24 858 | 70,00 | 741 | 88,55 | ||||
| 2025-04-29 | NP | OCIO - ClearShares OCIO ETF | 161 518 | 1,16 | 4 627 | −0,81 | ||||
| 2025-08-14 | 13F | Fmr Llc | 79 081 | 4,15 | 2 358 | 15,42 | ||||
| 2025-08-14 | 13F | Royal Bank Of Canada | 7 765 | −14,82 | 231 | −5,71 | ||||
| 2025-08-08 | 13F | Meridian Wealth Management, LLC | 9 628 | 0,08 | 287 | 11,24 | ||||
| 2025-08-08 | 13F | Omega Financial Group, LLC | 8 851 | 0,23 | 264 | 10,97 | ||||
| 2025-08-13 | 13F | D L Carlson Investment Group Inc | 17 850 | 0,29 | 532 | 11,06 | ||||
| 2025-08-12 | 13F | LPL Financial LLC | 153 283 | 19,24 | 4 571 | 32,08 | ||||
| 2025-07-09 | 13F | Massmutual Trust Co Fsb/adv | 20 | 0,00 | 1 | |||||
| 2025-05-09 | 13F | Strategic Investment Solutions, Inc. /IL | 0 | −100,00 | 0 | |||||
| 2025-08-13 | 13F | My Purposeful Wealth Corp. | 12 231 | 373 | ||||||
| 2025-08-13 | 13F | Northwestern Mutual Wealth Management Co | 43 531 | −17,42 | 1 298 | −8,53 | ||||
| 2025-07-30 | 13F | Bogart Wealth, LLC | 624 | 0,00 | 19 | 12,50 | ||||
| 2025-07-29 | 13F | Chicago Partners Investment Group LLC | 15 063 | −0,04 | 461 | 13,27 | ||||
| 2025-08-13 | 13F | Capital Analysts, Inc. | 507 | 0,40 | 0 | |||||
| 2025-07-22 | 13F | Warwick Investment Management, Inc. | 4 087 699 | 0,13 | 121 895 | 10,92 | ||||
| 2025-04-25 | 13F | Mather Group, Llc. | 0 | −100,00 | 0 | |||||
| 2025-07-22 | 13F | Schwab Charitable Fund | 120 288 | 0,00 | 3 587 | 10,75 | ||||
| 2025-07-17 | 13F | Halbert Hargrove Global Advisors, Llc | 3 510 | 0,00 | 105 | 10,64 | ||||
| 2025-08-05 | 13F | Blue Barn Wealth, LLC | 7 170 | 214 | ||||||
| 2025-08-14 | 13F | Destination Wealth Management | 0 | −100,00 | 0 | |||||
| 2025-08-15 | 13F | Equitable Holdings, Inc. | 20 932 | 624 | ||||||
| 2025-08-14 | 13F | Susquehanna International Group, Llp | 77 671 | 113,96 | 2 316 | 137,05 | ||||
| 2025-08-14 | 13F | UBS Group AG | 9 100 | −1,62 | 271 | 8,84 | ||||
| 2025-08-05 | 13F | Simplex Trading, Llc | 4 140 | 0 | ||||||
| 2025-08-12 | 13F | O'shaughnessy Asset Management, Llc | 412 | 0,00 | 12 | 9,09 | ||||
| 2025-07-31 | 13F | Blue Sky Capital Consultants Group, Inc. | 25 739 | −1,56 | 768 | 9,10 | ||||
| 2025-07-10 | 13F | YHB Investment Advisors, Inc. | 10 980 | 0,02 | 327 | 10,51 | ||||
| 2025-07-25 | 13F | Atria Wealth Solutions, Inc. | 0 | −100,00 | 0 | |||||
| 2025-07-23 | 13F | Richardson Capital Management LLC | 89 045 | 43,40 | 2 655 | 58,89 | ||||
| 2025-08-08 | 13F | Creative Planning | 3 092 202 | 262,00 | 92 209 | 301,01 | ||||
| 2025-08-08 | 13F | Kaizen Financial Strategies | 16 562 | 0,00 | 494 | 10,79 | ||||
| 2025-04-25 | 13F | Morton Brown Family Wealth, LLC | 0 | −100,00 | 0 | |||||
| 2025-08-07 | 13F | Resources Investment Advisors, LLC. | 12 125 | 3,04 | 362 | 14,24 | ||||
| 2025-07-14 | 13F | U.S. Capital Wealth Advisors, LLC | 13 618 | 0,00 | 406 | 10,93 | ||||
| 2025-07-23 | 13F | Element Wealth, LLC | 7 024 | 209 | ||||||
| 2025-07-22 | 13F | Old National Bancorp /in/ | 23 064 | 0,00 | 688 | 10,81 | ||||
| 2025-08-12 | 13F | Choate Investment Advisors | 870 | 26 | ||||||
| 2025-08-12 | 13F | AlphaCore Capital LLC | 3 696 | 15,64 | 110 | 27,91 | ||||
| 2025-07-09 | 13F | Parkside Advisors LLC | 116 215 | −3,26 | 3 466 | 7,18 | ||||
| 2025-05-08 | 13F | Plante Moran Financial Advisors, LLC | 0 | 0 | ||||||
| 2025-07-17 | 13F | Beacon Capital Management, LLC | 52 | 0,00 | 2 | 0,00 | ||||
| 2025-08-08 | 13F | Cetera Investment Advisers | 69 793 | 0,87 | 2 081 | 11,76 | ||||
| 2025-08-11 | 13F | Hexagon Capital Partners LLC | 0 | −100,00 | 0 | |||||
| 2025-07-21 | 13F | Empirical Financial Services, LLC d.b.a. Empirical Wealth Management | 9 281 | −11,16 | 277 | −1,78 | ||||
| 2025-08-12 | 13F | Long Island Wealth Management, Inc. | 6 800 | 203 | ||||||
| 2025-08-08 | 13F | Larson Financial Group LLC | 1 000 | 30 | ||||||
| 2025-08-05 | 13F | Key FInancial Inc | 2 197 | 0,00 | 66 | 10,17 | ||||
| 2025-09-04 | 13F/A | Advisor Group Holdings, Inc. | 19 575 | 51,66 | 584 | 68,01 | ||||
| 2025-07-14 | 13F | Lighthouse Wealth Management Inc. | 344 735 | 0,33 | 10 280 | 11,14 | ||||
| 2025-07-25 | 13F | Cwm, Llc | 425 | −10,71 | 0 | |||||
| 2025-08-11 | 13F | Bell Investment Advisors, Inc | 516 | 0,19 | 15 | 15,38 | ||||
| 2025-07-31 | 13F | Buckingham Strategic Partners | 8 807 | 263 | ||||||
| 2025-08-14 | 13F | Colony Group, LLC | 480 348 | −1,07 | 14 324 | 9,59 | ||||
| 2025-07-24 | 13F | Us Bancorp \de\ | 217 159 | 38,12 | 6 476 | 53,00 | ||||
| 2025-08-14 | 13F | Mml Investors Services, Llc | 78 759 | 4,31 | 2 | 0,00 | ||||
| 2025-08-14 | 13F | Glen Eagle Advisors, LLC | 40 | 0,00 | 1 | 0,00 | ||||
| 2025-07-24 | 13F | Brucke Financial, Inc. | 9 659 | 3,94 | 288 | 16,13 | ||||
| 2025-08-11 | 13F | Rothschild Investment Llc | 4 880 | 0,00 | 146 | 10,69 | ||||
| 2025-08-15 | 13F | Kestra Advisory Services, LLC | 9 342 | 0,00 | 279 | 10,76 | ||||
| 2025-08-18 | 13F/A | National Bank Of Canada /fi/ | 2 572 | 0,00 | 77 | 10,14 | ||||
| 2025-08-14 | 13F | Blue Capital, Inc. | 86 230 | 2 571 | ||||||
| 2025-08-15 | 13F | Captrust Financial Advisors | 78 522 | −2,13 | 2 342 | 8,43 | ||||
| 2025-08-08 | 13F | Hartland & Co., LLC | 33 313 | 7,13 | 993 | 18,64 | ||||
| 2025-07-21 | 13F | Pflug Koory, LLC | 4 836 | 0,00 | 144 | 10,77 | ||||
| 2025-08-14 | 13F | Integrated Wealth Concepts LLC | 10 508 | 22,02 | 313 | 35,50 | ||||
| 2025-08-12 | 13F | Jpmorgan Chase & Co | 17 110 | 50,83 | 510 | 67,21 | ||||
| 2025-07-28 | 13F | Axxcess Wealth Management, Llc | 0 | −100,00 | 0 | |||||
| 2025-07-18 | 13F | SMI Advisory Services, LLC | 19 633 | 0,01 | 592 | 24,16 | ||||
| 2025-08-12 | 13F | Waddell & Associates, Llc | 1 987 028 | −0,36 | 59 253 | 10,37 | ||||
| 2025-08-14 | 13F | Ancora Advisors, LLC | 22 916 | 0,00 | 683 | 10,88 | ||||
| 2025-07-29 | 13F | Signature Estate & Investment Advisors Llc | 201 803 | 0,81 | 6 018 | 11,67 | ||||
| 2025-08-14 | 13F | McIlrath & Eck, LLC | 3 738 | 0,00 | 111 | 11,00 | ||||
| 2025-08-14 | 13F | Citadel Advisors Llc | Call | 91 700 | 2 765,62 | 2 734 | 3 079,07 | |||
| 2025-04-28 | 13F | Strategic Financial Concepts, LLC | 0 | −100,00 | 0 | −100,00 | ||||
| 2025-08-14 | 13F | Millennium Management Llc | 0 | −100,00 | 0 | |||||
| 2025-07-16 | 13F | Vestia Personal Wealth Advisors | 8 042 | −0,90 | 240 | 9,63 | ||||
| 2025-07-24 | 13F | Robertson Stephens Wealth Management, LLC | 9 290 | 0,00 | 277 | 10,80 | ||||
| 2025-08-14 | 13F | Bnp Paribas Arbitrage, Sa | 0 | −100,00 | 0 | |||||
| 2025-07-25 | 13F | Sequoia Financial Advisors, LLC | 8 290 | 4,37 | 247 | 15,96 | ||||
| 2025-08-11 | 13F | Brown Brothers Harriman & Co | 1 960 | 58 | ||||||
| 2025-08-12 | 13F | Proequities, Inc. | 0 | 0 | ||||||
| 2025-08-14 | 13F | Two Sigma Investments, Lp | 31 200 | 930 | ||||||
| 2025-08-14 | 13F | Citadel Advisors Llc | 150 750 | 4 495 | ||||||
| 2025-07-25 | 13F | NorthRock Partners, LLC | 66 905 | −0,59 | 1 995 | 10,16 | ||||
| 2025-08-14 | 13F | Citadel Advisors Llc | Put | 20 800 | 160,00 | 620 | 188,37 | |||
| 2025-08-07 | 13F | Allworth Financial LP | 14 004 | −0,46 | 418 | 12,70 | ||||
| 2025-08-12 | 13F | Global Retirement Partners, LLC | 2 | 0,00 | 0 | |||||
| 2025-08-12 | 13F | Verity & Verity, LLC | 13 496 | 0,00 | 402 | 10,74 | ||||
| 2025-08-12 | 13F | Atlas Capital Advisors Llc | 2 154 | 0,00 | 64 | 12,28 | ||||
| 2025-08-05 | 13F | GHP Investment Advisors, Inc. | 785 | −0,13 | 23 | 9,52 | ||||
| 2025-08-11 | 13F | Heritage Wealth Advisors | 0 | 0 | ||||||
| 2025-08-06 | 13F | AE Wealth Management LLC | 4 096 | 753,33 | 122 | 916,67 | ||||
| 2025-08-11 | 13F | Citigroup Inc | 0 | −100,00 | 0 | |||||
| 2025-08-13 | 13F | Renaissance Technologies Llc | 39 400 | 6,78 | 1 175 | 18,23 | ||||
| 2025-07-28 | 13F | RFG Advisory, LLC | 0 | −100,00 | 0 | |||||
| 2025-07-16 | 13F | Signaturefd, Llc | 301 | 0,00 | 9 | 0,00 | ||||
| 2025-05-12 | 13F | Sandy Spring Bank | 1 550 | 0,06 | 42 | −4,65 | ||||
| 2025-07-15 | 13F | RVW Wealth, LLC | 9 436 | 281 | ||||||
| 2025-08-13 | 13F | Cerity Partners LLC | 114 639 | 23,77 | 3 419 | 37,10 | ||||
| 2025-07-08 | 13F | Arlington Trust Co LLC | 3 100 | 0,00 | 92 | 10,84 | ||||
| 2025-07-08 | 13F | Adamsbrown Wealth Consultants Llc | 7 131 | 213 | ||||||
| 2025-07-31 | 13F | Alamar Capital Management, LLC | 16 003 | 0,18 | 477 | 10,93 | ||||
| 2025-07-17 | 13F | HB Wealth Management, LLC | 13 800 | −1,50 | 412 | 9,02 | ||||
| 2025-08-06 | 13F | Atlantic Union Bankshares Corp | 2 847 | 85 | ||||||
| 2025-07-24 | 13F | Game Plan Financial Advisors, LLC | 202 | 0,00 | 6 | 20,00 | ||||
| 2025-08-25 | 13F/A | Promus Capital, LLC | 216 | 0,00 | 6 | 20,00 | ||||
| 2025-08-04 | 13F | Quaker Wealth Management, LLC | Put | 0 | −100,00 | 0 | −100,00 | |||
| 2025-07-23 | 13F | Prime Capital Investment Advisors, LLC | 13 183 | −82,67 | 393 | −80,81 | ||||
| 2025-08-13 | 13F | Beacon Pointe Advisors, LLC | 15 563 | 3,29 | 464 | 14,57 | ||||
| 2025-07-31 | 13F | Blake Schutter Theil Wealth Advisors, LLC | 330 530 | −7,45 | 9 856 | 2,53 | ||||
| 2025-04-28 | 13F | Pinnacle Financial Partners Inc | 2 000 | 100,00 | 57 | 1,82 | ||||
| 2025-07-03 | 13F | Fiduciary Financial Group, Llc | 39 851 | 0,21 | 1 188 | 18,23 | ||||
| 2025-08-14 | 13F | Qube Research & Technologies Ltd | 4 305 | 59,62 | 128 | 77,78 | ||||
| 2025-08-12 | 13F | Associated Banc-corp | 15 838 | 0,00 | 472 | 10,80 | ||||
| 2025-07-07 | 13F | Investors Research Corp | 1 | 0,00 | 0 | |||||
| 2025-08-08 | 13F | Bouchey Financial Group Ltd | 8 378 | 0,00 | 250 | 10,67 | ||||
| 2025-07-24 | 13F | KC Investment Advisors, LLC | 16 410 | −49,86 | 489 | −44,43 | ||||
| 2025-08-12 | 13F | Peachtree Investment Partners, LLC | 5 204 | −49,55 | 155 | −44,04 | ||||
| 2025-07-11 | 13F | Farther Finance Advisors, LLC | 11 342 | −50,16 | 338 | −44,95 | ||||
| 2025-08-14 | 13F | Headinvest, Llc | 15 794 | 0,00 | 471 | 10,59 | ||||
| 2025-08-11 | 13F | Principal Securities, Inc. | 32 | 0,00 | 1 | |||||
| 2025-07-10 | 13F | Wealth Enhancement Advisory Services, Llc | 134 480 | 512,92 | 4 061 | 588,31 | ||||
| 2025-08-07 | 13F | Vise Technologies, Inc. | 18 068 | 7,33 | 539 | 13,03 | ||||
| 2025-07-23 | 13F | Trifecta Capital Advisors, LLC | 80 | 0,00 | 2 | 0,00 | ||||
| 2025-07-24 | 13F | Capital Advisors, Ltd. LLC | 1 600 | 0,00 | 0 | |||||
| 2025-08-11 | 13F | Delta Asset Management Llc/tn | 0 | −100,00 | 0 | |||||
| 2025-08-15 | 13F | Koesten, Hirschmann & Crabtree, INC. | 20 | 0,00 | 1 | |||||
| 2025-07-08 | 13F | Heartwood Wealth Advisors LLC | 11 941 | 356 | ||||||
| 2025-08-12 | 13F | Howe & Rusling Inc | 337 | 0,30 | 10 | 11,11 | ||||
| 2025-05-14 | 13F | Fisher Asset Management, LLC | 0 | −100,00 | 0 | |||||
| 2025-07-29 | 13F | Stratos Wealth Advisors, LLC | 17 175 | −4,31 | 512 | 6,00 | ||||
| 2025-07-10 | 13F | Exchange Traded Concepts, Llc | 5 269 | 157 | ||||||
| 2025-08-14 | 13F | Cardiff Park Advisors, Llc | 4 442 | 0,00 | 132 | 10,92 | ||||
| 2025-05-14 | 13F | Bank Of Hawaii | 0 | −100,00 | 0 | |||||
| 2025-07-25 | 13F | Johnson Investment Counsel Inc | 29 623 | −1,55 | 883 | 9,01 |