Grundläggande statistik
| Institutionella ägare | 140 total, 140 long only, 0 short only, 0 long/short - change of 9,38% MRQ |
| Genomsnittlig portföljallokering | 0.8984 % - change of 5,80% MRQ |
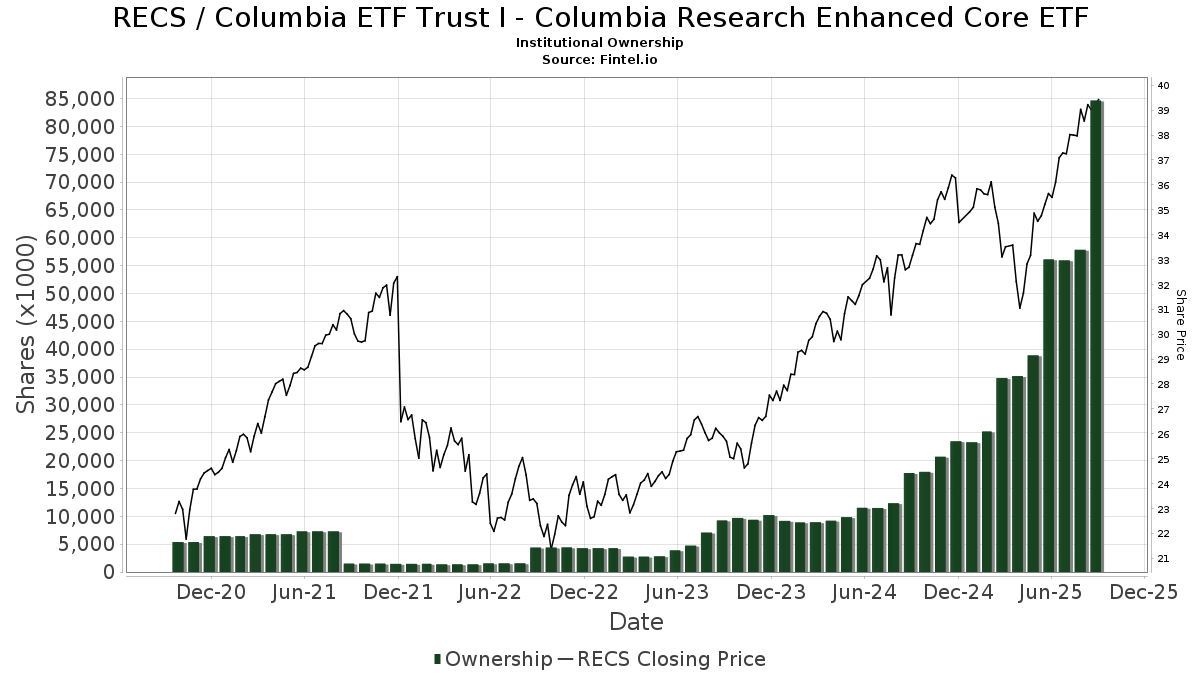
| Institutionella aktier (lång) | 84 634 179 (ex 13D/G) - change of 28,53MM shares 50,84% MRQ |
| Institutionellt värde (lång) | $ 2 973 135 USD ($1000) |
Institutionellt ägande och aktieägare
Columbia ETF Trust I - Columbia Research Enhanced Core ETF (US:RECS) har 140 Institutionella ägare och aktieägare som har lämnat in 13D/G- eller 13F-formulär till Securities Exchange Commission (SEC). Dessa institut innehar totalt 84,634,179 aktier. Största aktieägare inkluderar Jane Street Group, Llc, Ameriprise Financial Inc, LPL Financial LLC, Bank Of America Corp /de/, Morgan Stanley, Raymond James Financial Inc, CTFAX - Columbia Thermostat Fund Class A, Commonwealth Equity Services, Llc, Gradient Investments LLC, and Fundamentun, Llc .
Columbia ETF Trust I - Columbia Research Enhanced Core ETF (ARCA:RECS) Institutionell ägarstruktur visar institutioners och fonders nuvarande positioner i företaget, samt de senaste förändringarna i positionernas storlek. Större aktieägare kan vara enskilda investerare, fonder, hedgefonder eller institutioner. Bilaga 13D visar att investeraren äger (eller ägde) mer än 5% av företaget och avser (eller avsåg) att aktivt eftersträva en förändring av affärsstrategin. Schedule 13G indikerar en passiv investering på över 5%.
The share price as of September 9, 2025 is 39,18 / share. Previously, on September 10, 2024, the share price was 32,33 / share. This represents an increase of 21,19% over that period.
Fondsentimentets poäng
Fondsentimentet poängen(fka Ägarackumulation-poäng) visar vilka aktier som är mest köpta av fonder. Det är resultatet av en sofistikerad kvantitativ flerfaktormodell som identifierar företag med de högsta nivåerna av institutionell ackumulering. Poängsättningsmodellen använder en kombination av den totala ökningen av redovisade ägare, förändringarna i portföljallokeringarna för dessa ägare och andra mått. Siffran sträcker sig från 0 till 100, där högre siffror indikerar en högre nivå av ackumulering i förhållande till sina konkurrenter, och 50 är genomsnittet.
Uppdateringsfrekvens: Dagligen
Se Ownership Explorer, som innehåller en lista över de högst rankade företagen.
Institutionell sälj/köp-kvot
Förutom att rapportera vanliga eget kapital- och skuldemissioner måste institutioner med mer än 100MM tillgångar under förvaltning också avslöja sina innehav av sälj- och köpoptioner. Eftersom säljoptioner i allmänhet indikerar ett negativt sentiment och köpoptioner indikerar ett positivt sentiment, kan vi få en uppfattning om det övergripande institutionella sentimentet genom att plotta förhållandet mellan säljoptioner och köpoptioner. Diagrammet till höger visar det historiska förhållandet mellan sälj- och köpoptioner för detta instrument.
Genom att använda sälj/köp-kvoten som en indikator på aktieägarnas sentiment undviker man en av de största bristerna med att använda det totala institutionella ägandet, nämligen att en betydande del av de förvaltade tillgångarna investeras passivt för att följa index. Passivt förvaltade fonder köper vanligtvis inte optioner, så indikatorn för sälj/köp-kvoten ger en bättre bild av stämningen i aktivt förvaltade fonder.
13F- och NPORT-arkiveringar
Detaljer om 13F-arkiveringar är gratis. Detaljer om NP-arkiveringar kräver ett premiummedlemskap. Gröna rader indikerar nya positioner. Röda rader indikerar stängda positioner. Klicka på länk symbolen för att se hela transaktionshistoriken.
Uppgradera
för att låsa upp premiumdata och exportera till Excel ![]() .
.
| Fil Datum | Källa | Investerare | Typ | Genomsnittligt pris (beräknat) |
Aktier | Δ Aktier (%) |
Rapporterat värde (1000 USD) |
Δ Värde (%) |
Portföljallokering (%) |
|
|---|---|---|---|---|---|---|---|---|---|---|
| 2025-07-29 | 13F | Stratos Wealth Partners, LTD. | 1 511 634 | −1,17 | 55 613 | 9,48 | ||||
| 2025-08-12 | 13F | Jpmorgan Chase & Co | 685 926 | 8,83 | 25 235 | 20,56 | ||||
| 2025-08-14 | 13F | Great Valley Advisor Group, Inc. | 14 303 | −91,10 | 526 | −90,14 | ||||
| 2025-07-23 | 13F | Heck Capital Advisors, LLC | 461 922 | 16 994 | ||||||
| 2025-07-29 | 13F | Fundamentun, Llc | 1 978 098 | 4,39 | 72 774 | 15,64 | ||||
| 2025-08-13 | 13F | Northwestern Mutual Wealth Management Co | 110 244 | −46,99 | 4 056 | −41,28 | ||||
| 2025-08-14 | 13F | Royal Bank Of Canada | 477 034 | −16,81 | 17 551 | −7,83 | ||||
| 2025-08-14 | 13F | LM Advisors LLC | 40 568 | 2,56 | 1 | 0,00 | ||||
| 2025-08-14 | 13F | Bank Of America Corp /de/ | 4 425 196 | −10,10 | 162 803 | −0,40 | ||||
| 2025-07-17 | 13F | Janney Montgomery Scott LLC | 18 761 | 51,27 | 1 | |||||
| 2025-07-25 | 13F | Retirement Planning Group, Llc / Ny | 90 043 | 41,28 | 3 313 | 56,52 | ||||
| 2025-08-14 | 13F | Jane Street Group, Llc | 16 658 312 | 49 303,34 | 612 859 | 54 668,45 | ||||
| 2025-07-23 | 13F | Morey & Quinn Wealth Partners, LLC | 19 785 | 26,95 | 728 | 40,62 | ||||
| 2025-07-02 | 13F | Capital Market Strategies LLC | 10 558 | 388 | ||||||
| 2025-07-09 | 13F | WealthCare Investment Partners, LLC | 23 778 | 15,46 | 889 | 41,85 | ||||
| 2025-08-12 | 13F | Richmond Investment Services, LLC | 68 148 | 102,91 | 2 507 | 124,84 | ||||
| 2025-08-14 | 13F | Mml Investors Services, Llc | 374 045 | 6,36 | 14 | 18,18 | ||||
| 2025-08-04 | 13F | Amplius Wealth Advisors, LLC | 1 533 039 | 1,36 | 56 396 | 12,27 | ||||
| 2025-08-08 | 13F | Cetera Investment Advisers | 258 054 | −24,01 | 9 494 | −15,82 | ||||
| 2025-08-14 | 13F | Comerica Bank | 4 737 | −26,38 | 174 | −18,31 | ||||
| 2025-08-08 | 13F | Avantax Advisory Services, Inc. | 220 971 | 173,50 | 8 130 | 202,98 | ||||
| 2025-07-29 | 13F | Stratos Wealth Advisors, LLC | 8 856 | 326 | ||||||
| 2025-08-13 | 13F | MONECO Advisors, LLC | 5 921 | −6,24 | 218 | 3,83 | ||||
| 2025-08-08 | 13F | Comprehensive Financial Planning, Inc./PA | 1 007 | −6,33 | 37 | 5,71 | ||||
| 2025-08-07 | 13F | Fidelis Capital Partners, LLC | 49 943 | 1 896 | ||||||
| 2025-08-22 | NP | CTFAX - Columbia Thermostat Fund Class A | 2 732 920 | 125,79 | 100 544 | 150,13 | ||||
| 2025-07-21 | 13F | Ameritas Advisory Services, LLC | 70 820 | 102,04 | 2 605 | 115,82 | ||||
| 2025-07-21 | 13F | DHJJ Financial Advisors, Ltd. | 5 | 0,00 | 0 | |||||
| 2025-07-29 | 13F | Empirical Asset Management, LLC | 69 125 | 1,37 | 2 543 | 12,32 | ||||
| 2025-08-14 | 13F | Wiley Bros.-aintree Capital, Llc | 20 580 | 13,53 | 757 | 26,59 | ||||
| 2025-08-14 | 13F | Graney & King, LLC | 5 447 | 444,70 | 200 | 506,06 | ||||
| 2025-08-14 | 13F | Byrne Financial Freedom, Llc | 73 933 | 328,75 | 2 720 | 375,35 | ||||
| 2025-08-06 | 13F | Commonwealth Equity Services, Llc | 2 517 266 | 77,26 | 93 | 95,74 | ||||
| 2025-08-13 | 13F | Dana Investment Advisors, Inc. | 18 951 | 63,55 | 697 | 81,51 | ||||
| 2025-08-18 | 13F | Tyler-Stone Wealth Management | 10 264 | 0,98 | 378 | 11,87 | ||||
| 2025-07-17 | 13F | Archford Capital Strategies, LLC | 269 439 | 2,56 | 9 913 | 13,60 | ||||
| 2025-08-04 | 13F | Assetmark, Inc | 117 | 4 | ||||||
| 2025-07-18 | 13F | Truist Financial Corp | 8 231 | 30,82 | 303 | 45,19 | ||||
| 2025-07-23 | 13F | RiverTree Advisors, LLC | 8 180 | −5,92 | 301 | 4,17 | ||||
| 2025-08-06 | 13F | Mark Sheptoff Financial Planning, Llc | 385 | 0,00 | 14 | 16,67 | ||||
| 2025-08-05 | 13F | Scarborough Advisors, LLC | 567 951 | 30,34 | 20 895 | 44,39 | ||||
| 2025-08-04 | 13F | Daymark Wealth Partners, Llc | 720 517 | 14,10 | 26 508 | 26,40 | ||||
| 2025-08-11 | 13F | Trajan Wealth LLC | 555 620 | 0,12 | 20 441 | 10,92 | ||||
| 2025-08-05 | 13F | Snider Financial Group | 123 818 | 4 555 | ||||||
| 2025-08-13 | 13F | Balance Wealth, LLC | 54 725 | −81,88 | 2 013 | −79,93 | ||||
| 2025-07-15 | 13F | Palumbo Wealth Management LLC | 11 916 | 438 | ||||||
| 2025-07-30 | 13F | Bogart Wealth, LLC | 196 458 | 7,83 | 7 228 | 19,45 | ||||
| 2025-08-14 | 13F | Atomi Financial Group, Inc. | 7 061 | 260 | ||||||
| 2025-08-11 | 13F | Citigroup Inc | 65 065 | 1 517,73 | 2 394 | 1 699,25 | ||||
| 2025-07-23 | 13F | Drake & Associates, LLC | 840 273 | 4,37 | 30 914 | 15,61 | ||||
| 2025-08-19 | 13F | Advisory Services Network, LLC | 63 469 | 8,08 | 2 394 | 22,77 | ||||
| 2025-07-28 | 13F | Tower Wealth Partners, Inc. | 492 981 | 3,98 | 18 137 | 15,19 | ||||
| 2025-07-17 | 13F | KWB Wealth | 236 281 | 57,88 | 7 847 | 51,44 | ||||
| 2025-08-11 | 13F | Private Advisor Group, LLC | 112 533 | 3,26 | 4 140 | 14,40 | ||||
| 2025-08-06 | 13F | Golden State Wealth Management, LLC | 0 | −100,00 | 0 | −100,00 | ||||
| 2025-08-13 | 13F | Marshall Wace, Llp | 94 953 | 3 493 | ||||||
| 2025-08-15 | 13F | Morgan Stanley | 3 401 063 | 41,84 | 125 125 | 57,13 | ||||
| 2025-05-15 | 13F | Ameriflex Group, Inc. | 0 | −100,00 | 0 | |||||
| 2025-08-08 | 13F | Thoroughbred Financial Services, Llc | 29 108 | 10,73 | 1 | |||||
| 2025-08-13 | 13F | Copley Financial Group, Inc. | 6 643 | −5,61 | 244 | 4,72 | ||||
| 2025-04-07 | 13F | AdvisorNet Financial, Inc | 0 | −100,00 | 0 | |||||
| 2025-08-12 | 13F | BlueStem Wealth Partners, LLC | 1 062 939 | −32,72 | 39 106 | −25,47 | ||||
| 2025-05-09 | 13F | Goldman Sachs Group Inc | 0 | −100,00 | 0 | |||||
| 2025-08-05 | 13F | Mma Asset Management Llc | 24 955 | −8,73 | 918 | 1,10 | ||||
| 2025-09-04 | 13F/A | Advisor Group Holdings, Inc. | 637 841 | 108,52 | 23 465 | 131,00 | ||||
| 2025-08-11 | 13F | Western Wealth Management, LLC | 110 174 | 3,02 | 4 053 | 14,14 | ||||
| 2025-08-11 | 13F | Advisor Resource Council | 0 | −100,00 | 0 | |||||
| 2025-08-12 | 13F | Spectrum Wealth Advisory Group, LLC | 837 922 | −16,48 | 30 827 | −7,47 | ||||
| 2025-07-29 | 13F | Private Trust Co Na | 3 475 | 128 | ||||||
| 2025-07-29 | 13F | Riverbend Wealth Management, LLC | 14 803 | 38,60 | 545 | 53,67 | ||||
| 2025-07-11 | 13F | SILVER OAK SECURITIES, Inc | 80 568 | 2,77 | 2 964 | 14,57 | ||||
| 2025-08-13 | 13F | Denver Wealth Management, Inc. | 30 795 | 23,55 | 1 133 | 36,88 | ||||
| 2025-08-14 | 13F | Fmr Llc | 2 182 | 114,13 | 80 | 142,42 | ||||
| 2025-07-15 | 13F | Oxinas Partners Wealth Management LLC | 22 200 | 0,00 | 817 | 10,72 | ||||
| 2025-08-29 | 13F | Centaurus Financial, Inc. | 385 922 | 2,64 | 14 | 16,67 | ||||
| 2025-07-07 | 13F | RDA Financial Network | 105 535 | 6,41 | 3 883 | 17,89 | ||||
| 2025-08-14 | 13F | Paragon Private Wealth Management, LLC | 57 620 | 12,59 | 2 120 | 24,72 | ||||
| 2025-07-29 | 13F | Activest Wealth Management | 0 | 0 | ||||||
| 2025-08-12 | 13F | Proequities, Inc. | 0 | 0 | ||||||
| 2025-07-31 | 13F | Cambridge Investment Research Advisors, Inc. | 240 780 | 12,60 | 9 | 14,29 | ||||
| 2025-08-14 | 13F | Ameriprise Financial Inc | 12 963 845 | 22,35 | 476 940 | 35,54 | ||||
| 2025-07-09 | 13F | Fiduciary Alliance LLC | 6 883 | −11,30 | 253 | −1,56 | ||||
| 2025-07-16 | 13F | Perigon Wealth Management, LLC | 6 927 | 10,64 | 255 | 22,71 | ||||
| 2025-07-22 | 13F | DAVENPORT & Co LLC | 131 024 | 90,96 | 4 820 | 111,59 | ||||
| 2025-05-08 | 13F | Us Bancorp \de\ | 0 | −100,00 | 0 | |||||
| 2025-07-25 | 13F | Atria Wealth Solutions, Inc. | 55 103 | 62,11 | 2 027 | 79,70 | ||||
| 2025-08-06 | 13F/A | Three Cord True Wealth Management, LLC | 523 209 | 7,65 | 19 249 | 19,25 | ||||
| 2025-08-13 | 13F | Renaissance Technologies Llc | 27 900 | 1 026 | ||||||
| 2025-08-14 | 13F | Raymond James Financial Inc | 3 167 950 | 15,28 | 116 549 | 27,70 | ||||
| 2025-08-14 | 13F | Dagco, Inc. | 80 985 | 25,84 | 2 979 | 39,40 | ||||
| 2025-05-15 | 13F | Old Mission Capital Llc | 0 | −100,00 | 0 | |||||
| 2025-08-01 | 13F | Envestnet Asset Management Inc | 65 696 | 14,49 | 2 417 | 26,82 | ||||
| 2025-08-06 | 13F | Bensler, LLC | 227 616 | 3,67 | 8 374 | 14,84 | ||||
| 2025-07-08 | 13F | Paladin Wealth, LLC | 60 269 | 2,85 | 2 217 | 13,93 | ||||
| 2025-07-31 | 13F | Mason & Associates Inc | 1 029 239 | 37 866 | ||||||
| 2025-08-04 | 13F | Creative Financial Designs Inc /adv | 36 | 1 | ||||||
| 2025-07-31 | 13F | Richards, Merrill & Peterson, Inc. | 0 | −100,00 | 0 | |||||
| 2025-07-22 | 13F | USAdvisors Wealth Management, LLC | 160 450 | 5,13 | 6 | 0,00 | ||||
| 2025-08-14 | 13F | Keystone Financial Services, LLC | 6 698 | 246 | ||||||
| 2025-05-12 | 13F | Independent Advisor Alliance | 0 | −100,00 | 0 | |||||
| 2025-08-04 | 13F | Atria Investments Llc | 190 216 | 6,16 | 6 998 | 17,61 | ||||
| 2025-08-14 | 13F | Two Sigma Investments, Lp | 603 600 | 544,87 | 22 206 | 614,48 | ||||
| 2025-07-15 | 13F | Axis Wealth Partners, LLC | 33 241 | 13,75 | 1 223 | 25,98 | ||||
| 2025-08-18 | 13F | Arq Wealth Advisors, Llc | 214 206 | 0,00 | 7 114 | 0,00 | ||||
| 2025-08-15 | 13F | Kestra Advisory Services, LLC | 145 845 | 36,98 | 5 366 | 51,77 | ||||
| 2025-05-01 | 13F | Fulcrum Equity Management | 0 | −100,00 | 0 | |||||
| 2025-08-12 | 13F | LPL Financial LLC | 10 820 984 | 20,41 | 398 104 | 33,38 | ||||
| 2025-08-13 | 13F | Jones Financial Companies Lllp | 230 633 | 41,60 | 8 455 | 57,27 | ||||
| 2025-08-14 | 13F | Susquehanna International Group, Llp | 55 754 | −51,17 | 2 051 | −45,91 | ||||
| 2025-07-10 | 13F | Sovran Advisors, LLC | 92 334 | 33,27 | 3 417 | 58,86 | ||||
| 2025-08-08 | 13F | Larson Financial Group LLC | 2 277 | −39,92 | 84 | −33,60 | ||||
| 2025-08-14 | 13F | UBS Group AG | 366 954 | 159,97 | 13 500 | 188,03 | ||||
| 2025-08-14 | 13F | Citadel Advisors Llc | 17 151 | 16,67 | 631 | 29,10 | ||||
| 2025-08-14 | 13F | Integrated Wealth Concepts LLC | 5 912 | 218 | ||||||
| 2025-08-11 | 13F | Principal Securities, Inc. | 24 351 | 125,26 | 896 | 139,30 | ||||
| 2025-08-05 | 13F | Flynn Zito Capital Management, Llc | 155 216 | −0,15 | 5 710 | 10,62 | ||||
| 2025-08-15 | 13F | Equitable Holdings, Inc. | 12 430 | 85,52 | 457 | 105,86 | ||||
| 2025-08-13 | 13F | Congress Wealth Management LLC / DE / | 99 278 | 10,30 | 3 652 | 22,18 | ||||
| 2025-08-07 | 13F | Kestra Private Wealth Services, Llc | 241 380 | 34,51 | 8 880 | 49,02 | ||||
| 2025-08-07 | 13F | Allworth Financial LP | 1 961 | 38,39 | 72 | 60,00 | ||||
| 2025-08-12 | 13F | Global Retirement Partners, LLC | 2 732 | 2,32 | 101 | 8,70 | ||||
| 2025-08-12 | 13F | Gladstone Institutional Advisory LLC | 491 805 | 22,81 | 18 094 | 36,05 | ||||
| 2025-08-19 | 13F | National Asset Management, Inc. | 31 536 | 16,06 | 1 160 | 23,40 | ||||
| 2025-08-05 | 13F | Smith Shellnut Wilson Llc /adv | 23 069 | 22,94 | 849 | 36,12 | ||||
| 2025-04-24 | NP | NSGAX - Columbia Select Large Cap Equity Fund Class A | 43 258 | −60,52 | 1 520 | −61,51 | ||||
| 2025-07-08 | 13F | Gradient Investments LLC | 2 031 726 | 1,17 | 74 747 | 12,08 | ||||
| 2025-07-09 | 13F | Fermata Advisors, LLC | 101 501 | −0,73 | 3 734 | 9,99 | ||||
| 2025-08-14 | 13F | CoreCap Advisors, LLC | 106 | 0,00 | 4 | 0,00 | ||||
| 2025-07-10 | 13F | Wealth Enhancement Advisory Services, Llc | 320 671 | 394,61 | 11 983 | 456,57 | ||||
| 2025-07-31 | 13F | Leavell Investment Management, Inc. | 125 694 | 39,50 | 4 624 | 54,55 | ||||
| 2025-07-30 | 13F/A | KPP Advisory Services LLC | 45 678 | 196,11 | 1 680 | 228,13 | ||||
| 2025-08-12 | 13F | Cornerstone Wealth Management, LLC | 14 683 | 12,12 | 540 | 24,42 | ||||
| 2025-08-12 | 13F | SRS Capital Advisors, Inc. | 2 376 | −23,67 | 87 | −15,53 | ||||
| 2025-07-09 | 13F | Pines Wealth Management, LLC | 35 328 | 9,89 | 1 320 | 39,68 | ||||
| 2025-07-29 | 13F | Mattson Financial Services, LLC | 64 709 | −5,47 | 2 381 | 4,71 | ||||
| 2025-08-14 | 13F | Wells Fargo & Company/mn | 1 522 931 | 67,65 | 56 029 | 85,72 | ||||
| 2025-08-14 | 13F | GWM Advisors LLC | 357 751 | −0,73 | 13 162 | 9,97 | ||||
| 2025-07-28 | 13F | Harbour Investments, Inc. | 8 201 | 13,12 | 302 | 25,42 | ||||
| 2025-07-16 | 13F | Essex Financial Services, Inc. | 213 424 | 22,60 | 7 852 | 35,81 | ||||
| 2025-07-25 | 13F | Cwm, Llc | 196 | 0,00 | 0 | |||||
| 2025-08-15 | 13F | Brown Financial Advisors | 115 356 | −2,38 | 4 244 | 8,13 | ||||
| 2025-08-04 | 13F | Pensionmark Financial Group, Llc | 152 094 | −0,83 | 5 596 | 9,86 | ||||
| 2025-08-01 | 13F | PCA Investment Advisory Services Inc. | 17 464 | 24,71 | 643 | 38,06 | ||||
| 2025-04-17 | 13F | Tcfg Wealth Management, Llc | 0 | −100,00 | 0 | |||||
| 2025-08-13 | 13F | IAG Wealth Partners, LLC | 296 568 | 143,19 | 10 911 | 169,45 | ||||
| 2025-08-14 | 13F | Stifel Financial Corp | 179 979 | 898,88 | 6 621 | 1 007,19 | ||||
| 2025-07-30 | 13F | Prosperity Financial Group, Inc. | 39 656 | 32,34 | 1 459 | 46,53 | ||||
| 2025-08-12 | 13F | Inscription Capital, LLC | 39 399 | 1 449 | ||||||
| 2025-08-14 | 13F | Mariner, LLC | 126 650 | 31,44 | 4 659 | 45,59 | ||||
| 2025-08-01 | 13F | Y-Intercept (Hong Kong) Ltd | 22 849 | 841 | ||||||
| 2025-07-16 | 13F | Spirepoint Private Client, Llc | 64 672 | −8,88 | 2 379 | 0,93 | ||||
| 2025-06-25 | NP | LEGAX - Columbia Large Cap Growth Fund Class A | 169 788 | −50,53 | 5 572 | −54,33 | ||||
| 2025-08-12 | 13F | Steward Partners Investment Advisory, Llc | 90 084 | 13,78 | 3 314 | 26,06 |