Grundläggande statistik
| Institutionella ägare | 172 total, 172 long only, 0 short only, 0 long/short - change of 2,98% MRQ |
| Genomsnittlig portföljallokering | 0.6694 % - change of 16,96% MRQ |
| Institutionella aktier (lång) | 8 255 101 (ex 13D/G) - change of 0,67MM shares 8,78% MRQ |
| Institutionellt värde (lång) | $ 1 295 753 USD ($1000) |
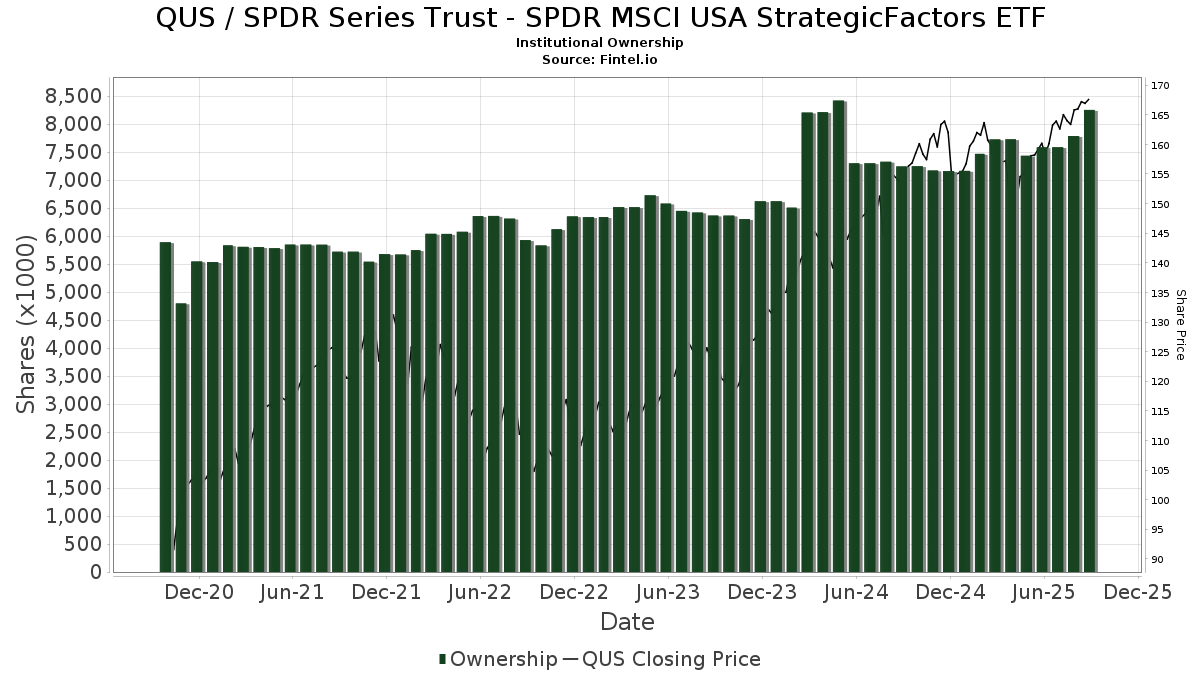
Institutionellt ägande och aktieägare
SPDR Series Trust - SPDR MSCI USA StrategicFactors ETF (US:QUS) har 172 Institutionella ägare och aktieägare som har lämnat in 13D/G- eller 13F-formulär till Securities Exchange Commission (SEC). Dessa institut innehar totalt 8,255,101 aktier. Största aktieägare inkluderar Colony Group, LLC, Tolleson Wealth Management, Inc., Sfmg, Llc, Private Advisor Group, LLC, Bank Of America Corp /de/, Envestnet Asset Management Inc, LPL Financial LLC, Morgan Stanley, Perennial Investment Advisors, LLC, and Mount Yale Investment Advisors, LLC .
SPDR Series Trust - SPDR MSCI USA StrategicFactors ETF (ARCA:QUS) Institutionell ägarstruktur visar institutioners och fonders nuvarande positioner i företaget, samt de senaste förändringarna i positionernas storlek. Större aktieägare kan vara enskilda investerare, fonder, hedgefonder eller institutioner. Bilaga 13D visar att investeraren äger (eller ägde) mer än 5% av företaget och avser (eller avsåg) att aktivt eftersträva en förändring av affärsstrategin. Schedule 13G indikerar en passiv investering på över 5%.
The share price as of September 12, 2025 is 168,62 / share. Previously, on September 13, 2024, the share price was 155,26 / share. This represents an increase of 8,60% over that period.
Fondsentimentets poäng
Fondsentimentet poängen(fka Ägarackumulation-poäng) visar vilka aktier som är mest köpta av fonder. Det är resultatet av en sofistikerad kvantitativ flerfaktormodell som identifierar företag med de högsta nivåerna av institutionell ackumulering. Poängsättningsmodellen använder en kombination av den totala ökningen av redovisade ägare, förändringarna i portföljallokeringarna för dessa ägare och andra mått. Siffran sträcker sig från 0 till 100, där högre siffror indikerar en högre nivå av ackumulering i förhållande till sina konkurrenter, och 50 är genomsnittet.
Uppdateringsfrekvens: Dagligen
Se Ownership Explorer, som innehåller en lista över de högst rankade företagen.
Institutionell sälj/köp-kvot
Förutom att rapportera vanliga eget kapital- och skuldemissioner måste institutioner med mer än 100MM tillgångar under förvaltning också avslöja sina innehav av sälj- och köpoptioner. Eftersom säljoptioner i allmänhet indikerar ett negativt sentiment och köpoptioner indikerar ett positivt sentiment, kan vi få en uppfattning om det övergripande institutionella sentimentet genom att plotta förhållandet mellan säljoptioner och köpoptioner. Diagrammet till höger visar det historiska förhållandet mellan sälj- och köpoptioner för detta instrument.
Genom att använda sälj/köp-kvoten som en indikator på aktieägarnas sentiment undviker man en av de största bristerna med att använda det totala institutionella ägandet, nämligen att en betydande del av de förvaltade tillgångarna investeras passivt för att följa index. Passivt förvaltade fonder köper vanligtvis inte optioner, så indikatorn för sälj/köp-kvoten ger en bättre bild av stämningen i aktivt förvaltade fonder.
13F- och NPORT-arkiveringar
Detaljer om 13F-arkiveringar är gratis. Detaljer om NP-arkiveringar kräver ett premiummedlemskap. Gröna rader indikerar nya positioner. Röda rader indikerar stängda positioner. Klicka på länk symbolen för att se hela transaktionshistoriken.
Uppgradera
för att låsa upp premiumdata och exportera till Excel ![]() .
.
| Fil Datum | Källa | Investerare | Typ | Genomsnittligt pris (beräknat) |
Aktier | Δ Aktier (%) |
Rapporterat värde (1000 USD) |
Δ Värde (%) |
Portföljallokering (%) |
|
|---|---|---|---|---|---|---|---|---|---|---|
| 2025-08-06 | 13F | Mark Sheptoff Financial Planning, Llc | 30 | 0,00 | 5 | 0,00 | ||||
| 2025-07-18 | 13F | Parsons Capital Management Inc/ri | 28 061 | 14,03 | 4 576 | 18,70 | ||||
| 2025-07-31 | 13F | Sage Mountain Advisors LLC | 187 074 | −2,17 | 30 510 | 1,82 | ||||
| 2025-08-14 | 13F | Vista Investment Management | 36 305 | 0,22 | 5 921 | 4,32 | ||||
| 2025-08-04 | 13F | Flagship Harbor Advisors, Llc | 29 790 | 0,67 | 4 858 | 4,79 | ||||
| 2025-08-14 | 13F | Smartleaf Asset Management LLC | 19 364 | 32,42 | 3 135 | 38,17 | ||||
| 2025-05-13 | 13F | EverSource Wealth Advisors, LLC | 0 | −100,00 | 0 | |||||
| 2025-08-14 | 13F | Mercer Global Advisors Inc /adv | 8 785 | 1,71 | 1 433 | 5,84 | ||||
| 2025-04-28 | 13F | Great Point Wealth Advisors, LLC | 96 974 | −0,86 | 15 195 | 0,31 | ||||
| 2025-08-14 | 13F | Avant Capital LLC | 3 202 | 7,23 | 522 | 11,78 | ||||
| 2025-07-18 | 13F | Naples Global Advisors, Llc | 4 825 | −3,98 | 787 | −0,13 | ||||
| 2025-08-11 | 13F | CFS Investment Advisory Services, LLC | 2 511 | 0,00 | 0 | |||||
| 2025-08-06 | 13F | Golden State Wealth Management, LLC | 154 | 0,00 | 25 | 4,17 | ||||
| 2025-08-06 | 13F | First Horizon Advisors, Inc. | 1 435 | 7,41 | 234 | 11,96 | ||||
| 2025-08-13 | 13F | Royal Fund Management, LLC | 3 333 | −0,15 | 544 | 3,82 | ||||
| 2025-08-14 | 13F | Qube Research & Technologies Ltd | 83 | −1,19 | 14 | 0,00 | ||||
| 2025-07-25 | 13F | Envestnet Portfolio Solutions, Inc. | 2 128 | −28,52 | 347 | −25,54 | ||||
| 2025-07-09 | 13F | Lbmc Investment Advisors, Llc | 12 367 | 0,50 | 2 017 | 4,56 | ||||
| 2025-08-28 | 13F/A | Tolleson Wealth Management, Inc. | 568 476 | −2,75 | 92 713 | 1,22 | ||||
| 2025-07-25 | 13F | Sequoia Financial Advisors, LLC | 1 272 | −12,88 | 207 | −9,21 | ||||
| 2025-07-31 | 13F | Carnegie Capital Asset Management, LLC | 1 601 | 261 | ||||||
| 2025-08-11 | 13F | Rothschild Investment Llc | 116 | 0,00 | 19 | 0,00 | ||||
| 2025-07-29 | 13F | Private Trust Co Na | 3 496 | −5,00 | 570 | −1,04 | ||||
| 2025-07-31 | 13F | Cambridge Investment Research Advisors, Inc. | 69 858 | 33,75 | 11 | 37,50 | ||||
| 2025-08-15 | 13F | Morgan Stanley | 254 010 | 2,35 | 41 427 | 6,53 | ||||
| 2025-07-24 | 13F | IFP Advisors, Inc | 1 216 | 10,55 | 198 | 15,12 | ||||
| 2025-07-14 | 13F | AdvisorNet Financial, Inc | 125 | 0,00 | 20 | 5,26 | ||||
| 2025-07-21 | 13F | Ameritas Advisory Services, LLC | 36 604 | 1 195,72 | 5 970 | 1 265,90 | ||||
| 2025-08-01 | 13F | Howard Capital Management Inc. | 42 273 | 85,75 | 6 894 | 93,33 | ||||
| 2025-07-22 | 13F | Wealthcare Advisory Partners LLC | 2 508 | 0,00 | 409 | 4,34 | ||||
| 2025-08-05 | 13F | Prosperity Consulting Group, LLC | 2 342 | 7,53 | 382 | 12,02 | ||||
| 2025-08-13 | 13F | Parkworth Wealth Management, Inc. | 194 | 0,00 | 32 | 3,33 | ||||
| 2025-08-13 | 13F | American Money Management, LLC | 65 951 | 1,07 | 10 756 | 5,19 | ||||
| 2025-07-23 | 13F | Opulen Financial Group LLC | 3 356 | 0,24 | 547 | 4,39 | ||||
| 2025-08-14 | 13F | Goldman Sachs Group Inc | 10 663 | 1 739 | ||||||
| 2025-07-11 | 13F | Bouvel Investment Partners, LLC | 0 | −100,00 | 0 | −100,00 | ||||
| 2025-08-08 | 13F | Collaborative Wealth Managment Inc. | 2 025 | 11,88 | 330 | 16,61 | ||||
| 2025-07-17 | 13F | Worth Financial Advisory Group, LLC | 1 969 | 0,05 | 321 | 4,22 | ||||
| 2025-08-12 | 13F | Journey Strategic Wealth Llc | 2 535 | 0,56 | 413 | 4,56 | ||||
| 2025-08-08 | 13F | Bailard, Inc. | 1 766 | 0,00 | 288 | 4,35 | ||||
| 2025-08-14 | 13F | Fort Point Capital Partners LLC | 8 172 | 0,01 | 1 333 | 4,06 | ||||
| 2025-08-12 | 13F | Global Retirement Partners, LLC | 1 043 | 0,00 | 170 | 5,59 | ||||
| 2025-08-14 | 13F | EP Wealth Advisors, Inc. | 3 712 | −11,15 | 605 | −7,49 | ||||
| 2025-08-11 | 13F | Brown Brothers Harriman & Co | 114 | 0,00 | 19 | 5,88 | ||||
| 2025-08-12 | 13F | Steward Partners Investment Advisory, Llc | 218 | 0,00 | 36 | 2,94 | ||||
| 2025-07-30 | 13F | Princeton Global Asset Management LLC | 11 360 | −4,22 | 1 853 | −0,32 | ||||
| 2025-08-14 | 13F | Bank Of America Corp /de/ | 394 815 | 94,73 | 64 390 | 102,68 | ||||
| 2025-08-06 | 13F | Strategic Financial Partners, Ltd. | 10 584 | 1 726 | ||||||
| 2025-07-15 | 13F | Retireful, LLC | 0 | −100,00 | 0 | |||||
| 2025-08-12 | 13F | Jpmorgan Chase & Co | 10 853 | −3,64 | 1 770 | 0,34 | ||||
| 2025-07-29 | 13F | TFC Financial Management | 2 318 | 94,30 | 378 | 103,23 | ||||
| 2025-08-14 | 13F | Palo Alto Wealth Advisors, Llc | 2 765 | 0,55 | 451 | 3,69 | ||||
| 2025-08-06 | 13F | Valtinson Bruner Financial Planning LLC | 3 435 | 0,35 | 560 | 4,48 | ||||
| 2025-08-07 | 13F | CENTRAL TRUST Co | 0 | −100,00 | 0 | |||||
| 2025-08-07 | 13F | 1620 Investment Advisors, Inc. | 6 103 | 4,16 | 995 | 8,39 | ||||
| 2025-07-16 | 13F | Essex Financial Services, Inc. | 20 421 | 1,84 | 3 331 | 5,98 | ||||
| 2025-08-07 | 13F | Hughes Financial Services, LLC | 45 149 | −0,59 | 7 376 | 3,74 | ||||
| 2025-08-14 | 13F | GWM Advisors LLC | 36 337 | 7,09 | 5 926 | 11,47 | ||||
| 2025-08-14 | 13F | Beaird Harris Wealth Management, LLC | 418 | 0,00 | 68 | 4,62 | ||||
| 2025-04-29 | 13F | Pensionmark Financial Group, Llc | 0 | −100,00 | 0 | |||||
| 2025-08-12 | 13F | J.w. Cole Advisors, Inc. | 1 785 | 291 | ||||||
| 2025-07-17 | 13F | Montis Financial, LLC | 1 409 | 0,00 | 230 | 4,09 | ||||
| 2025-07-15 | 13F | Sheets Smith Wealth Management | 7 533 | −1,36 | 1 229 | 2,68 | ||||
| 2025-08-12 | 13F | Wood Tarver Financial Group, LLC | 447 | 172,56 | 0 | −100,00 | ||||
| 2025-08-14 | 13F | Integrated Wealth Concepts LLC | 1 885 | −8,36 | 307 | −4,66 | ||||
| 2025-07-28 | 13F | Harbour Investments, Inc. | 350 | 0,00 | 57 | 5,56 | ||||
| 2025-07-23 | 13F | Detalus Advisors, LLC | 4 924 | −0,04 | 803 | 4,15 | ||||
| 2025-08-11 | 13F | Empowered Funds, LLC | 0 | −100,00 | 0 | −100,00 | ||||
| 2025-08-13 | 13F | Level Four Advisory Services, Llc | 8 861 | −1,08 | 1 445 | 2,99 | ||||
| 2025-08-14 | 13F | Win Advisors, Inc | 55 442 | 9 042 | ||||||
| 2025-08-18 | 13F | Geneos Wealth Management Inc. | 871 | −87,14 | 142 | −86,62 | ||||
| 2025-08-14 | 13F | Two Sigma Investments, Lp | 20 600 | 3 360 | ||||||
| 2025-07-10 | 13F | Focus Financial Network, Inc. | 1 827 | −0,87 | 298 | 3,47 | ||||
| 2025-08-08 | 13F | Capital Investment Advisory Services, LLC | 98 | 0,00 | 16 | 0,00 | ||||
| 2025-08-04 | 13F | Creative Financial Designs Inc /adv | 930 | −16,44 | 152 | −13,22 | ||||
| 2025-05-13 | 13F | Northern Trust Corp | 0 | −100,00 | 0 | |||||
| 2025-08-06 | 13F | AE Wealth Management LLC | 565 | 38,48 | 92 | 46,03 | ||||
| 2025-08-01 | 13F | Envestnet Asset Management Inc | 376 207 | 11,11 | 61 356 | 15,65 | ||||
| 2025-07-16 | 13F | American National Bank | 160 | 0,00 | 26 | 4,00 | ||||
| 2025-07-07 | 13F | Versant Capital Management, Inc | 16 027 | 0,16 | 2 614 | 4,23 | ||||
| 2025-07-31 | 13F | AlTi Global, Inc. | 37 582 | 2,72 | 6 129 | 6,91 | ||||
| 2025-07-14 | 13F | Sentinel Pension Advisors Inc | 9 173 | 1,99 | 1 496 | 6,17 | ||||
| 2025-08-14 | 13F | Mariner, LLC | 2 026 | 10,95 | 330 | 15,38 | ||||
| 2025-07-15 | 13F | McAdam, LLC | 11 395 | −3,51 | 1 858 | 0,43 | ||||
| 2025-08-14 | 13F | Royal Bank Of Canada | 92 524 | 10,86 | 15 089 | 15,39 | ||||
| 2025-08-04 | 13F | IFG Advisory, LLC | 1 560 | 0,00 | 254 | 4,10 | ||||
| 2025-07-16 | 13F | True North Advisors, LLC | 2 593 | 0,00 | 423 | 3,94 | ||||
| 2025-08-11 | 13F | Aptus Capital Advisors, LLC | 3 596 | 0,00 | 586 | 4,09 | ||||
| 2025-07-31 | 13F | Brinker Capital Investments, LLC | 0 | −100,00 | 0 | −100,00 | ||||
| 2025-08-11 | 13F | Theory Financial Llc | 15 235 | −25,83 | 2 485 | −22,81 | ||||
| 2025-08-11 | 13F | Private Advisor Group, LLC | 411 007 | 1,41 | 67 031 | 5,55 | ||||
| 2025-05-01 | 13F | Fifth Third Securities, Inc. | 0 | −100,00 | 0 | |||||
| 2025-07-16 | 13F | John W. Brooker & Co., CPAs | 1 295 | −87,29 | 213 | −86,72 | ||||
| 2025-08-13 | 13F | VestGen Advisors, LLC | 5 167 | 39,54 | 846 | 45,69 | ||||
| 2025-07-14 | 13F | Clear Harbor Asset Management, LLC | 1 612 | 263 | ||||||
| 2025-07-22 | 13F | Merit Financial Group, LLC | 10 444 | 331,39 | 1 703 | 349,34 | ||||
| 2025-05-15 | 13F | Citadel Advisors Llc | 0 | −100,00 | 0 | −100,00 | ||||
| 2025-07-18 | 13F | Lynx Investment Advisory | 1 910 | 0,58 | 312 | 4,71 | ||||
| 2025-08-13 | 13F | Virtue Capital Management, LLC | 0 | −100,00 | 0 | |||||
| 2025-08-12 | 13F | Proequities, Inc. | 0 | 0 | ||||||
| 2025-07-25 | 13F | Cwm, Llc | 450 | 0,00 | 0 | |||||
| 2025-08-13 | 13F | GeoWealth Management, LLC | 7 214 | −1,72 | 1 177 | 2,26 | ||||
| 2025-07-30 | 13F | Cullen/frost Bankers, Inc. | 3 483 | 0,00 | 568 | 4,22 | ||||
| 2025-08-12 | 13F | Waterloo Capital, L.P. | 6 076 | 59,27 | 991 | 65,83 | ||||
| 2025-07-03 | 13F | First Hawaiian Bank | 54 057 | −22,09 | 8 816 | −18,90 | ||||
| 2025-07-23 | 13F | Valmark Advisers, Inc. | 1 427 | 0,00 | 233 | 4,04 | ||||
| 2025-08-12 | 13F | Gladstone Institutional Advisory LLC | 1 279 | −41,94 | 209 | −39,71 | ||||
| 2025-07-10 | 13F | Sharkey, Howes & Javer | 55 409 | 18,63 | 9 037 | 23,48 | ||||
| 2025-08-13 | 13F | Lido Advisors, LLC | 1 899 | 0,00 | 310 | 4,04 | ||||
| 2025-07-24 | 13F | Blair William & Co/il | 1 251 | 8,12 | 204 | 12,71 | ||||
| 2025-08-13 | 13F | Mount Yale Investment Advisors, LLC | 238 262 | −1,01 | 38 858 | 3,04 | ||||
| 2025-08-07 | 13F | New England Private Wealth Advisors LLC | 1 806 | 2,50 | 296 | 7,25 | ||||
| 2025-08-06 | 13F | Commonwealth Equity Services, Llc | 28 312 | 0,58 | 5 | 0,00 | ||||
| 2025-07-23 | 13F | Values Added Financial LLC | 1 581 | 0,00 | 258 | 4,05 | ||||
| 2025-07-17 | 13F | Presper Financial Architects, LLC | 178 719 | 29 | ||||||
| 2025-08-18 | 13F | Arq Wealth Advisors, Llc | 33 953 | 0,00 | 5 320 | 0,00 | ||||
| 2025-08-14 | 13F | Ameriprise Financial Inc | 180 293 | 6,92 | 29 401 | 11,26 | ||||
| 2025-08-12 | 13F | Cornerstone Wealth Management, LLC | 7 706 | −10,03 | 1 257 | −6,41 | ||||
| 2025-07-11 | 13F | SILVER OAK SECURITIES, Inc | 12 136 | 1 979 | ||||||
| 2025-07-30 | 13F | Strategic Blueprint, LLC | 96 371 | −5,71 | 15 717 | −1,86 | ||||
| 2025-08-11 | 13F | Citigroup Inc | 200 | −25,93 | 33 | −23,81 | ||||
| 2025-07-01 | 13F | Harbor Investment Advisory, Llc | 11 975 | 4,11 | 1 953 | 8,38 | ||||
| 2025-08-18 | 13F | Hershey Financial Advisers, LLC | 6 507 | 1 061 | ||||||
| 2025-07-10 | 13F | YHB Investment Advisors, Inc. | 1 308 | 213 | ||||||
| 2025-08-06 | 13F | SOUTH STATE Corp | 0 | −100,00 | 0 | −100,00 | ||||
| 2025-07-25 | 13F | Apollon Financial, LLC | 4 000 | 2,96 | 652 | 7,24 | ||||
| 2025-08-14 | 13F | UBS Group AG | 40 236 | 709,09 | 6 562 | 742,36 | ||||
| 2025-07-17 | 13F | Janney Montgomery Scott LLC | 20 505 | 54,11 | 3 | 50,00 | ||||
| 2025-08-07 | 13F | Nwam Llc | 3 021 | 495 | ||||||
| 2025-07-29 | 13F | Elevation Capital Advisory, LLC | 0 | −100,00 | 0 | |||||
| 2025-05-07 | 13F | Vantage Financial Partners, LLC | 0 | −100,00 | 0 | −100,00 | ||||
| 2025-07-07 | 13F | Enterprise Bank & Trust Co | 4 360 | 0,00 | 711 | 4,10 | ||||
| 2025-07-17 | 13F | Hengehold Capital Management Llc | 6 438 | −0,91 | 1 050 | 3,14 | ||||
| 2025-09-04 | 13F/A | Advisor Group Holdings, Inc. | 5 649 | 25,17 | 921 | 30,27 | ||||
| 2025-08-11 | 13F | Perennial Investment Advisors, LLC | 244 173 | 12,44 | 39 822 | 17,04 | ||||
| 2025-05-12 | 13F | Independent Advisor Alliance | 0 | −100,00 | 0 | |||||
| 2025-05-12 | 13F | Sandy Spring Bank | 9 207 | 0,00 | 1 443 | 1,19 | ||||
| 2025-08-07 | 13F | Summit X, LLC | 1 300 | 0,00 | 212 | 4,43 | ||||
| 2025-08-14 | 13F | Quantinno Capital Management LP | 35 435 | −15,91 | 5 779 | −12,47 | ||||
| 2025-08-15 | 13F | Kestra Advisory Services, LLC | 8 414 | 0,00 | 1 372 | 4,10 | ||||
| 2025-07-08 | 13F | Nbc Securities, Inc. | 4 398 | 25,19 | 1 | |||||
| 2025-08-08 | 13F | Cetera Investment Advisers | 9 694 | 13,16 | 1 581 | 17,81 | ||||
| 2025-07-02 | 13F | Marotta Asset Management | 53 889 | −7,59 | 8 789 | −4,34 | ||||
| 2025-08-12 | 13F | LPL Financial LLC | 283 280 | −2,66 | 46 200 | 1,32 | ||||
| 2025-07-22 | 13F | PUREfi Wealth, LLC | 1 907 | −32,73 | 311 | −29,95 | ||||
| 2025-08-12 | 13F | O'shaughnessy Asset Management, Llc | 1 257 | 151,40 | 205 | 162,82 | ||||
| 2025-07-29 | 13F | Goldstein Advisors, LLC | 11 275 | −0,08 | 1 839 | 3,96 | ||||
| 2025-08-11 | 13F | Principal Securities, Inc. | 550 | −0,72 | 90 | 4,71 | ||||
| 2025-08-14 | 13F | Comerica Bank | 1 009 | 0,00 | 165 | 3,80 | ||||
| 2025-07-09 | 13F | Catalyst Private Wealth, Llc | 1 802 | 0,00 | 294 | 3,90 | ||||
| 2025-08-18 | 13F | Goodman Advisory Group, LLC | 47 222 | −26,37 | 7 702 | −23,37 | ||||
| 2025-07-21 | 13F | Tower View Investment Management & Research LLC | 60 | −55,22 | 10 | −55,00 | ||||
| 2025-08-14 | 13F | Allred Capital Management, LLC | 9 202 | 12,87 | 1 501 | 17,46 | ||||
| 2025-07-18 | 13F | Vicus Capital | 4 627 | 2,01 | 755 | 6,20 | ||||
| 2025-08-13 | 13F | Cerity Partners LLC | 23 683 | −1,13 | 3 862 | 2,90 | ||||
| 2025-08-11 | 13F | Paul R. Ried Financial Group, LLC | 65 745 | 5,53 | 10 722 | 9,85 | ||||
| 2025-08-13 | 13F | Continuum Advisory, LLC | 78 018 | 1,09 | 12 724 | 5,22 | ||||
| 2025-07-31 | 13F | Hobart Private Capital, LLC | 1 747 | 0,00 | 285 | 4,03 | ||||
| 2025-08-14 | 13F | Colony Group, LLC | 1 986 570 | 3,54 | 323 990 | 7,77 | ||||
| 2025-08-15 | 13F | Tower Research Capital LLC (TRC) | 0 | −100,00 | 0 | |||||
| 2025-05-16 | 13F | Coppell Advisory Solutions LLC | 0 | −100,00 | 0 | |||||
| 2025-07-10 | 13F | Wealth Enhancement Advisory Services, Llc | 113 903 | −13,76 | 18 743 | −9,43 | ||||
| 2025-08-05 | 13F | Integrity Wealth Solutions LLC | 28 927 | −1,26 | 4 718 | 2,77 | ||||
| 2025-08-14 | 13F | Raymond James Financial Inc | 140 287 | 31,95 | 22 879 | 37,34 | ||||
| 2025-08-14 | 13F | Fmr Llc | 2 741 | 9,60 | 447 | 14,07 | ||||
| 2025-07-23 | 13F | Eagle Strategies LLC | 62 669 | 1,51 | 10 221 | 5,65 | ||||
| 2025-07-28 | 13F | Brown Financial Advisory | 1 720 | 0,00 | 281 | 4,09 | ||||
| 2025-08-14 | 13F | Hilltop Holdings Inc. | 9 395 | 82,14 | 1 532 | 89,60 | ||||
| 2025-08-19 | 13F | National Asset Management, Inc. | 1 386 | −1,14 | 226 | 4,15 | ||||
| 2025-04-25 | 13F | BankPlus Wealth Management LLC | 0 | −100,00 | 0 | |||||
| 2025-07-29 | 13F | Stratos Wealth Partners, LTD. | 7 929 | −43,10 | 1 293 | −40,77 | ||||
| 2025-07-29 | 13F | Financial Guidance Group, Inc. | 3 596 | 0,00 | 586 | 4,09 | ||||
| 2025-07-25 | 13F | Riverpoint Wealth Management Holdings, LLC | 9 430 | −2,27 | 1 538 | 1,72 | ||||
| 2025-08-14 | 13F | Wells Fargo & Company/mn | 308 | 50 | ||||||
| 2025-08-14 | 13F | Wilkins Miller Wealth Management, LLC | 7 065 | 9,96 | 1 152 | 14,51 | ||||
| 2025-08-12 | 13F | Sfmg, Llc | 519 412 | 0,41 | 84 711 | 4,51 | ||||
| 2025-08-14 | 13F | Susquehanna International Group, Llp | 12 224 | 1 994 | ||||||
| 2025-08-08 | 13F | Pnc Financial Services Group, Inc. | 43 | 0,00 | 7 | 16,67 | ||||
| 2025-08-14 | 13F | Atomi Financial Group, Inc. | 7 287 | 1 188 | ||||||
| 2025-07-25 | NP | SRGAX - Stringer Growth Fund Class A Shares | 10 304 | 30,61 | 1 640 | 28,25 | ||||
| 2025-08-12 | 13F | Garrett Wealth Advisory Group, LLC | 170 978 | −4,55 | 27 885 | −0,66 | ||||
| 2025-08-12 | 13F | Change Path, LLC | 49 305 | −3,06 | 8 041 | 0,90 | ||||
| 2025-08-15 | 13F | CI Private Wealth, LLC | 7 916 | 111,38 | 1 291 | 120,31 | ||||
| 2025-07-10 | 13F | SK Wealth Management, LLC | 3 382 | 0,59 | 554 | 13,29 | ||||
| 2025-08-07 | 13F | King Luther Capital Management Corp | 810 | 1,00 | ||||||
| 2025-07-09 | 13F | Bank of New Hampshire | 145 | 480,00 | 24 | 666,67 | ||||
| 2025-07-15 | 13F | Graypoint LLC | 1 984 | 0,00 | 324 | 4,19 | ||||
| 2025-07-25 | 13F | NorthRock Partners, LLC | 3 600 | −42,13 | 587 | −39,73 | ||||
| 2025-08-15 | 13F | Captrust Financial Advisors | 1 911 | 312 | ||||||
| 2025-08-08 | 13F | Larson Financial Group LLC | 130 | 0,78 | 21 | 5,00 | ||||
| 2025-08-12 | 13F | Integrated Advisors Network LLC | 2 955 | −7,63 | 482 | −3,99 | ||||
| 2025-08-13 | 13F | Knuff & Co LLC | 188 | −38,36 | 31 | −36,17 |
Other Listings
| MX:QUS |