Grundläggande statistik
| Institutionella ägare | 131 total, 130 long only, 0 short only, 1 long/short - change of 42,39% MRQ |
| Genomsnittlig portföljallokering | 0.2765 % - change of 46,29% MRQ |
| Institutionella aktier (lång) | 4 402 288 (ex 13D/G) - change of 2,37MM shares 116,81% MRQ |
| Institutionellt värde (lång) | $ 215 388 USD ($1000) |
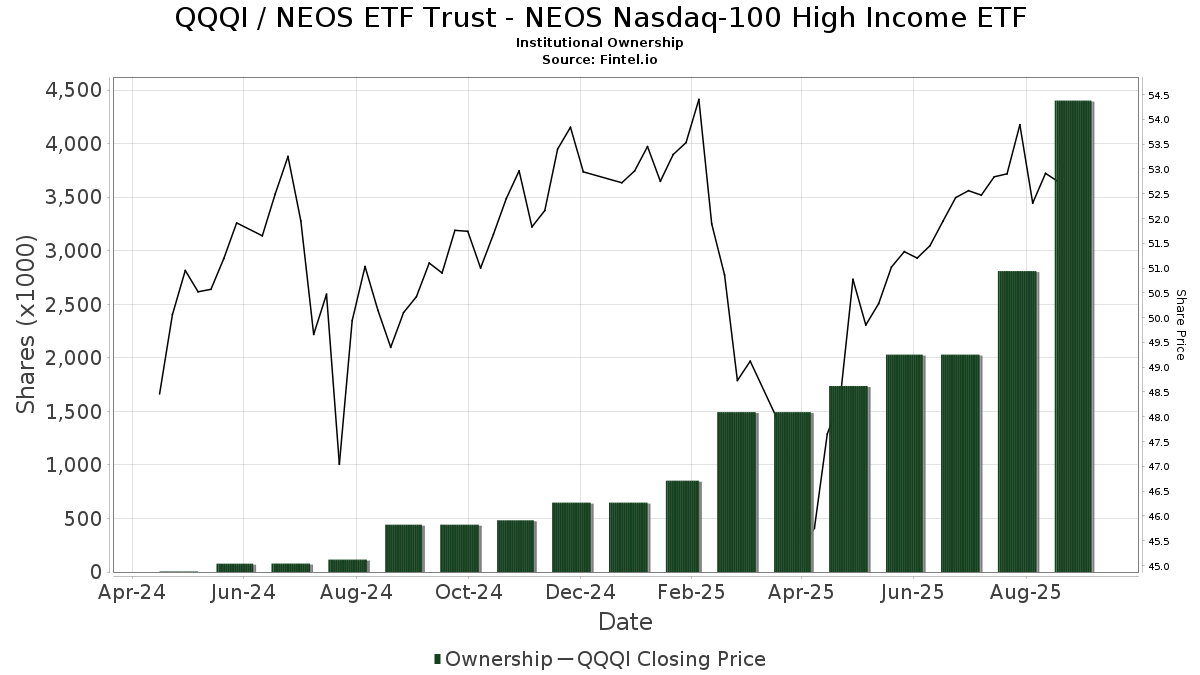
Institutionellt ägande och aktieägare
NEOS ETF Trust - NEOS Nasdaq-100 High Income ETF (US:QQQI) har 131 Institutionella ägare och aktieägare som har lämnat in 13D/G- eller 13F-formulär till Securities Exchange Commission (SEC). Dessa institut innehar totalt 4,402,288 aktier. Största aktieägare inkluderar LPL Financial LLC, Second Half Financial Partners, LLC, Cascade Wealth Advisors, Inc, Tyler-Stone Wealth Management, Renaissance Technologies Llc, Private Advisor Group, LLC, Mml Investors Services, Llc, MBL Wealth, LLC, Capital Investment Advisory Services, LLC, and UBS Group AG .
NEOS ETF Trust - NEOS Nasdaq-100 High Income ETF (NasdaqGM:QQQI) Institutionell ägarstruktur visar institutioners och fonders nuvarande positioner i företaget, samt de senaste förändringarna i positionernas storlek. Större aktieägare kan vara enskilda investerare, fonder, hedgefonder eller institutioner. Bilaga 13D visar att investeraren äger (eller ägde) mer än 5% av företaget och avser (eller avsåg) att aktivt eftersträva en förändring av affärsstrategin. Schedule 13G indikerar en passiv investering på över 5%.
The share price as of September 19, 2025 is 54,62 / share. Previously, on September 20, 2024, the share price was 51,34 / share. This represents an increase of 6,39% over that period.
Fondsentimentets poäng
Fondsentimentet poängen(fka Ägarackumulation-poäng) visar vilka aktier som är mest köpta av fonder. Det är resultatet av en sofistikerad kvantitativ flerfaktormodell som identifierar företag med de högsta nivåerna av institutionell ackumulering. Poängsättningsmodellen använder en kombination av den totala ökningen av redovisade ägare, förändringarna i portföljallokeringarna för dessa ägare och andra mått. Siffran sträcker sig från 0 till 100, där högre siffror indikerar en högre nivå av ackumulering i förhållande till sina konkurrenter, och 50 är genomsnittet.
Uppdateringsfrekvens: Dagligen
Se Ownership Explorer, som innehåller en lista över de högst rankade företagen.
AI+ Ask Fintel’s AI assistant about NEOS ETF Trust - NEOS Nasdaq-100 High Income ETF.
Thinking of good questions…
Institutionell sälj/köp-kvot
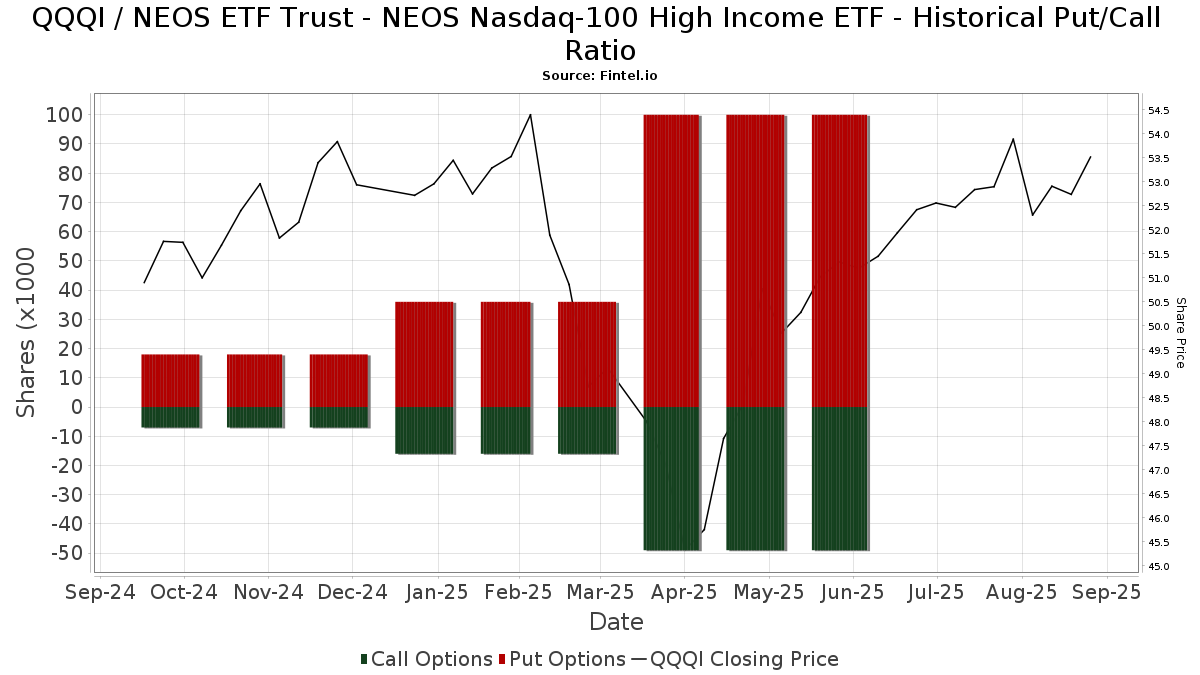
Förutom att rapportera vanliga eget kapital- och skuldemissioner måste institutioner med mer än 100MM tillgångar under förvaltning också avslöja sina innehav av sälj- och köpoptioner. Eftersom säljoptioner i allmänhet indikerar ett negativt sentiment och köpoptioner indikerar ett positivt sentiment, kan vi få en uppfattning om det övergripande institutionella sentimentet genom att plotta förhållandet mellan säljoptioner och köpoptioner. Diagrammet till höger visar det historiska förhållandet mellan sälj- och köpoptioner för detta instrument.
Genom att använda sälj/köp-kvoten som en indikator på aktieägarnas sentiment undviker man en av de största bristerna med att använda det totala institutionella ägandet, nämligen att en betydande del av de förvaltade tillgångarna investeras passivt för att följa index. Passivt förvaltade fonder köper vanligtvis inte optioner, så indikatorn för sälj/köp-kvoten ger en bättre bild av stämningen i aktivt förvaltade fonder.
13F- och NPORT-arkiveringar
Detaljer om 13F-arkiveringar är gratis. Detaljer om NP-arkiveringar kräver ett premiummedlemskap. Gröna rader indikerar nya positioner. Röda rader indikerar stängda positioner. Klicka på länk symbolen för att se hela transaktionshistoriken.
Uppgradera
för att låsa upp premiumdata och exportera till Excel ![]() .
.
| Fil Datum | Källa | Investerare | Typ | Genomsnittligt pris (beräknat) |
Aktier | Δ Aktier (%) |
Rapporterat värde (1000 USD) |
Δ Värde (%) |
Portföljallokering (%) |
|
|---|---|---|---|---|---|---|---|---|---|---|
| 2025-07-16 | 13F | Magnus Financial Group LLC | 4 401 | 229 | ||||||
| 2025-05-21 | 13F | Westbourne Investments, Inc. | 0 | −100,00 | 0 | |||||
| 2025-07-24 | 13F | IFP Advisors, Inc | 9 018 | 31,73 | 469 | 44,44 | ||||
| 2025-07-28 | 13F | WealthPLAN Partners, LLC | 5 137 | 0,12 | 267 | 9,88 | ||||
| 2025-07-11 | 13F | Seacrest Wealth Management, Llc | 13 190 | 99,85 | 686 | 119,17 | ||||
| 2025-07-28 | 13F | Harbour Investments, Inc. | 1 140 | 590,91 | 59 | 742,86 | ||||
| 2025-08-12 | 13F | RPG Investment Advisory, LLC | 0 | −100,00 | 0 | |||||
| 2025-08-14 | 13F | UBS Group AG | 101 564 | 116,49 | 5 282 | 137,39 | ||||
| 2025-08-05 | 13F | Strategic Financial Concepts, LLC | 5 550 | 231 | ||||||
| 2025-08-05 | 13F | Claro Advisors LLC | 5 265 | −14,46 | 274 | −6,19 | ||||
| 2025-08-14 | 13F | Stifel Financial Corp | 92 529 | 9,91 | 4 813 | 20,54 | ||||
| 2025-05-14 | 13F | Jane Street Group, Llc | 0 | −100,00 | 0 | |||||
| 2025-07-08 | 13F/A | Salem Investment Counselors Inc | 215 | 11 | ||||||
| 2025-08-14 | 13F | Citadel Advisors Llc | Call | 49 500 | 207,45 | 2 574 | 237,35 | |||
| 2025-08-12 | 13F | Jpmorgan Chase & Co | 31 | 2 | ||||||
| 2025-07-23 | 13F | Gainplan LLC | 16 687 | 88,53 | 868 | 106,92 | ||||
| 2025-08-11 | 13F | Cascade Wealth Advisors, Inc | 229 341 | 674,07 | 12 256 | 788,04 | ||||
| 2025-07-30 | 13F | Bogart Wealth, LLC | 21 | 1 | ||||||
| 2025-08-06 | 13F | Commonwealth Equity Services, Llc | 20 194 | 15,16 | 1 | |||||
| 2025-07-15 | 13F | World Equity Group, Inc. | 8 341 | 434 | ||||||
| 2025-08-08 | 13F | Capital Investment Advisory Services, LLC | 116 864 | 54,78 | 6 078 | 69,73 | ||||
| 2025-08-12 | 13F | Park Square Financial Group, LLC | 8 250 | 117,11 | 429 | 138,33 | ||||
| 2025-08-14 | 13F | Raymond James Financial Inc | 419 | 22 | ||||||
| 2025-08-14 | 13F | Diversify Wealth Management, Llc | 7 187 | 27,59 | 387 | 44,03 | ||||
| 2025-07-16 | 13F | Brown, Lisle/cummings, Inc. | 3 525 | 0,00 | 183 | 9,58 | ||||
| 2025-08-07 | 13F | Commerce Bank | 9 433 | 491 | ||||||
| 2025-07-31 | 13F | Curio Wealth, Llc | 0 | −100,00 | 0 | |||||
| 2025-08-15 | 13F | CI Private Wealth, LLC | 38 836 | 2 020 | ||||||
| 2025-08-04 | 13F | Arkadios Wealth Advisors | 5 735 | 298 | ||||||
| 2025-07-23 | 13F | RMG Wealth Management LLC | 250 | 13 | ||||||
| 2025-08-14 | 13F | Goldman Sachs Group Inc | 10 000 | 520 | ||||||
| 2025-08-12 | 13F | BlackRock, Inc. | 5 522 | 31,29 | 287 | 44,22 | ||||
| 2025-08-08 | 13F | Davies Financial Advisors, Inc. | 10 022 | 521 | ||||||
| 2025-08-12 | 13F | Proequities, Inc. | 0 | 0 | ||||||
| 2025-08-11 | 13F | Private Advisor Group, LLC | 164 644 | 617,75 | 8 563 | 687,04 | ||||
| 2025-08-14 | 13F | Citadel Advisors Llc | 17 447 | 907 | ||||||
| 2025-08-14 | 13F | Citadel Advisors Llc | Put | 100 500 | 172,36 | 5 227 | 198,69 | |||
| 2025-08-11 | 13F | Nations Financial Group Inc, /ia/ /adv | 9 574 | 17,34 | 498 | 28,76 | ||||
| 2025-07-18 | 13F | Truist Financial Corp | 5 460 | 0,40 | 284 | 10,12 | ||||
| 2025-07-29 | 13F | International Assets Investment Management, Llc | 5 523 | 23,28 | 287 | 35,38 | ||||
| 2025-07-25 | 13F | Alpha Financial Partners, LLC | 24 081 | 1 252 | ||||||
| 2025-08-19 | 13F | Newbridge Financial Services Group, Inc. | 37 670 | 37,36 | 1 959 | 50,69 | ||||
| 2025-08-14 | 13F | Napa Wealth Management | 0 | −100,00 | 0 | |||||
| 2025-05-14 | 13F | Ameriprise Financial Inc | 0 | −100,00 | 0 | |||||
| 2025-08-14 | 13F | Arete Wealth Advisors, LLC | 30 064 | 169,73 | 2 | |||||
| 2025-07-23 | 13F | RiverTree Advisors, LLC | 51 390 | 98,65 | 2 673 | 117,77 | ||||
| 2025-07-21 | 13F | DHJJ Financial Advisors, Ltd. | 5 | 0,00 | 0 | |||||
| 2025-07-25 | 13F | Apollon Wealth Management, LLC | 58 286 | 62,18 | 3 031 | 77,88 | ||||
| 2025-08-12 | 13F | Coston, McIsaac & Partners | 46 | 0,00 | 0 | |||||
| 2025-07-14 | 13F | Armstrong Advisory Group, Inc | 3 622 | 188 | ||||||
| 2025-07-14 | 13F | Palacios Wealth Management, LLC | 46 899 | 361,60 | 2 439 | 407,07 | ||||
| 2025-08-13 | 13F | Lido Advisors, LLC | 12 601 | 36,97 | 655 | 50,23 | ||||
| 2025-07-25 | 13F | Cwm, Llc | 3 072 | 65,16 | 0 | |||||
| 2025-08-04 | 13F | Assetmark, Inc | 222 | 12 | ||||||
| 2025-08-14 | 13F | Summit Trail Advisors, Llc | 4 000 | 208 | ||||||
| 2025-08-14 | 13F | Great Valley Advisor Group, Inc. | 4 358 | 1,00 | 227 | 10,78 | ||||
| 2025-07-21 | 13F | Ameritas Advisory Services, LLC | 23 | 1 | ||||||
| 2025-07-21 | 13F | Capital Planning LLC | 4 723 | 246 | ||||||
| 2025-08-01 | 13F | FSA Advisors, Inc. | 23 193 | 159,57 | 1 206 | 185,11 | ||||
| 2025-08-18 | 13F | Tyler-Stone Wealth Management | 196 455 | 17,13 | 10 218 | 28,43 | ||||
| 2025-08-04 | 13F | Atria Investments Llc | 8 433 | 77,95 | 439 | 95,54 | ||||
| 2025-07-29 | 13F | Stephens Inc /ar/ | 15 680 | 816 | ||||||
| 2025-07-30 | 13F | Brookstone Capital Management | 27 274 | 1 419 | ||||||
| 2025-08-07 | 13F | Montag A & Associates Inc | 7 155 | 30,04 | 372 | 43,08 | ||||
| 2025-07-25 | 13F | Second Half Financial Partners, LLC | 503 162 | 50,68 | 26 169 | 65,23 | ||||
| 2025-08-05 | 13F | Simplex Trading, Llc | 0 | −100,00 | 0 | |||||
| 2025-08-14 | 13F | Mml Investors Services, Llc | 161 345 | 65,35 | 8 | 100,00 | ||||
| 2025-09-02 | 13F | Pvg Asset Management Corp | 6 581 | 342 | ||||||
| 2025-07-09 | 13F | Sunpointe, LLC | 7 928 | 412 | ||||||
| 2025-08-13 | 13F | Northwestern Mutual Wealth Management Co | 185 | 10 | ||||||
| 2025-08-14 | 13F | Comerica Bank | 2 461 | 128 | ||||||
| 2025-08-04 | 13F | ELCO Management Co., LLC | 4 900 | 255 | ||||||
| 2025-08-12 | 13F | LPL Financial LLC | 775 778 | 106,52 | 40 348 | 126,46 | ||||
| 2025-08-15 | 13F | Captrust Financial Advisors | 5 687 | 296 | ||||||
| 2025-08-13 | 13F | Keystone Financial Group | 4 000 | 208 | ||||||
| 2025-05-15 | 13F | Old Mission Capital Llc | 0 | −100,00 | 0 | −100,00 | ||||
| 2025-08-14 | 13F | Group One Trading, L.p. | 0 | −100,00 | 0 | |||||
| 2025-07-29 | 13F | Private Trust Co Na | 3 874 | 11,51 | 201 | 22,56 | ||||
| 2025-08-14 | 13F | Integrated Wealth Concepts LLC | 5 494 | 286 | ||||||
| 2025-08-15 | 13F | Kestra Advisory Services, LLC | 23 606 | 153,83 | 1 228 | 178,23 | ||||
| 2025-07-31 | 13F | Cambridge Investment Research Advisors, Inc. | 50 774 | 210,47 | 3 | |||||
| 2025-08-04 | 13F/A | 626 Financial, LLC | 5 620 | 0,00 | 292 | 9,77 | ||||
| 2025-07-31 | 13F | Oppenheimer & Co Inc | 16 306 | 848 | ||||||
| 2025-09-04 | 13F/A | Advisor Group Holdings, Inc. | 4 176 | 926,04 | 217 | 1 042,11 | ||||
| 2025-08-08 | 13F | Larson Financial Group LLC | 1 | 0,00 | 0 | |||||
| 2025-08-12 | 13F | Global Retirement Partners, LLC | 4 627 | 9 342,86 | 241 | 11 900,00 | ||||
| 2025-07-16 | 13F | Owen LaRue, LLC | 14 821 | 771 | ||||||
| 2025-07-29 | 13F | Stratos Wealth Advisors, LLC | 14 628 | 0,23 | 761 | 9,83 | ||||
| 2025-08-01 | 13F | Delta Investment Management, LLC | 4 795 | −7,00 | 249 | 2,05 | ||||
| 2025-07-10 | 13F | Redhawk Wealth Advisors, Inc. | 5 999 | 3,48 | 312 | 13,87 | ||||
| 2025-08-14 | 13F | Royal Bank Of Canada | 82 506 | 31 879,07 | 4 291 | 32 907,69 | ||||
| 2025-07-28 | 13F | RFG Advisory, LLC | 62 139 | 247,03 | 3 232 | 280,57 | ||||
| 2025-08-13 | 13F | Brown Advisory Inc | 9 392 | 0,00 | 488 | 9,66 | ||||
| 2025-08-14 | 13F | GWM Advisors LLC | 6 890 | 189,25 | 358 | 219,64 | ||||
| 2025-08-08 | 13F | Fortis Group Advisors, LLC | 17 125 | 901 | ||||||
| 2025-07-31 | 13F | CAP Partners, LLC | 24 857 | 4,34 | 1 293 | 14,44 | ||||
| 2025-08-12 | 13F | BlueStem Wealth Partners, LLC | 19 023 | 989 | ||||||
| 2025-08-14 | 13F | CoreCap Advisors, LLC | 9 700 | 23,39 | 505 | 35,48 | ||||
| 2025-08-04 | 13F | Bay Colony Advisory Group, Inc d/b/a Bay Colony Advisors | 7 309 | 380 | ||||||
| 2025-08-14 | 13F | Gotham Asset Management, LLC | 49 250 | 2 561 | ||||||
| 2025-08-14 | 13F | Susquehanna International Group, Llp | 18 521 | −76,81 | 963 | −74,58 | ||||
| 2025-08-08 | 13F | Pnc Financial Services Group, Inc. | 1 986 | 0,00 | 103 | 9,57 | ||||
| 2025-08-14 | 13F | Camarda Financial Advisors, LLC | 7 350 | 6,12 | 382 | 16,46 | ||||
| 2025-07-31 | 13F | City State Bank | 2 000 | 100,00 | 104 | 121,28 | ||||
| 2025-08-12 | 13F | Gladstone Institutional Advisory LLC | 22 874 | −33,52 | 1 190 | −27,10 | ||||
| 2025-07-14 | 13F | U.S. Capital Wealth Advisors, LLC | 25 249 | 137,86 | 1 313 | 161,03 | ||||
| 2025-07-25 | 13F | Concurrent Investment Advisors, LLC | 12 996 | 95,43 | 676 | 114,29 | ||||
| 2025-08-11 | 13F | NewEdge Wealth, LLC | 12 175 | 0,00 | 646 | 11,79 | ||||
| 2025-08-14 | 13F | Wells Fargo & Company/mn | 2 753 | −1,92 | 143 | 7,52 | ||||
| 2025-08-15 | 13F | Equitable Holdings, Inc. | 10 256 | 533 | ||||||
| 2025-07-22 | 13F | MBL Wealth, LLC | 119 401 | 6 210 | ||||||
| 2025-08-12 | 13F | Steward Partners Investment Advisory, Llc | 18 | 1 | ||||||
| 2025-08-19 | 13F | Cape Investment Advisory, Inc. | 340 | −22,73 | 18 | −15,00 | ||||
| 2025-07-10 | 13F | High Net Worth Advisory Group LLC | 17 911 | −18,17 | 932 | −10,31 | ||||
| 2025-07-29 | 13F | Stratos Wealth Partners, LTD. | 55 867 | 15,59 | 2 906 | 26,75 | ||||
| 2025-07-29 | 13F | Balboa Wealth Partners | 5 005 | −32,77 | 260 | −26,35 | ||||
| 2025-08-11 | 13F | Pin Oak Investment Advisors Inc | 50 | 0,00 | 0 | |||||
| 2025-08-04 | 13F | Roble, Belko & Company, Inc | 99 | 0 | ||||||
| 2025-08-01 | 13F | Envestnet Asset Management Inc | 73 870 | 960,89 | 3 842 | 1 063,94 | ||||
| 2025-07-18 | 13F | PFG Investments, LLC | 51 694 | 92,58 | 2 689 | 111,15 | ||||
| 2025-08-13 | 13F | Jones Financial Companies Lllp | 195 | 10 | ||||||
| 2025-07-11 | 13F | Farther Finance Advisors, LLC | 0 | −100,00 | 0 | |||||
| 2025-08-08 | 13F | Cetera Investment Advisers | 32 700 | 257,57 | 1 701 | 292,61 | ||||
| 2025-07-15 | 13F | Norden Group Llc | 5 301 | 276 | ||||||
| 2025-08-14 | 13F | Garden State Investment Advisory Services LLC | 16 614 | 85,71 | 864 | 103,77 | ||||
| 2025-08-14 | 13F | TCG Advisory Services, LLC | 7 825 | 407 | ||||||
| 2025-08-15 | 13F | Morgan Stanley | 2 855 | 285,81 | 148 | 322,86 | ||||
| 2025-08-11 | 13F | HighTower Advisors, LLC | 23 194 | 31,93 | 1 206 | 44,78 | ||||
| 2025-08-14 | 13F | Snowden Capital Advisors LLC | 5 525 | 287 | ||||||
| 2025-08-04 | 13F | Creative Financial Designs Inc /adv | 2 360 | −43,42 | 123 | −38,07 | ||||
| 2025-07-10 | 13F | Atticus Wealth Management, Llc | 2 592 | −18,67 | 135 | −11,26 | ||||
| 2025-08-13 | 13F | Capital Analysts, Inc. | 373 | 0 | ||||||
| 2025-08-14 | 13F | Bank Of America Corp /de/ | 3 000 | 156 | ||||||
| 2025-07-14 | 13F | AdvisorNet Financial, Inc | 8 266 | 356,69 | 430 | 404,71 | ||||
| 2025-08-04 | 13F | Spire Wealth Management | 0 | −100,00 | 0 | |||||
| 2025-08-13 | 13F | Grantvest Financial Group LLC | 42 713 | 1,90 | 2 222 | 11,72 | ||||
| 2025-08-07 | 13F | Allworth Financial LP | 5 189 | 214,87 | 270 | 249,35 | ||||
| 2025-08-08 | 13F | Kingsview Wealth Management, LLC | 26 284 | 174,68 | 1 367 | 201,77 | ||||
| 2025-08-13 | 13F | Quadrature Capital Ltd | 89 941 | 4 678 | ||||||
| 2025-08-14 | 13F | Ieq Capital, Llc | 34 051 | 158,10 | 1 771 | 183,20 | ||||
| 2025-07-07 | 13F | Teamwork Financial Advisors, LLC | 32 450 | 1 688 | ||||||
| 2025-08-14 | 13F | Fmr Llc | 200 | 1 718,18 | 10 | |||||
| 2025-05-06 | 13F | AE Wealth Management LLC | 0 | −100,00 | 0 | |||||
| 2025-07-23 | 13F | MADDEN SECURITIES Corp | 39 975 | 110,78 | 2 079 | 131,26 | ||||
| 2025-08-13 | 13F | Renaissance Technologies Llc | 169 000 | 8 790 | ||||||
| 2025-07-30 | 13F | Red Crane Wealth Management, Llc | 5 764 | 1,55 | 300 | 11,15 | ||||
| 2025-05-12 | 13F | Prestige Wealth Management Group LLC | 0 | −100,00 | 0 |