Grundläggande statistik
| Institutionella ägare | 136 total, 136 long only, 0 short only, 0 long/short - change of −0,72% MRQ |
| Genomsnittlig portföljallokering | 0.3019 % - change of −18,81% MRQ |
| Institutionella aktier (lång) | 17 382 641 (ex 13D/G) - change of 1,52MM shares 9,59% MRQ |
| Institutionellt värde (lång) | $ 626 229 USD ($1000) |
Institutionellt ägande och aktieägare
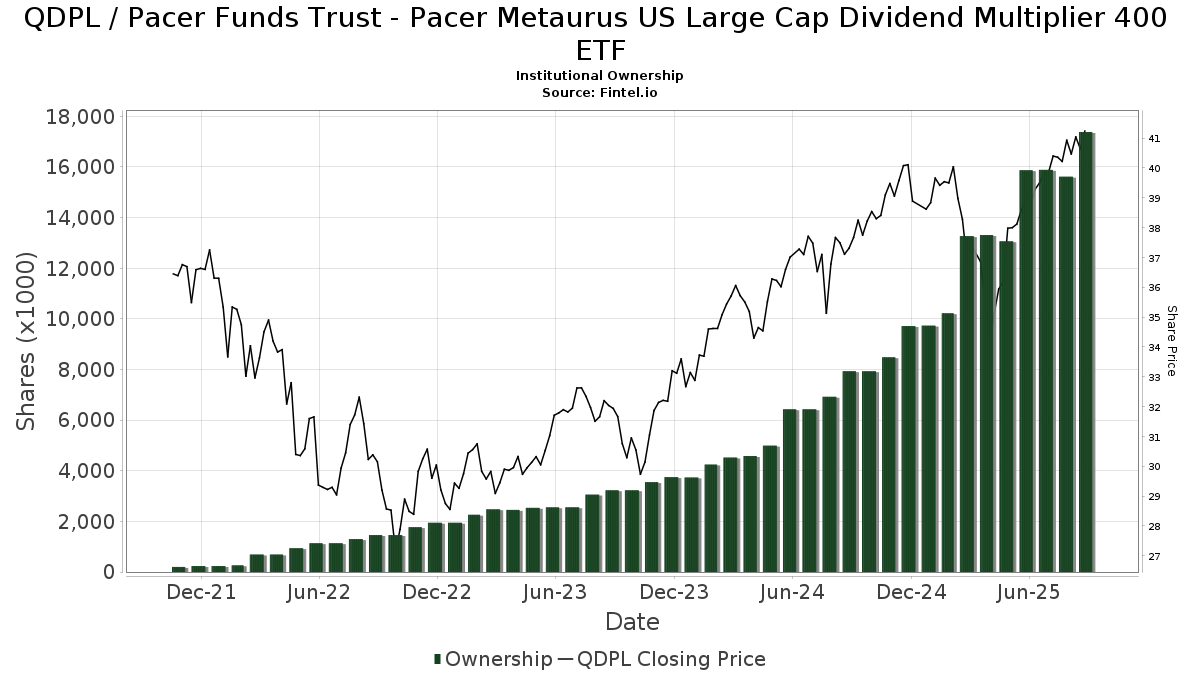
Pacer Funds Trust - Pacer Metaurus US Large Cap Dividend Multiplier 400 ETF (US:QDPL) har 136 Institutionella ägare och aktieägare som har lämnat in 13D/G- eller 13F-formulär till Securities Exchange Commission (SEC). Dessa institut innehar totalt 17,382,641 aktier. Största aktieägare inkluderar LPL Financial LLC, Bank Of America Corp /de/, Royal Bank Of Canada, Morgan Stanley, Raymond James Financial Inc, Stratos Wealth Partners, LTD., Advisory Resource Group, Cambridge Investment Research Advisors, Inc., Northwestern Mutual Wealth Management Co, and Advisor Group Holdings, Inc. .
Pacer Funds Trust - Pacer Metaurus US Large Cap Dividend Multiplier 400 ETF (ARCA:QDPL) Institutionell ägarstruktur visar institutioners och fonders nuvarande positioner i företaget, samt de senaste förändringarna i positionernas storlek. Större aktieägare kan vara enskilda investerare, fonder, hedgefonder eller institutioner. Bilaga 13D visar att investeraren äger (eller ägde) mer än 5% av företaget och avser (eller avsåg) att aktivt eftersträva en förändring av affärsstrategin. Schedule 13G indikerar en passiv investering på över 5%.
The share price as of September 15, 2025 is 41,69 / share. Previously, on September 16, 2024, the share price was 37,68 / share. This represents an increase of 10,64% over that period.
Fondsentimentets poäng
Fondsentimentet poängen(fka Ägarackumulation-poäng) visar vilka aktier som är mest köpta av fonder. Det är resultatet av en sofistikerad kvantitativ flerfaktormodell som identifierar företag med de högsta nivåerna av institutionell ackumulering. Poängsättningsmodellen använder en kombination av den totala ökningen av redovisade ägare, förändringarna i portföljallokeringarna för dessa ägare och andra mått. Siffran sträcker sig från 0 till 100, där högre siffror indikerar en högre nivå av ackumulering i förhållande till sina konkurrenter, och 50 är genomsnittet.
Uppdateringsfrekvens: Dagligen
Se Ownership Explorer, som innehåller en lista över de högst rankade företagen.
Institutionell sälj/köp-kvot
Förutom att rapportera vanliga eget kapital- och skuldemissioner måste institutioner med mer än 100MM tillgångar under förvaltning också avslöja sina innehav av sälj- och köpoptioner. Eftersom säljoptioner i allmänhet indikerar ett negativt sentiment och köpoptioner indikerar ett positivt sentiment, kan vi få en uppfattning om det övergripande institutionella sentimentet genom att plotta förhållandet mellan säljoptioner och köpoptioner. Diagrammet till höger visar det historiska förhållandet mellan sälj- och köpoptioner för detta instrument.
Genom att använda sälj/köp-kvoten som en indikator på aktieägarnas sentiment undviker man en av de största bristerna med att använda det totala institutionella ägandet, nämligen att en betydande del av de förvaltade tillgångarna investeras passivt för att följa index. Passivt förvaltade fonder köper vanligtvis inte optioner, så indikatorn för sälj/köp-kvoten ger en bättre bild av stämningen i aktivt förvaltade fonder.
13F- och NPORT-arkiveringar
Detaljer om 13F-arkiveringar är gratis. Detaljer om NP-arkiveringar kräver ett premiummedlemskap. Gröna rader indikerar nya positioner. Röda rader indikerar stängda positioner. Klicka på länk symbolen för att se hela transaktionshistoriken.
Uppgradera
för att låsa upp premiumdata och exportera till Excel ![]() .
.
| Fil Datum | Källa | Investerare | Typ | Genomsnittligt pris (beräknat) |
Aktier | Δ Aktier (%) |
Rapporterat värde (1000 USD) |
Δ Värde (%) |
Portföljallokering (%) |
|
|---|---|---|---|---|---|---|---|---|---|---|
| 2025-08-04 | 13F | Pensionmark Financial Group, Llc | 11 565 | 0,24 | 456 | 8,31 | ||||
| 2025-08-15 | 13F | Kestra Advisory Services, LLC | 79 275 | 3,48 | 3 128 | 11,83 | ||||
| 2025-08-14 | 13F | Bank Of America Corp /de/ | 1 751 422 | 27,37 | 69 111 | 37,63 | ||||
| 2025-08-01 | 13F | Brookwood Investment Group LLC | 26 985 | 12,53 | 1 065 | 21,60 | ||||
| 2025-05-01 | 13F | Stillwater Wealth Management Group | 82 005 | 34,62 | 2 995 | 28,06 | ||||
| 2025-08-14 | 13F | Modern Wealth Management, LLC | 74 540 | 38,47 | 2 941 | 49,67 | ||||
| 2025-07-18 | 13F | Requisite Capital Management, LLC | 50 868 | 4,63 | 2 012 | 11,16 | ||||
| 2025-08-14 | 13F | Comerica Bank | 285 | −74,69 | 11 | −73,17 | ||||
| 2025-07-07 | 13F | Teamwork Financial Advisors, LLC | 64 163 | 1,05 | 2 532 | 9,19 | ||||
| 2025-07-18 | 13F | QTR Family Wealth, LLC | 11 681 | 0,16 | 461 | 8,24 | ||||
| 2025-07-31 | 13F | Guardian Financial Partners, LLC | 67 715 | 5,23 | 2 672 | 13,75 | ||||
| 2025-07-29 | 13F | Stratos Wealth Partners, LTD. | 1 036 464 | −1,47 | 40 899 | 6,46 | ||||
| 2025-07-16 | 13F | Independent Wealth Network Inc. | 0 | −100,00 | 0 | |||||
| 2025-08-12 | 13F | BlackRock, Inc. | 19 246 | 1,43 | 759 | 9,68 | ||||
| 2025-08-14 | 13F | Sunbelt Securities, Inc. | 6 620 | −1,34 | 254 | 3,67 | ||||
| 2025-07-28 | 13F | Harbour Investments, Inc. | 37 116 | 74,18 | 1 465 | 88,17 | ||||
| 2025-08-11 | 13F | Nations Financial Group Inc, /ia/ /adv | 11 978 | 0,00 | 473 | 8,01 | ||||
| 2025-08-14 | 13F | Qube Research & Technologies Ltd | 679 | 27 | ||||||
| 2025-04-22 | 13F | World Equity Group, Inc. | 0 | −100,00 | 0 | |||||
| 2025-08-04 | 13F | Creative Financial Designs Inc /adv | 3 470 | 0,23 | 137 | 7,94 | ||||
| 2025-08-13 | 13F | EverSource Wealth Advisors, LLC | 1 500 | 59 | ||||||
| 2025-08-13 | 13F | BlackDiamond Wealth Management Inc. | 106 965 | −23,84 | 4 214 | −18,62 | ||||
| 2025-08-29 | 13F | Centaurus Financial, Inc. | 7 612 | −3,89 | 0 | |||||
| 2025-08-08 | 13F | Pnc Financial Services Group, Inc. | 1 000 | 0,00 | 39 | 8,33 | ||||
| 2025-08-08 | 13F | Avantax Advisory Services, Inc. | 72 870 | 39,42 | 2 875 | 50,68 | ||||
| 2025-08-13 | 13F | Gateway Wealth Partners, LLC | 8 731 | −0,08 | 345 | 7,84 | ||||
| 2025-07-16 | 13F | Spinnaker Investment Group, LLC | 10 288 | 406 | ||||||
| 2025-07-16 | 13F | Register Financial Advisors LLC | 2 899 | 1,08 | 114 | 9,62 | ||||
| 2025-08-14 | 13F | Guardian Wealth Advisors, Llc / Nc | 475 | 0,00 | 19 | 5,88 | ||||
| 2025-07-24 | 13F | WMG Financial Advisors, LLC | 8 290 | 23,05 | 327 | 32,93 | ||||
| 2025-08-07 | 13F | PFG Advisors | 9 191 | 54,73 | 363 | 67,59 | ||||
| 2025-08-13 | 13F | Flow Traders U.s. Llc | 0 | −100,00 | 0 | |||||
| 2025-07-07 | 13F | Global Wealth Strategies & Associates | 0 | −100,00 | 0 | |||||
| 2025-08-19 | 13F | Anchor Investment Management, LLC | 19 830 | −3,46 | 782 | 4,27 | ||||
| 2025-08-14 | 13F | Hrt Financial Lp | 0 | −100,00 | 0 | |||||
| 2025-07-29 | 13F | Private Trust Co Na | 4 906 | −7,54 | 194 | 0,00 | ||||
| 2025-08-13 | 13F | Safe Harbor Fiduciary, LLC | 103 309 | 4 077 | ||||||
| 2025-07-15 | 13F | Cora Capital Advisors Llc | 16 808 | 17,47 | 663 | 27,01 | ||||
| 2025-07-31 | 13F | Richards, Merrill & Peterson, Inc. | 0 | −100,00 | 0 | |||||
| 2025-07-31 | 13F | Oppenheimer & Co Inc | 8 567 | 338 | ||||||
| 2025-08-14 | 13F | Wells Fargo & Company/mn | 2 915 | 1 080,16 | 115 | 1 177,78 | ||||
| 2025-07-30 | 13F | D.a. Davidson & Co. | 6 365 | 251 | ||||||
| 2025-04-30 | 13F | 49 Wealth Management, Llc | 0 | −100,00 | 0 | |||||
| 2025-08-13 | 13F | Jones Financial Companies Lllp | 0 | −100,00 | 0 | |||||
| 2025-04-22 | 13F | Consolidated Planning Corp | 0 | −100,00 | 0 | |||||
| 2025-08-14 | 13F | Old Mission Capital Llc | 5 532 | 218 | ||||||
| 2025-08-14 | 13F | Mercer Global Advisors Inc /adv | 0 | −100,00 | 0 | |||||
| 2025-08-13 | 13F | Baird Financial Group, Inc. | 27 491 | 8,21 | 1 085 | 16,94 | ||||
| 2025-08-14 | 13F | Camarda Financial Advisors, LLC | 5 405 | 213 | ||||||
| 2025-07-25 | 13F | Envestnet Portfolio Solutions, Inc. | 0 | −100,00 | 0 | |||||
| 2025-08-14 | 13F | Ausdal Financial Partners, Inc. | 5 351 | 211 | ||||||
| 2025-08-05 | 13F | Benchmark Financial Wealth Advisors, LLC | 37 523 | 30,83 | 1 481 | 41,36 | ||||
| 2025-08-06 | 13F | Moors & Cabot, Inc. | 5 659 | −1,67 | 223 | 6,19 | ||||
| 2025-08-13 | 13F | Empire Financial Management Company, LLC | 119 467 | 1,50 | 4 714 | 9,68 | ||||
| 2025-09-04 | 13F/A | Advisor Group Holdings, Inc. | 439 997 | 6,99 | 17 363 | 15,61 | ||||
| 2025-07-15 | 13F | BigSur Wealth Management LLC | 11 000 | 0,00 | 440 | 7,86 | ||||
| 2025-07-31 | 13F | West Michigan Advisors, Llc | 75 928 | 5,53 | 3 034 | 13,85 | ||||
| 2025-05-09 | 13F | Campbell Capital Management Inc | 0 | −100,00 | 0 | |||||
| 2025-07-09 | 13F | Lifestyle Asset Management, Inc. | 52 225 | −6,70 | 2 061 | 0,78 | ||||
| 2025-08-01 | 13F | Private Wealth Partners, LLC | 40 950 | 0,00 | 1 616 | 8,03 | ||||
| 2025-07-08 | 13F | Silverleafe Capital Partners, LLC | 5 985 | −16,32 | 236 | −9,58 | ||||
| 2025-08-13 | 13F | StoneX Group Inc. | 25 757 | 6,62 | 1 029 | 15,62 | ||||
| 2025-08-04 | 13F | Atria Investments Llc | 18 534 | −39,88 | 731 | −35,02 | ||||
| 2025-07-30 | 13F | Onyx Bridge Wealth Group LLC | 5 574 | −96,96 | 220 | −96,73 | ||||
| 2025-05-14 | 13F | Jane Street Group, Llc | 0 | −100,00 | 0 | |||||
| 2025-08-04 | 13F | Spire Wealth Management | 0 | −100,00 | 0 | |||||
| 2025-08-06 | 13F | Founders Financial Securities Llc | 7 090 | 280 | ||||||
| 2025-08-18 | 13F | Geneos Wealth Management Inc. | 5 881 | 289,47 | 232 | 321,82 | ||||
| 2025-07-10 | 13F | Financial Management Network Inc | 5 551 | 221 | ||||||
| 2025-07-29 | 13F | International Assets Investment Management, Llc | 36 299 | 2,15 | 1 432 | 10,41 | ||||
| 2025-08-14 | 13F | Benjamin Edwards Inc | 13 363 | 527 | ||||||
| 2025-07-21 | 13F | DHJJ Financial Advisors, Ltd. | 10 | 0,00 | 0 | |||||
| 2025-08-14 | 13F | Mml Investors Services, Llc | 347 295 | 43,84 | 14 | 62,50 | ||||
| 2025-08-08 | 13F | Capital Investment Advisory Services, LLC | 45 629 | 5,65 | 1 801 | 14,14 | ||||
| 2025-08-01 | 13F | Redmond Asset Management, LLC | 21 043 | 23,08 | 830 | 33,01 | ||||
| 2025-07-15 | 13F | BCS Wealth Management | 10 768 | 9,54 | 0 | |||||
| 2025-08-15 | 13F | Morgan Stanley | 1 375 599 | 39,83 | 54 281 | 51,09 | ||||
| 2025-08-12 | 13F | Change Path, LLC | 0 | −100,00 | 0 | |||||
| 2025-08-14 | 13F | Mariner, LLC | 381 841 | 15,96 | 15 067 | 25,30 | ||||
| 2025-07-07 | 13F | Nova Wealth Management, Inc. | 1 036 | 41 | ||||||
| 2025-08-15 | 13F | Sugar Maple Asset Management, LLC | 30 852 | −11,16 | 1 217 | −4,02 | ||||
| 2025-07-18 | 13F | Truist Financial Corp | 153 017 | 5,06 | 6 038 | 13,52 | ||||
| 2025-07-10 | 13F | Fortress Wealth Management, Inc. | 76 353 | −0,80 | 3 013 | 7,19 | ||||
| 2025-08-05 | 13F | Code Waechter LLC | 69 756 | 362,79 | 2 753 | |||||
| 2025-07-23 | 13F | Clear Creek Financial Management, LLC | 8 500 | 2,84 | 335 | 11,30 | ||||
| 2025-08-04 | 13F | WNY Asset Management, LLC | 16 844 | 16,01 | 665 | 25,28 | ||||
| 2025-08-05 | 13F | Sigma Planning Corp | 65 489 | 3,40 | 2 584 | 11,72 | ||||
| 2025-05-13 | 13F | Bank Of Montreal /can/ | 0 | −100,00 | 0 | |||||
| 2025-07-14 | 13F | MY Wealth Management Inc. | 85 256 | −49,72 | 3 364 | −45,67 | ||||
| 2025-08-01 | 13F | Envestnet Asset Management Inc | 333 597 | 16,87 | 13 164 | 26,28 | ||||
| 2025-07-24 | 13F | IFP Advisors, Inc | 4 265 | 74,58 | 168 | 88,76 | ||||
| 2025-08-08 | 13F | Cetera Investment Advisers | 139 779 | 36,49 | 5 516 | 47,46 | ||||
| 2025-07-17 | 13F | Janney Montgomery Scott LLC | 147 495 | −2,36 | 6 | 0,00 | ||||
| 2025-07-31 | 13F | Cambridge Investment Research Advisors, Inc. | 621 872 | 8,80 | 25 | 20,00 | ||||
| 2025-08-14 | 13F | Raymond James Financial Inc | 1 087 224 | 28,09 | 42 902 | 38,40 | ||||
| 2025-07-28 | 13F | Axxcess Wealth Management, Llc | 95 540 | −20,73 | 3 770 | −14,34 | ||||
| 2025-05-08 | 13F | BRYN MAWR TRUST Co | 0 | −100,00 | 0 | |||||
| 2025-07-09 | 13F | Channel Wealth Llc | 7 930 | 0,00 | 313 | 7,96 | ||||
| 2025-07-25 | 13F | Atria Wealth Solutions, Inc. | 109 259 | −17,29 | 4 363 | −10,83 | ||||
| 2025-07-29 | 13F | Chicago Partners Investment Group LLC | 65 363 | 0,69 | 2 641 | 12,44 | ||||
| 2025-08-14 | 13F | Stifel Financial Corp | 62 432 | 8,27 | 2 464 | 17,01 | ||||
| 2025-08-14 | 13F | Integrated Wealth Concepts LLC | 51 795 | 15,66 | 2 044 | 24,95 | ||||
| 2025-08-14 | 13F | Warren Averett Asset Management, LLC | 7 425 | 2,37 | 293 | 10,61 | ||||
| 2025-08-12 | 13F | Gladstone Institutional Advisory LLC | 153 192 | 2,68 | 6 045 | 10,94 | ||||
| 2025-08-12 | 13F | BlueStem Wealth Partners, LLC | 15 684 | −14,23 | 619 | −7,35 | ||||
| 2025-08-14 | 13F | Citadel Advisors Llc | 0 | −100,00 | 0 | |||||
| 2025-07-22 | 13F | Coastal Investment Advisors, Inc. | 1 050 | 5,00 | 41 | 13,89 | ||||
| 2025-08-12 | 13F | Global Retirement Partners, LLC | 855 | 17,93 | 34 | 22,22 | ||||
| 2025-08-12 | 13F | Proequities, Inc. | 0 | 0 | ||||||
| 2025-08-13 | 13F | Proactive Wealth Strategies LLC | 0 | −100,00 | 0 | |||||
| 2025-05-12 | 13F | Independent Advisor Alliance | 0 | −100,00 | 0 | |||||
| 2025-08-11 | 13F | HighTower Advisors, LLC | 14 064 | 555 | ||||||
| 2025-08-12 | 13F | Jpmorgan Chase & Co | 0 | −100,00 | 0 | −100,00 | ||||
| 2025-08-01 | 13F | Gwn Securities Inc. | 0 | −100,00 | 0 | |||||
| 2025-08-11 | 13F | Private Advisor Group, LLC | 47 368 | 25,95 | 1 869 | 36,13 | ||||
| 2025-08-06 | 13F | North Capital, Inc. | 111 | −13,95 | 4 | 0,00 | ||||
| 2025-07-09 | 13F | Triumph Capital Management | 5 141 | 203 | ||||||
| 2025-07-10 | 13F | Marshall Financial Group LLC | 5 729 | 0,70 | 227 | 9,66 | ||||
| 2025-08-05 | 13F | Mma Asset Management Llc | 7 468 | 0,00 | 295 | 8,09 | ||||
| 2025-08-08 | 13F | Advisory Resource Group | 983 271 | −8,32 | 38 800 | −0,94 | ||||
| 2025-07-25 | 13F | We Are One Seven, LLC | 23 601 | 45,12 | 931 | 57,00 | ||||
| 2025-08-06 | 13F | Prospera Financial Services Inc | 160 887 | 3,48 | 6 351 | 11,85 | ||||
| 2025-08-06 | 13F | Commonwealth Equity Services, Llc | 378 667 | 2,73 | 15 | 7,69 | ||||
| 2025-08-13 | 13F | Northwestern Mutual Wealth Management Co | 472 908 | 8,60 | 18 661 | 17,34 | ||||
| 2025-08-12 | 13F | Financial Advocates Investment Management | 19 981 | −37,05 | 788 | −32,01 | ||||
| 2025-08-15 | 13F | Provenance Wealth Advisors, LLC | 0 | −100,00 | 0 | −100,00 | ||||
| 2025-07-29 | 13F | Fundamentun, Llc | 18 065 | 713 | ||||||
| 2025-07-29 | 13F | Stephens Inc /ar/ | 99 910 | 10,07 | 3 942 | 18,95 | ||||
| 2025-08-13 | 13F | Continuum Advisory, LLC | 0 | −100,00 | 0 | |||||
| 2025-08-07 | 13F | Kestra Private Wealth Services, Llc | 28 515 | 26,58 | 1 125 | 36,86 | ||||
| 2025-08-13 | 13F | Level Four Advisory Services, Llc | 58 183 | −8,20 | 2 296 | −0,82 | ||||
| 2025-07-17 | 13F | Sound Income Strategies, LLC | 25 | −51,92 | 1 | −100,00 | ||||
| 2025-08-14 | 13F | Royal Bank Of Canada | 1 402 044 | 8,05 | 55 325 | 16,75 | ||||
| 2025-07-03 | 13F | TrueWealth Advisors, LLC | 10 658 | 22,84 | 421 | 32,91 | ||||
| 2025-08-12 | 13F | Founders Financial Alliance, LLC | 42 401 | 0,00 | 1 673 | 8,07 | ||||
| 2025-08-15 | 13F | Equitable Holdings, Inc. | 20 056 | 17,09 | 791 | 34,30 | ||||
| 2025-07-15 | 13F | Optima Capital Llc | 13 925 | 7,41 | 554 | 15,93 | ||||
| 2025-08-12 | 13F | Steward Partners Investment Advisory, Llc | 86 013 | 19,64 | 3 394 | 29,30 | ||||
| 2025-08-12 | 13F | J.w. Cole Advisors, Inc. | 36 747 | 8,53 | 1 450 | 17,31 | ||||
| 2025-08-12 | 13F | LPL Financial LLC | 2 467 216 | 25,23 | 97 356 | 35,32 | ||||
| 2025-07-21 | 13F | Ameritas Advisory Services, LLC | 9 379 | 20,86 | 370 | 24,58 | ||||
| 2025-07-25 | 13F | Apollon Wealth Management, LLC | 0 | −100,00 | 0 | |||||
| 2025-08-06 | 13F | AE Wealth Management LLC | 4 225 | 12,28 | 167 | 21,17 | ||||
| 2025-08-11 | 13F | Aptus Capital Advisors, LLC | 475 | 0,00 | 19 | 5,88 | ||||
| 2025-07-17 | 13F | Clay Northam Wealth Management, LLC | 22 356 | 0,00 | 883 | 8,09 | ||||
| 2025-07-18 | 13F | Wetzel Investment Advisors, Inc. | 20 600 | 34,64 | 823 | 45,41 | ||||
| 2025-07-18 | 13F | Pure Financial Advisors, Inc. | 7 639 | 301 | ||||||
| 2025-07-24 | 13F | Lokken Investment Group LLC | 63 532 | 7,77 | 2 507 | 16,45 | ||||
| 2025-07-11 | 13F | SILVER OAK SECURITIES, Inc | 5 924 | 234 | ||||||
| 2025-08-19 | 13F | Advisory Services Network, LLC | 53 658 | −6,78 | 2 157 | 2,62 | ||||
| 2025-08-14 | 13F | Goldman Sachs Group Inc | 8 843 | 349 | ||||||
| 2025-08-06 | 13F | Capasso Planning Partners LLC | 0 | −100,00 | 0 | |||||
| 2025-07-07 | 13F | Capital Asset Advisory Services LLC | 95 607 | −20,72 | 3 767 | −15,28 | ||||
| 2025-08-14 | 13F | Tripletail Wealth Management, LLC | 44 083 | 1 784 | ||||||
| 2025-08-19 | 13F | National Asset Management, Inc. | 0 | −100,00 | 0 | |||||
| 2025-08-06 | 13F | Valued Wealth Advisors LLC | 529 | 0,00 | 21 | 10,53 | ||||
| 2025-07-10 | 13F | Wealth Enhancement Advisory Services, Llc | 80 187 | 13,88 | 3 195 | 24,27 | ||||
| 2025-08-07 | 13F | Allworth Financial LP | 14 717 | −11,76 | 581 | −2,85 | ||||
| 2025-08-12 | 13F | Marshall & Sterling Wealth Advisors Inc. | 104 325 | 16,01 | 4 115 | 25,27 | ||||
| 2025-07-22 | 13F | Autumn Glory Partners, LLC | 18 200 | 3,66 | 718 | 12,01 | ||||
| 2025-08-01 | 13F | Anson Capital, Inc. | 37 944 | 4,96 | 1 497 | 13,41 | ||||
| 2025-08-14 | 13F | Fmr Llc | 806 | −2,07 | 32 | 3,33 | ||||
| 2025-08-14 | 13F | GWM Advisors LLC | 95 873 | −9,83 | 3 783 | −2,58 | ||||
| 2025-08-04 | 13F | Integrity Alliance, Llc. | 17 580 | −52,03 | 694 | −48,21 |