Grundläggande statistik
| Institutionella ägare | 144 total, 144 long only, 0 short only, 0 long/short - change of 2,86% MRQ |
| Genomsnittlig portföljallokering | 0.3730 % - change of 5,45% MRQ |
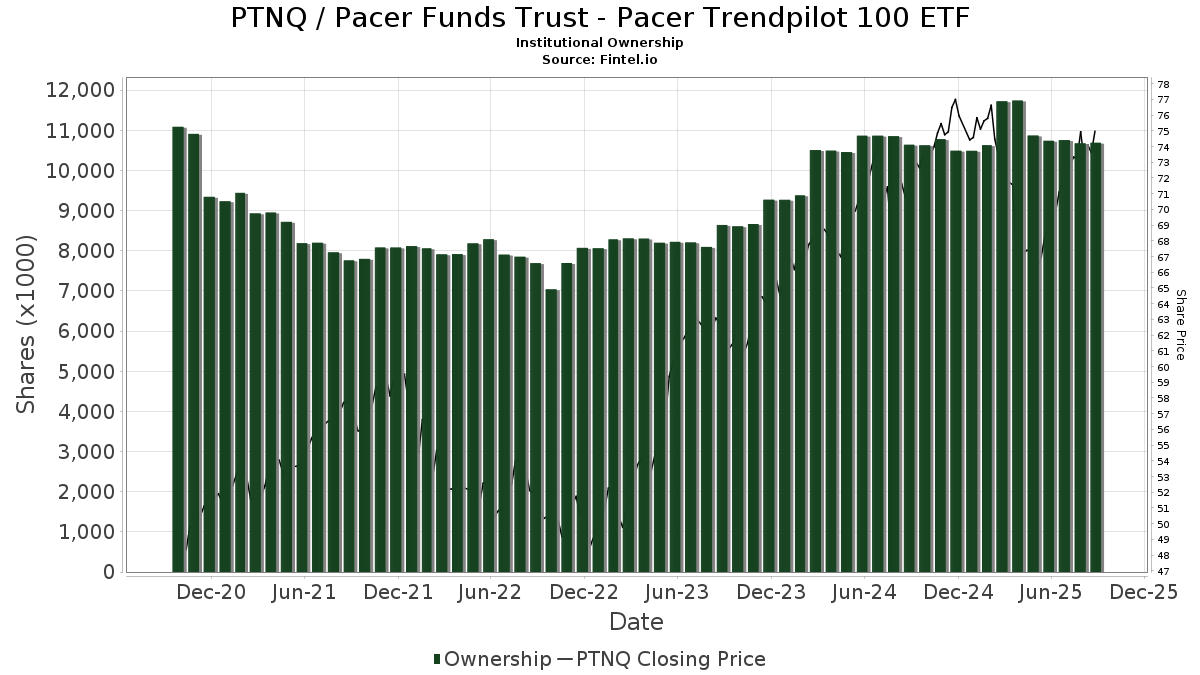
| Institutionella aktier (lång) | 10 690 937 (ex 13D/G) - change of −0,05MM shares −0,45% MRQ |
| Institutionellt värde (lång) | $ 709 241 USD ($1000) |
Institutionellt ägande och aktieägare
Pacer Funds Trust - Pacer Trendpilot 100 ETF (US:PTNQ) har 144 Institutionella ägare och aktieägare som har lämnat in 13D/G- eller 13F-formulär till Securities Exchange Commission (SEC). Dessa institut innehar totalt 10,690,937 aktier. Största aktieägare inkluderar LPL Financial LLC, Morgan Stanley, Bank Of America Corp /de/, Raymond James Financial Inc, Wells Fargo & Company/mn, Cetera Investment Advisers, Cambridge Investment Research Advisors, Inc., Avantax Advisory Services, Inc., UBS Group AG, and ODonnell Financial Services, LLC .
Pacer Funds Trust - Pacer Trendpilot 100 ETF (NasdaqGM:PTNQ) Institutionell ägarstruktur visar institutioners och fonders nuvarande positioner i företaget, samt de senaste förändringarna i positionernas storlek. Större aktieägare kan vara enskilda investerare, fonder, hedgefonder eller institutioner. Bilaga 13D visar att investeraren äger (eller ägde) mer än 5% av företaget och avser (eller avsåg) att aktivt eftersträva en förändring av affärsstrategin. Schedule 13G indikerar en passiv investering på över 5%.
The share price as of September 12, 2025 is 75,66 / share. Previously, on September 12, 2024, the share price was 71,78 / share. This represents an increase of 5,41% over that period.
Fondsentimentets poäng
Fondsentimentet poängen(fka Ägarackumulation-poäng) visar vilka aktier som är mest köpta av fonder. Det är resultatet av en sofistikerad kvantitativ flerfaktormodell som identifierar företag med de högsta nivåerna av institutionell ackumulering. Poängsättningsmodellen använder en kombination av den totala ökningen av redovisade ägare, förändringarna i portföljallokeringarna för dessa ägare och andra mått. Siffran sträcker sig från 0 till 100, där högre siffror indikerar en högre nivå av ackumulering i förhållande till sina konkurrenter, och 50 är genomsnittet.
Uppdateringsfrekvens: Dagligen
Se Ownership Explorer, som innehåller en lista över de högst rankade företagen.
Institutionell sälj/köp-kvot
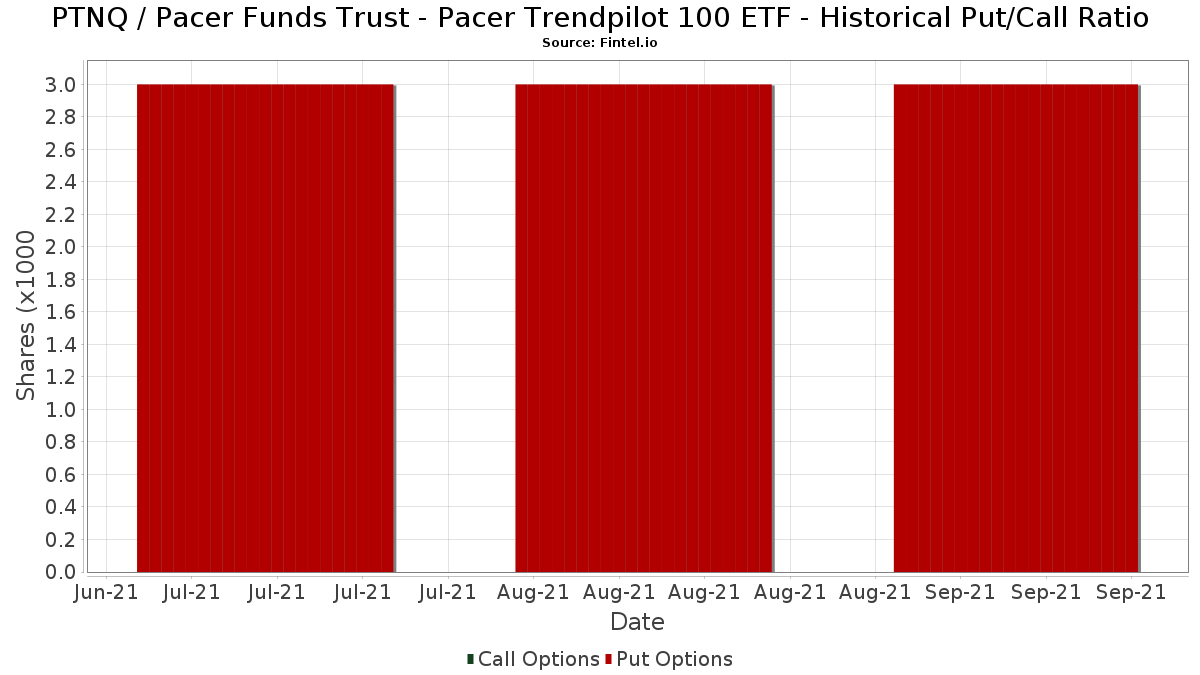
Förutom att rapportera vanliga eget kapital- och skuldemissioner måste institutioner med mer än 100MM tillgångar under förvaltning också avslöja sina innehav av sälj- och köpoptioner. Eftersom säljoptioner i allmänhet indikerar ett negativt sentiment och köpoptioner indikerar ett positivt sentiment, kan vi få en uppfattning om det övergripande institutionella sentimentet genom att plotta förhållandet mellan säljoptioner och köpoptioner. Diagrammet till höger visar det historiska förhållandet mellan sälj- och köpoptioner för detta instrument.
Genom att använda sälj/köp-kvoten som en indikator på aktieägarnas sentiment undviker man en av de största bristerna med att använda det totala institutionella ägandet, nämligen att en betydande del av de förvaltade tillgångarna investeras passivt för att följa index. Passivt förvaltade fonder köper vanligtvis inte optioner, så indikatorn för sälj/köp-kvoten ger en bättre bild av stämningen i aktivt förvaltade fonder.
13F- och NPORT-arkiveringar
Detaljer om 13F-arkiveringar är gratis. Detaljer om NP-arkiveringar kräver ett premiummedlemskap. Gröna rader indikerar nya positioner. Röda rader indikerar stängda positioner. Klicka på länk symbolen för att se hela transaktionshistoriken.
Uppgradera
för att låsa upp premiumdata och exportera till Excel ![]() .
.
| Fil Datum | Källa | Investerare | Typ | Genomsnittligt pris (beräknat) |
Aktier | Δ Aktier (%) |
Rapporterat värde (1000 USD) |
Δ Värde (%) |
Portföljallokering (%) |
|
|---|---|---|---|---|---|---|---|---|---|---|
| 2025-07-24 | 13F | Us Bancorp \de\ | 0 | −100,00 | 0 | |||||
| 2025-08-11 | 13F | Citigroup Inc | 492 | 0,00 | 35 | 2,94 | ||||
| 2025-08-06 | 13F | Mascagni Wealth Management, Inc. | 4 550 | 16,94 | 325 | 17,39 | ||||
| 2025-07-29 | 13F | Stratos Wealth Partners, LTD. | 19 743 | 0,84 | 1 409 | 1,37 | ||||
| 2025-08-14 | 13F | Bank Of America Corp /de/ | 1 098 718 | −6,05 | 78 415 | −5,58 | ||||
| 2025-08-14 | 13F | IHT Wealth Management, LLC | 2 956 | −11,12 | 211 | −11,02 | ||||
| 2025-07-14 | 13F | Golden State Equity Partners | 8 308 | 593 | ||||||
| 2025-04-21 | 13F | PSI Advisors, LLC | 0 | −100,00 | 0 | −100,00 | ||||
| 2025-04-29 | 13F | Brookstone Capital Management | 0 | −100,00 | 0 | |||||
| 2025-07-17 | 13F | SWS Partners | 3 484 | 0,00 | 249 | 0,40 | ||||
| 2025-07-25 | 13F | Midwest Capital Advisors, LLC | 858 | 0,00 | 61 | 1,67 | ||||
| 2025-07-28 | 13F | Harbour Investments, Inc. | 13 933 | 3,16 | 994 | 3,65 | ||||
| 2025-08-12 | 13F | Change Path, LLC | 18 391 | −17,61 | 1 313 | −17,22 | ||||
| 2025-08-15 | 13F | Kestra Advisory Services, LLC | 54 199 | 11,41 | 3 868 | 11,99 | ||||
| 2025-08-14 | 13F/A | Rockefeller Capital Management L.P. | 90 295 | 0,63 | 6 444 | 1,15 | ||||
| 2025-04-09 | 13F | Milestone Asset Management, Llc | 0 | −100,00 | 0 | |||||
| 2025-06-30 | NP | TRND - Pacer Trendpilot Fund of Funds ETF | 161 335 | 12,61 | 10 872 | 0,83 | ||||
| 2025-07-21 | 13F | New Century Financial Group, LLC | 3 452 | 246 | ||||||
| 2025-08-07 | 13F | PFG Advisors | 18 841 | −2,13 | 1 345 | −1,68 | ||||
| 2025-08-14 | 13F | Comerica Bank | 10 434 | 7,19 | 745 | 7,67 | ||||
| 2025-08-08 | 13F | Avantax Advisory Services, Inc. | 270 924 | 36,17 | 19 336 | 36,86 | ||||
| 2025-07-25 | 13F | Sequoia Financial Advisors, LLC | 5 135 | −0,58 | 366 | 0,00 | ||||
| 2025-08-11 | 13F | Advisor Resource Council | 17 368 | −42,20 | 1 240 | −41,91 | ||||
| 2025-05-16 | 13F/A | Kestra Investment Management, LLC | 0 | −100,00 | 0 | |||||
| 2025-08-14 | 13F | Hilltop Holdings Inc. | 6 828 | 1,46 | 487 | 2,10 | ||||
| 2025-07-16 | 13F | Register Financial Advisors LLC | 871 | 0,00 | 62 | 1,64 | ||||
| 2025-08-08 | 13F | Thoroughbred Financial Services, Llc | 5 046 | −89,89 | 0 | −100,00 | ||||
| 2025-08-12 | 13F | Jacobi Capital Management LLC | 3 040 | 0,00 | 217 | 0,47 | ||||
| 2025-08-14 | 13F | Royal Bank Of Canada | 187 798 | −4,00 | 13 403 | −3,51 | ||||
| 2025-08-12 | 13F | Marshall & Sterling Wealth Advisors Inc. | 0 | −100,00 | 0 | −100,00 | ||||
| 2025-08-11 | 13F | Oder Investment Management, LLC | 11 873 | 1,26 | 847 | 1,80 | ||||
| 2025-07-31 | 13F | Oppenheimer & Co Inc | 14 065 | −10,71 | 1 004 | −10,29 | ||||
| 2025-08-14 | 13F | UBS Group AG | 257 071 | −0,94 | 18 347 | −0,43 | ||||
| 2025-08-14 | 13F | Wells Fargo & Company/mn | 633 628 | −4,39 | 45 222 | −3,91 | ||||
| 2025-04-28 | 13F | Strategic Financial Concepts, LLC | 0 | −100,00 | 0 | −100,00 | ||||
| 2025-07-29 | 13F | Private Trust Co Na | 6 075 | 0,00 | 434 | 0,46 | ||||
| 2025-08-28 | 13F | Stark Wealth Management LLC | 4 350 | 310 | ||||||
| 2025-07-22 | 13F | Legacy Trust | 6 683 | 0,00 | 477 | 0,42 | ||||
| 2025-07-15 | 13F | Burns Matteson Capital Management, LLC | 0 | −100,00 | 0 | |||||
| 2025-08-01 | 13F | Schmidt P J Investment Management Inc | 0 | −100,00 | 0 | |||||
| 2025-07-15 | 13F | EWG Elevate Inc. | 9 933 | 4,15 | 709 | 4,58 | ||||
| 2025-08-14 | 13F | Camarda Financial Advisors, LLC | 7 701 | 14,58 | 550 | 15,09 | ||||
| 2025-07-22 | 13F | Merit Financial Group, LLC | 0 | −100,00 | 0 | |||||
| 2025-08-13 | 13F | Baird Financial Group, Inc. | 3 358 | −2,10 | 240 | −1,65 | ||||
| 2025-08-12 | 13F | Proequities, Inc. | 0 | 0 | ||||||
| 2025-05-15 | 13F/A | Orion Portfolio Solutions, LLC | 11 193 | 4,19 | 795 | −0,13 | ||||
| 2025-07-25 | 13F | Cwm, Llc | 23 568 | 0,00 | 2 | 0,00 | ||||
| 2025-08-12 | 13F | CIBC Private Wealth Group, LLC | 777 | −22,30 | 55 | −17,91 | ||||
| 2025-04-23 | 13F | International Assets Investment Management, Llc | 0 | −100,00 | 0 | |||||
| 2025-08-15 | 13F | First Heartland Consultants, Inc. | 0 | −100,00 | 0 | |||||
| 2025-08-13 | 13F | Trustmark National Bank Trust Department | 7 089 | 0,00 | 506 | 0,40 | ||||
| 2025-08-14 | 13F | Jane Street Group, Llc | 9 421 | 672 | ||||||
| 2025-08-14 | 13F | Arete Wealth Advisors, LLC | 11 833 | 11,26 | 1 | |||||
| 2025-09-04 | 13F/A | Advisor Group Holdings, Inc. | 175 193 | −6,99 | 12 504 | −6,51 | ||||
| 2025-08-04 | 13F | Arkadios Wealth Advisors | 12 834 | 0,63 | 916 | 1,10 | ||||
| 2025-08-14 | 13F | Napa Wealth Management | 26 017 | 1 857 | ||||||
| 2025-04-15 | 13F | Noble Wealth Management PBC | 1 400 | 21,74 | 99 | 16,47 | ||||
| 2025-07-10 | 13F | Financial Management Network Inc | 38 442 | −5,76 | 2 766 | 0,95 | ||||
| 2025-07-17 | 13F | Janney Montgomery Scott LLC | 27 656 | 6,91 | 2 | 0,00 | ||||
| 2025-08-12 | 13F | Insigneo Advisory Services, Llc | 4 519 | −8,09 | 323 | −7,74 | ||||
| 2025-08-12 | 13F | Calton & Associates, Inc. | 9 603 | −79,85 | 685 | −79,76 | ||||
| 2025-05-12 | 13F | Independent Advisor Alliance | 0 | −100,00 | 0 | |||||
| 2025-08-13 | 13F | Proactive Wealth Strategies LLC | 19 802 | −6,69 | 1 | 0,00 | ||||
| 2025-04-17 | 13F | FNY Investment Advisers, LLC | 0 | −100,00 | 0 | |||||
| 2025-07-14 | 13F | GAMMA Investing LLC | 80 | 0,00 | 6 | 0,00 | ||||
| 2025-08-14 | 13F | Susquehanna International Group, Llp | 20 198 | 1 442 | ||||||
| 2025-08-14 | 13F | Mml Investors Services, Llc | 44 892 | −21,13 | 3 | −25,00 | ||||
| 2025-08-11 | 13F | Anfield Capital Management, LLC | 130 | 0,00 | 9 | 0,00 | ||||
| 2025-08-14 | 13F | Mariner, LLC | 7 691 | 2,27 | 549 | 2,62 | ||||
| 2025-08-14 | 13F | Old Mission Capital Llc | 4 338 | 310 | ||||||
| 2025-07-18 | 13F | Truist Financial Corp | 50 074 | −10,81 | 3 574 | −10,36 | ||||
| 2025-08-05 | 13F | GPS Wealth Strategies Group, LLC | 8 580 | 0,00 | 612 | 0,49 | ||||
| 2025-08-14 | 13F | Wiley Bros.-aintree Capital, Llc | 10 717 | −11,20 | 765 | −10,75 | ||||
| 2025-08-14 | 13F | CoreCap Advisors, LLC | 746 | 4,04 | 53 | 6,00 | ||||
| 2025-07-17 | 13F | XML Financial, LLC | 10 724 | −15,57 | 765 | −15,09 | ||||
| 2025-07-21 | 13F | Ameriflex Group, Inc. | 2 588 | −33,64 | 183 | −34,06 | ||||
| 2025-08-05 | 13F | Sigma Planning Corp | 14 590 | −0,27 | 1 041 | 0,29 | ||||
| 2025-08-18 | 13F | Geneos Wealth Management Inc. | 183 469 | 42,46 | 13 094 | 43,18 | ||||
| 2025-07-23 | 13F | Clear Creek Financial Management, LLC | 12 169 | −60,23 | 869 | −60,04 | ||||
| 2025-07-08 | 13F | Nbc Securities, Inc. | 2 165 | 0,00 | 0 | |||||
| 2025-07-30 | 13F | Gimbal Financial | 38 461 | −27,04 | 2 745 | −26,69 | ||||
| 2025-08-14 | 13F | Vienna Asset Management LLC | 68 465 | 28,86 | 4 886 | 29,53 | ||||
| 2025-07-29 | 13F | Stratos Wealth Advisors, LLC | 0 | −100,00 | 0 | |||||
| 2025-08-13 | 13F | MONECO Advisors, LLC | 64 772 | −3,86 | 4 623 | −3,39 | ||||
| 2025-07-24 | 13F | IFP Advisors, Inc | 5 818 | 27,90 | 415 | 28,48 | ||||
| 2025-04-11 | 13F | IAM Advisory, LLC | 0 | −100,00 | 0 | −100,00 | ||||
| 2025-05-13 | 13F | Aptus Capital Advisors, LLC | 0 | −100,00 | 0 | |||||
| 2025-08-08 | 13F | Cetera Investment Advisers | 427 015 | −14,42 | 30 476 | −13,98 | ||||
| 2025-07-22 | 13F | Confluence Wealth Services, Inc. | 8 124 | −0,87 | 580 | 5,27 | ||||
| 2025-07-14 | 13F | MY Wealth Management Inc. | 131 087 | 9 356 | ||||||
| 2025-08-13 | 13F | JBR Co Financial Management Inc | 21 571 | −19,06 | 1 540 | −18,66 | ||||
| 2025-08-14 | 13F | Raymond James Financial Inc | 804 067 | −1,67 | 57 386 | −1,17 | ||||
| 2025-05-15 | 13F | StoneX Group Inc. | 0 | −100,00 | 0 | −100,00 | ||||
| 2025-08-06 | 13F | AE Wealth Management LLC | 953 | 0,00 | 68 | 1,49 | ||||
| 2025-08-13 | 13F | EverSource Wealth Advisors, LLC | 1 672 | 0,00 | 119 | 0,85 | ||||
| 2025-07-29 | 13F | ODonnell Financial Services, LLC | 219 653 | 2,27 | 15 677 | 2,79 | ||||
| 2025-08-12 | 13F | Global Retirement Partners, LLC | 47 | 3 | ||||||
| 2025-08-14 | 13F | EP Wealth Advisors, Inc. | 1 550 | 0,00 | 111 | 0,00 | ||||
| 2025-07-24 | 13F | Cyndeo Wealth Partners, LLC | 3 559 | 254 | ||||||
| 2025-07-31 | 13F | Cambridge Investment Research Advisors, Inc. | 422 624 | −15,71 | 30 | −14,29 | ||||
| 2025-08-14 | 13F | Stifel Financial Corp | 82 344 | 7,87 | 5 877 | 8,41 | ||||
| 2025-07-15 | 13F | Clarus Group, Inc. | 3 818 | 0,00 | 272 | 0,37 | ||||
| 2025-08-12 | 13F | Pacer Advisors, Inc. | 156 854 | 3,22 | 11 195 | 3,74 | ||||
| 2025-07-25 | 13F | Atria Wealth Solutions, Inc. | 107 640 | −16,99 | 7 682 | −16,57 | ||||
| 2025-07-28 | 13F | Axxcess Wealth Management, Llc | 7 555 | −28,83 | 539 | −28,42 | ||||
| 2025-07-21 | 13F | Financial Services Advisory Inc | 22 791 | 0,92 | 1 627 | 1,43 | ||||
| 2025-08-12 | 13F | SRS Capital Advisors, Inc. | 2 754 | 14,80 | 197 | 15,29 | ||||
| 2025-08-11 | 13F | Empirical Finance, LLC | 47 352 | 0,00 | 3 380 | 0,51 | ||||
| 2025-04-23 | 13F | PBMares Wealth Management LLC | 0 | −100,00 | 0 | |||||
| 2025-07-18 | 13F | Trust Co Of Vermont | 925 | 66 | ||||||
| 2025-08-01 | 13F | Brookwood Investment Group LLC | 0 | −100,00 | 0 | |||||
| 2025-08-27 | 13F/A | Brinker Capital Investments, LLC | 12 906 | 15,30 | 921 | 15,99 | ||||
| 2025-08-11 | 13F | HighTower Advisors, LLC | 76 265 | 5 443 | ||||||
| 2025-08-12 | 13F | Jpmorgan Chase & Co | 378 | −55,05 | 27 | −54,24 | ||||
| 2025-08-14 | 13F | Elevatus Welath Management | 0 | −100,00 | 0 | |||||
| 2025-07-23 | 13F | Tyche Wealth Partners LLC | 3 256 | −19,45 | 232 | −18,88 | ||||
| 2025-08-11 | 13F | Private Advisor Group, LLC | 55 026 | 2,94 | 3 927 | 3,48 | ||||
| 2025-08-06 | 13F | Prospera Financial Services Inc | 55 913 | −20,86 | 3 996 | −20,43 | ||||
| 2025-08-13 | 13F | Quadrant Capital Group Llc | 0 | −100,00 | 0 | |||||
| 2025-08-05 | 13F | Sensible Money, LLC | 3 000 | 0,00 | 214 | 0,47 | ||||
| 2025-08-07 | 13F | Kestra Private Wealth Services, Llc | 17 402 | −9,52 | 1 242 | −9,08 | ||||
| 2025-07-07 | 13F | Nova Wealth Management, Inc. | 5 133 | −85,51 | 366 | −85,45 | ||||
| 2025-07-22 | 13F | MBL Wealth, LLC | 47 385 | 3 382 | ||||||
| 2025-08-11 | 13F | Western Wealth Management, LLC | 37 729 | −14,33 | 2 693 | −13,91 | ||||
| 2025-08-12 | 13F | Financial Advocates Investment Management | 3 991 | −2,06 | 285 | −1,73 | ||||
| 2025-08-13 | 13F | Northwestern Mutual Wealth Management Co | 811 | 58 | ||||||
| 2025-08-05 | 13F | Bank Of Montreal /can/ | 600 | 43 | ||||||
| 2025-07-29 | 13F | Stephens Inc /ar/ | 79 800 | −5,70 | 5 695 | −5,23 | ||||
| 2025-08-04 | 13F | Assetmark, Inc | 2 522 | 0,00 | 180 | 0,00 | ||||
| 2025-08-06 | 13F | Commonwealth Equity Services, Llc | 179 441 | −9,17 | 13 | −14,29 | ||||
| 2025-05-14 | 13F | Brown Brothers Harriman & Co | 0 | −100,00 | 0 | |||||
| 2025-08-13 | 13F | Level Four Advisory Services, Llc | 122 128 | 0,87 | 8 716 | 1,38 | ||||
| 2025-07-10 | 13F | Wealth Enhancement Advisory Services, Llc | 13 845 | −71,29 | 996 | −70,91 | ||||
| 2025-08-11 | 13F | CFS Investment Advisory Services, LLC | 7 450 | 1 | ||||||
| 2025-07-07 | 13F | Capital Asset Advisory Services LLC | 7 455 | −29,77 | 527 | −30,70 | ||||
| 2025-08-13 | 13F | Continuum Advisory, LLC | 0 | −100,00 | 0 | |||||
| 2025-08-14 | 13F | Ameriprise Financial Inc | 22 338 | −6,98 | 1 594 | −6,57 | ||||
| 2025-08-15 | 13F | Equitable Holdings, Inc. | 53 917 | −32,58 | 3 848 | −32,23 | ||||
| 2025-08-12 | 13F | LPL Financial LLC | 1 516 605 | 6,61 | 108 240 | 7,15 | ||||
| 2025-08-12 | 13F | J.w. Cole Advisors, Inc. | 18 676 | 0,85 | 1 333 | 1,29 | ||||
| 2025-07-17 | 13F | Tempus Wealth Planning, LLC | 3 166 | −49,63 | 226 | −49,55 | ||||
| 2025-05-06 | 13F | Venturi Wealth Management, LLC | 0 | −100,00 | 0 | |||||
| 2025-08-19 | 13F | National Asset Management, Inc. | 0 | −100,00 | 0 | |||||
| 2025-07-25 | 13F | Lion Street Advisors, LLC | 5 080 | 0,00 | 363 | 0,56 | ||||
| 2025-07-17 | 13F | Beacon Capital Management, LLC | 595 | 0,00 | 42 | 0,00 | ||||
| 2025-08-12 | 13F | Steward Partners Investment Advisory, Llc | 144 276 | 7,02 | 10 297 | 7,56 | ||||
| 2025-08-07 | 13F | Parkside Financial Bank & Trust | 2 465 | 0,00 | 176 | 0,00 | ||||
| 2025-08-14 | 13F | Citadel Advisors Llc | 9 079 | 17,51 | 648 | 18,07 | ||||
| 2025-07-22 | 13F | Unique Wealth, Llc | 3 041 | 0,00 | 217 | 0,93 | ||||
| 2025-08-19 | 13F | Asset Dedication, LLC | 3 000 | 0,00 | 214 | 0,47 | ||||
| 2025-07-02 | 13F | HBW Advisory Services LLC | 3 317 | 237 | ||||||
| 2025-07-11 | 13F | SILVER OAK SECURITIES, Inc | 6 858 | −1,15 | 489 | −0,61 | ||||
| 2025-08-12 | 13F | PKS Advisory Services, LLC | 12 162 | 3,07 | 868 | 3,70 | ||||
| 2025-07-14 | 13F | Southland Equity Partners LLC | 12 368 | 0,24 | 883 | 0,68 | ||||
| 2025-08-14 | 13F | Aft, Forsyth & Sober, LLC | 57 225 | 0,88 | 4 084 | 1,39 | ||||
| 2025-08-01 | 13F | Gwn Securities Inc. | 0 | −100,00 | 0 | |||||
| 2025-07-21 | 13F | Ameritas Advisory Services, LLC | 40 088 | −13,49 | 2 861 | −13,22 | ||||
| 2025-08-01 | 13F | Envestnet Asset Management Inc | 79 069 | −16,24 | 5 643 | −15,81 | ||||
| 2025-08-14 | 13F | Family Office Research LLC | 7 870 | −3,19 | 562 | −2,77 | ||||
| 2025-08-15 | 13F | Morgan Stanley | 1 189 468 | −4,08 | 84 892 | −3,60 | ||||
| 2025-07-22 | 13F | DAVENPORT & Co LLC | 8 344 | 2,14 | 596 | 2,59 | ||||
| 2025-08-08 | 13F | Foundations Investment Advisors, LLC | 4 893 | −61,50 | 349 | −61,31 | ||||
| 2025-08-14 | 13F | GWM Advisors LLC | 149 890 | 76,82 | 10 698 | 77,72 | ||||
| 2025-07-31 | 13F | Stegent Equity Advisors, Inc. | 3 375 | −14,86 | 241 | −14,59 | ||||
| 2025-08-14 | 13F | Kovitz Investment Group Partners, LLC | 3 927 | 0,00 | 280 | 0,72 | ||||
| 2025-08-04 | 13F | Creative Financial Designs Inc /adv | 180 961 | 11,17 | 12 915 | 11,74 | ||||
| 2025-08-04 | 13F | Integrity Alliance, Llc. | 11 062 | −18,47 | 789 | −18,07 | ||||
| 2025-08-14 | 13F | Fmr Llc | 2 970 | −11,34 | 212 | −10,97 | ||||
| 2025-08-07 | 13F | Allworth Financial LP | 1 526 | 0,00 | 109 | 5,88 | ||||
| 2025-07-25 | 13F | Concurrent Investment Advisors, LLC | 28 551 | −4,89 | 2 038 | −4,41 | ||||
| 2025-07-30 | 13F | Strategic Blueprint, LLC | 6 182 | 27,97 | 441 | 28,57 | ||||
| 2025-07-30 | 13F/A | Old Point Trust & Financial Services N A | 452 | 0,00 | 32 | 0,00 |