Grundläggande statistik
| Institutionella ägare | 212 total, 212 long only, 0 short only, 0 long/short - change of 6,53% MRQ |
| Genomsnittlig portföljallokering | 0.2976 % - change of −2,97% MRQ |
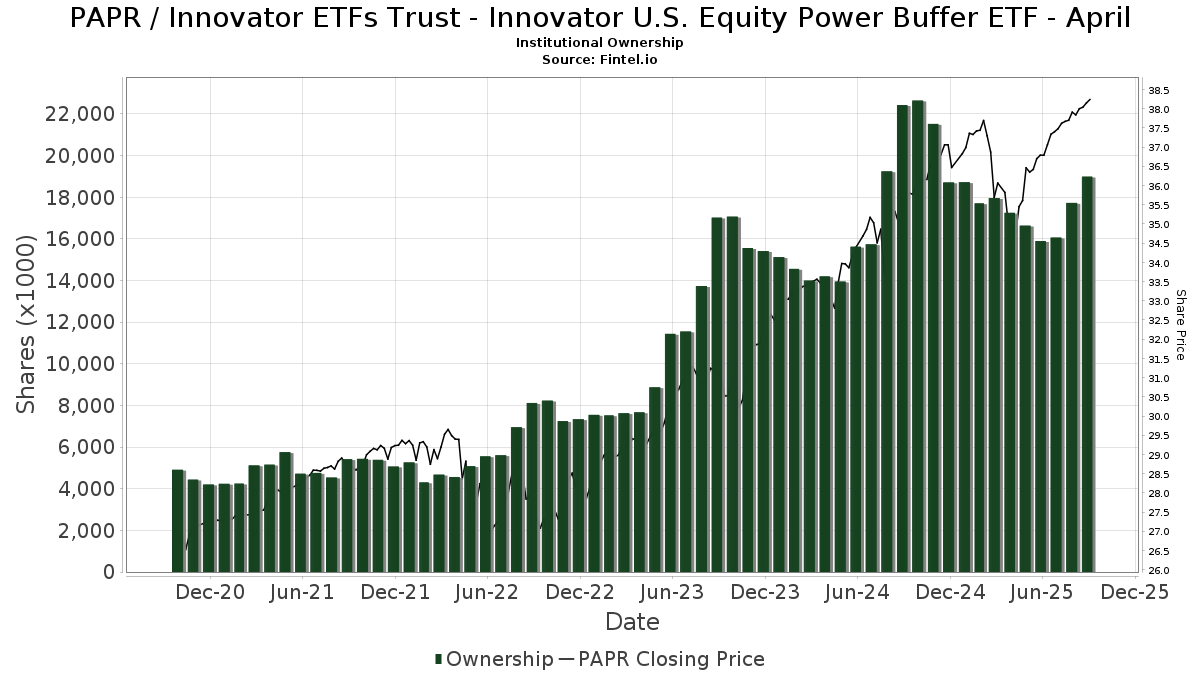
| Institutionella aktier (lång) | 18 989 023 (ex 13D/G) - change of 3,09MM shares 19,44% MRQ |
| Institutionellt värde (lång) | $ 583 542 USD ($1000) |
Institutionellt ägande och aktieägare
Innovator ETFs Trust - Innovator U.S. Equity Power Buffer ETF - April (US:PAPR) har 212 Institutionella ägare och aktieägare som har lämnat in 13D/G- eller 13F-formulär till Securities Exchange Commission (SEC). Dessa institut innehar totalt 18,989,023 aktier. Största aktieägare inkluderar Alliancebernstein L.p., Penserra Capital Management LLC, Innovator ETFs Trust - Innovator Laddered Fund of U.S. Equity Power Buffer ETFs, Brookstone Capital Management, Advisor Group Holdings, Inc., Commonwealth Equity Services, Llc, Miracle Mile Advisors, LLC, Raymond James Financial Inc, Envestnet Asset Management Inc, and Janney Montgomery Scott LLC .
Innovator ETFs Trust - Innovator U.S. Equity Power Buffer ETF - April (BATS:PAPR) Institutionell ägarstruktur visar institutioners och fonders nuvarande positioner i företaget, samt de senaste förändringarna i positionernas storlek. Större aktieägare kan vara enskilda investerare, fonder, hedgefonder eller institutioner. Bilaga 13D visar att investeraren äger (eller ägde) mer än 5% av företaget och avser (eller avsåg) att aktivt eftersträva en förändring av affärsstrategin. Schedule 13G indikerar en passiv investering på över 5%.
The share price as of September 10, 2025 is 38,15 / share. Previously, on September 11, 2024, the share price was 35,20 / share. This represents an increase of 8,38% over that period.
Fondsentimentets poäng
Fondsentimentet poängen(fka Ägarackumulation-poäng) visar vilka aktier som är mest köpta av fonder. Det är resultatet av en sofistikerad kvantitativ flerfaktormodell som identifierar företag med de högsta nivåerna av institutionell ackumulering. Poängsättningsmodellen använder en kombination av den totala ökningen av redovisade ägare, förändringarna i portföljallokeringarna för dessa ägare och andra mått. Siffran sträcker sig från 0 till 100, där högre siffror indikerar en högre nivå av ackumulering i förhållande till sina konkurrenter, och 50 är genomsnittet.
Uppdateringsfrekvens: Dagligen
Se Ownership Explorer, som innehåller en lista över de högst rankade företagen.
Institutionell sälj/köp-kvot
Förutom att rapportera vanliga eget kapital- och skuldemissioner måste institutioner med mer än 100MM tillgångar under förvaltning också avslöja sina innehav av sälj- och köpoptioner. Eftersom säljoptioner i allmänhet indikerar ett negativt sentiment och köpoptioner indikerar ett positivt sentiment, kan vi få en uppfattning om det övergripande institutionella sentimentet genom att plotta förhållandet mellan säljoptioner och köpoptioner. Diagrammet till höger visar det historiska förhållandet mellan sälj- och köpoptioner för detta instrument.
Genom att använda sälj/köp-kvoten som en indikator på aktieägarnas sentiment undviker man en av de största bristerna med att använda det totala institutionella ägandet, nämligen att en betydande del av de förvaltade tillgångarna investeras passivt för att följa index. Passivt förvaltade fonder köper vanligtvis inte optioner, så indikatorn för sälj/köp-kvoten ger en bättre bild av stämningen i aktivt förvaltade fonder.
13F- och NPORT-arkiveringar
Detaljer om 13F-arkiveringar är gratis. Detaljer om NP-arkiveringar kräver ett premiummedlemskap. Gröna rader indikerar nya positioner. Röda rader indikerar stängda positioner. Klicka på länk symbolen för att se hela transaktionshistoriken.
Uppgradera
för att låsa upp premiumdata och exportera till Excel ![]() .
.
| Fil Datum | Källa | Investerare | Typ | Genomsnittligt pris (beräknat) |
Aktier | Δ Aktier (%) |
Rapporterat värde (1000 USD) |
Δ Värde (%) |
Portföljallokering (%) |
|
|---|---|---|---|---|---|---|---|---|---|---|
| 2025-08-08 | 13F | Hartland & Co., LLC | 12 648 | −61,43 | 472 | −59,71 | ||||
| 2025-07-22 | 13F | Merit Financial Group, LLC | 14 833 | 553 | ||||||
| 2025-07-25 | 13F | NorthRock Partners, LLC | 1 799 | 0,00 | 67 | 4,69 | ||||
| 2025-07-22 | 13F | Siligmueller & Norvid Wealth Advisors LLC | 142 606 | −0,38 | 5 345 | 4,70 | ||||
| 2025-05-05 | 13F | PCA Investment Advisory Services Inc. | 0 | −100,00 | 0 | |||||
| 2025-08-12 | 13F | J.w. Cole Advisors, Inc. | 10 574 | 8,64 | 394 | 13,54 | ||||
| 2025-08-14 | 13F | Helium Advisors LLC | 25 568 | 5,86 | 953 | 10,69 | ||||
| 2025-05-15 | 13F | CAPROCK Group, Inc. | 0 | −100,00 | 0 | |||||
| 2025-07-25 | 13F | Apollon Wealth Management, LLC | 38 562 | −4,93 | 1 438 | −0,62 | ||||
| 2025-07-14 | 13F | CRA Financial Services, LLC | 79 289 | 14,70 | 2 957 | 19,92 | ||||
| 2025-08-27 | 13F/A | Brinker Capital Investments, LLC | 196 814 | 4,79 | 7 339 | 9,59 | ||||
| 2025-07-23 | 13F | Valmark Advisers, Inc. | 38 420 | 7,05 | 1 433 | 11,96 | ||||
| 2025-08-14 | 13F | Ambassador Advisors, LLC | 11 123 | 415 | ||||||
| 2025-08-13 | 13F | BCJ Capital Management, LLC | 49 105 | 4,13 | 1 831 | 8,92 | ||||
| 2025-08-14 | 13F | Sunbelt Securities, Inc. | 2 500 | 0,00 | 92 | 2,25 | ||||
| 2025-08-14 | 13F | CoreCap Advisors, LLC | 97 452 | 2,43 | 3 634 | 7,10 | ||||
| 2025-08-06 | 13F | AE Wealth Management LLC | 23 778 | −7,27 | 887 | −3,06 | ||||
| 2025-08-05 | 13F | Smith Shellnut Wilson Llc /adv | 15 400 | 0,00 | 574 | 4,55 | ||||
| 2025-08-08 | 13F | Collaborative Wealth Managment Inc. | 21 184 | 43,82 | 790 | 50,29 | ||||
| 2025-07-10 | 13F | Websterrogers Financial Advisors, Llc | 6 211 | 232 | ||||||
| 2025-07-25 | 13F | Cwm, Llc | 220 256 | 32,44 | 8 | 60,00 | ||||
| 2025-08-04 | 13F | Prairie Wealth Advisors, Inc. | 38 766 | −0,22 | 1 446 | 4,33 | ||||
| 2025-08-11 | 13F | Blue Bell Private Wealth Management, Llc | 27 789 | 8,36 | 1 036 | 13,35 | ||||
| 2025-07-25 | 13F | Atria Wealth Solutions, Inc. | 36 889 | 26,68 | 1 376 | 32,47 | ||||
| 2025-08-08 | 13F | Emerald Investment Partners, Llc | 3 117 | 0,00 | 116 | 4,50 | ||||
| 2025-08-12 | 13F | Change Path, LLC | 47 913 | 55,26 | 1 787 | 62,36 | ||||
| 2025-07-11 | 13F | SILVER OAK SECURITIES, Inc | 13 636 | 43,52 | 508 | 51,19 | ||||
| 2025-08-11 | 13F | Annis Gardner Whiting Capital Advisors, LLC | 18 750 | 699 | ||||||
| 2025-08-07 | 13F | PFG Advisors | 6 229 | −3,19 | 232 | 1,31 | ||||
| 2025-07-21 | 13F | Ameriflex Group, Inc. | 143 | 0,00 | 5 | 0,00 | ||||
| 2025-08-14 | 13F | Garden State Investment Advisory Services LLC | 11 800 | 0,00 | 440 | 4,76 | ||||
| 2025-08-14 | 13F/A | Skopos Labs, Inc. | 132 | 5 | ||||||
| 2025-04-22 | 13F | Synergy Financial Management, LLC | 0 | −100,00 | 0 | |||||
| 2025-07-17 | 13F | Bluesphere Advisors, LLC | 5 926 | 0,00 | 221 | 4,27 | ||||
| 2025-08-12 | 13F | Jacobi Capital Management LLC | 31 246 | 0,00 | 1 165 | 4,58 | ||||
| 2025-07-29 | 13F | Stephens Inc /ar/ | 67 695 | −2,44 | 2 524 | 2,02 | ||||
| 2025-08-11 | 13F | Nations Financial Group Inc, /ia/ /adv | 14 627 | 13,15 | 545 | 18,48 | ||||
| 2025-08-12 | 13F | Ascent Wealth Partners, LLC | 16 120 | 21,57 | 601 | 27,33 | ||||
| 2025-07-29 | 13F | AssuredPartners Investment Advisors, LLC | 19 842 | −68,56 | 740 | −67,16 | ||||
| 2025-08-08 | 13F | Avantax Advisory Services, Inc. | 27 148 | 23,23 | 1 012 | 28,92 | ||||
| 2025-08-14 | 13F | Jane Street Group, Llc | 9 200 | 343 | ||||||
| 2025-07-03 | 13F | City Center Advisors, LLC | 12 893 | −5,65 | 481 | −1,44 | ||||
| 2025-07-28 | 13F | Cypress Wealth Services, LLC | 7 112 | 265 | ||||||
| 2025-04-22 | 13F | Continuum Wealth Advisors, Llc | 0 | −100,00 | 0 | |||||
| 2025-07-24 | 13F | Weaver Capital Management LLC | 37 261 | 62,19 | 1 389 | 69,60 | ||||
| 2025-08-14 | 13F | Main Street Financial Solutions, LLC | 16 936 | 0,00 | 632 | 4,64 | ||||
| 2025-07-17 | 13F | Fort Washington Investment Advisors Inc /oh/ | 22 300 | 0,00 | 832 | 4,53 | ||||
| 2025-08-06 | 13F | Valtinson Bruner Financial Planning LLC | 17 237 | 2,07 | 643 | 6,64 | ||||
| 2025-07-25 | 13F | Concurrent Investment Advisors, LLC | 5 988 | 223 | ||||||
| 2025-08-12 | 13F | Proequities, Inc. | 0 | 0 | ||||||
| 2025-08-15 | 13F | Morgan Stanley | 5 838 | 185,76 | 218 | 201,39 | ||||
| 2025-08-13 | 13F | Per Stirling Capital Management, LLC. | 16 303 | 6,84 | 608 | 11,58 | ||||
| 2025-08-01 | 13F | Advisory Alpha, LLC | 69 571 | 1,25 | 2 594 | 5,88 | ||||
| 2025-07-09 | 13F | Keystone Wealth Services, LLC | 12 628 | 36,84 | 471 | 42,86 | ||||
| 2025-08-06 | 13F | Penserra Capital Management LLC | 1 551 834 | 17,13 | 58 | 21,28 | ||||
| 2025-08-08 | 13F | Pnc Financial Services Group, Inc. | 14 133 | 527 | ||||||
| 2025-08-12 | 13F | Waterloo Capital, L.P. | 20 097 | 24,27 | 749 | 30,03 | ||||
| 2025-07-14 | 13F | AdvisorNet Financial, Inc | 65 124 | 6,58 | 2 428 | 11,48 | ||||
| 2025-06-24 | NP | Innovator ETFs Trust - Innovator Laddered Fund of U.S. Equity Power Buffer ETFs | 1 355 944 | 13,71 | 48 068 | 8,13 | ||||
| 2025-07-11 | 13F | Cypress Financial Planning Llc | 5 785 | 216 | ||||||
| 2025-04-10 | 13F | Sugar Maple Asset Management, LLC | 0 | −100,00 | 0 | −100,00 | ||||
| 2025-07-17 | 13F | Sound Income Strategies, LLC | 215 | 0,00 | 8 | 14,29 | ||||
| 2025-08-11 | 13F | Rothschild Investment Llc | 92 | 3 | ||||||
| 2025-08-05 | 13F | Integrity Financial Corp /WA | 3 691 | 0,00 | 138 | 4,58 | ||||
| 2025-07-21 | 13F | DHJJ Financial Advisors, Ltd. | 35 728 | 1,32 | 1 332 | 5,97 | ||||
| 2025-08-05 | 13F | Milestone Asset Management, Llc | 10 527 | 0,00 | 393 | 4,53 | ||||
| 2025-08-11 | 13F | Outlook Wealth Advisors, LLC | 23 455 | −8,45 | 875 | −4,27 | ||||
| 2025-08-14 | 13F | Talon Private Wealth, LLC | 51 635 | 1 925 | ||||||
| 2025-07-22 | 13F | MBL Wealth, LLC | 7 830 | −6,17 | 292 | −2,02 | ||||
| 2025-08-14 | 13F | First Commonwealth Financial Corp /pa/ | 19 968 | 745 | ||||||
| 2025-08-12 | 13F | Steward Partners Investment Advisory, Llc | 2 522 | 0,00 | 94 | 5,62 | ||||
| 2025-07-25 | 13F | Yarger Wealth Strategies, Llc | 19 032 | 108,02 | 710 | 117,48 | ||||
| 2025-07-31 | 13F | Orion Capital Management LLC | 14 745 | 2,08 | 550 | 6,60 | ||||
| 2025-08-14 | 13F | Susquehanna International Group, Llp | 14 070 | 525 | ||||||
| 2025-08-07 | 13F | Fidelis Capital Partners, LLC | 14 030 | 0,00 | 529 | 6,67 | ||||
| 2025-08-29 | 13F | Centaurus Financial, Inc. | 41 688 | 6,20 | 2 | 0,00 | ||||
| 2025-07-17 | 13F | City Holding Co | 20 457 | −34,81 | 763 | −31,84 | ||||
| 2025-07-10 | 13F | Focus Financial Network, Inc. | 14 742 | −8,30 | 550 | −4,19 | ||||
| 2025-08-06 | 13F | Commonwealth Equity Services, Llc | 724 892 | 10,17 | 27 | 17,39 | ||||
| 2025-07-29 | 13F | Madison Wealth Partners, Inc | 7 541 | 4,14 | 281 | 8,91 | ||||
| 2025-08-08 | 13F | Compass Financial Services Inc | 187 | 0,00 | 7 | 0,00 | ||||
| 2025-08-19 | 13F | Cape Investment Advisory, Inc. | 6 890 | 16,98 | 257 | 21,90 | ||||
| 2025-07-18 | 13F | Truist Financial Corp | 145 259 | 7,67 | 5 417 | 12,60 | ||||
| 2025-08-04 | 13F | JDM Financial Group LLC | 3 808 | 142 | ||||||
| 2025-05-15 | 13F | Ausdal Financial Partners, Inc. | 0 | −100,00 | 0 | −100,00 | ||||
| 2025-07-28 | 13F | RFG Advisory, LLC | 32 138 | −13,26 | 1 198 | −9,31 | ||||
| 2025-05-01 | 13F | Quest 10 Wealth Builders, Inc. | 22 840 | −0,62 | 827 | −2,02 | ||||
| 2025-08-12 | 13F | Bedel Financial Consulting, Inc. | 237 717 | −0,17 | 8 864 | 4,63 | ||||
| 2025-07-15 | 13F | Retirement Income Solutions, Inc | 13 545 | 0,00 | 505 | 4,55 | ||||
| 2025-07-22 | 13F | Macroview Investment Management Llc | 33 715 | 1 257 | ||||||
| 2025-08-07 | 13F | Encompass More Asset Management | 52 025 | 19,75 | 1 940 | 25,24 | ||||
| 2025-07-10 | 13F | Wealth Enhancement Advisory Services, Llc | 75 722 | 15,89 | 2 832 | 21,60 | ||||
| 2025-08-14 | 13F | Old Mission Capital Llc | 30 208 | 1 126 | ||||||
| 2025-08-07 | 13F | Resources Investment Advisors, LLC. | 65 710 | 132,70 | 2 450 | 143,54 | ||||
| 2025-08-08 | 13F | Capital Investment Advisory Services, LLC | 2 192 | 0,00 | 82 | 3,85 | ||||
| 2025-07-17 | 13F | Clay Northam Wealth Management, LLC | 11 915 | 0,00 | 444 | 4,72 | ||||
| 2025-07-31 | 13F | Cambridge Investment Research Advisors, Inc. | 171 284 | 7,38 | 6 | 20,00 | ||||
| 2025-07-28 | 13F | Cornerstone Wealth Group, LLC | 22 560 | −12,64 | 841 | −8,59 | ||||
| 2025-07-31 | 13F | Pinnacle Wealth Management Group, Inc. | 117 837 | −0,60 | 4 394 | 3,95 | ||||
| 2025-08-14 | 13F | GWM Advisors LLC | 48 157 | 5,19 | 1 796 | 9,99 | ||||
| 2025-05-02 | 13F | Sigma Planning Corp | 0 | −100,00 | 0 | |||||
| 2025-05-07 | 13F | Keystone Financial Group, Inc. | 0 | −100,00 | 0 | |||||
| 2025-08-14 | 13F | Citadel Advisors Llc | 0 | −100,00 | 0 | |||||
| 2025-07-28 | 13F | Sagespring Wealth Partners, Llc | 12 438 | 6,23 | 464 | 11,03 | ||||
| 2025-08-04 | 13F | Pensionmark Financial Group, Llc | 28 954 | 22,51 | 1 080 | 28,15 | ||||
| 2025-08-08 | 13F | Foundations Investment Advisors, LLC | 156 512 | 8,02 | 5 836 | 12,97 | ||||
| 2025-07-22 | 13F | Diligent Investors, LLC | 73 424 | −3,63 | 2 738 | 0,74 | ||||
| 2025-08-04 | 13F | Creative Financial Designs Inc /adv | 9 880 | −0,21 | 368 | 4,25 | ||||
| 2025-08-14 | 13F | Raymond James Financial Inc | 403 459 | 20,20 | 15 045 | 25,69 | ||||
| 2025-07-09 | 13F | Lineweaver Wealth Advisors, LLC | 23 920 | 0,00 | 892 | 4,58 | ||||
| 2025-08-12 | 13F | Leigh Baldwin & Co., Llc | 11 300 | 1,80 | 421 | 6,58 | ||||
| 2025-05-15 | 13F | Core Wealth Advisors, Inc. | 0 | −100,00 | 0 | |||||
| 2025-05-15 | 13F | Hrt Financial Lp | 0 | −100,00 | 0 | |||||
| 2025-07-15 | 13F | McAdam, LLC | 5 461 | 204 | ||||||
| 2025-07-28 | 13F | Elmwood Wealth Management, Inc. | 126 032 | 29,22 | 4 700 | 35,15 | ||||
| 2025-08-11 | 13F | WPWealth LLP | 91 071 | 22,61 | 3 396 | 28,25 | ||||
| 2025-07-30 | 13F | Evermay Wealth Management Llc | 38 015 | 0,32 | 1 418 | 4,89 | ||||
| 2025-08-08 | 13F | Wealth Alliance | 23 823 | 23,38 | 888 | 29,07 | ||||
| 2025-07-07 | 13F | Schulz Wealth, LTD. | 15 515 | 0,00 | 579 | 4,52 | ||||
| 2025-07-16 | 13F | John W. Brooker & Co., CPAs | 0 | −100,00 | 0 | |||||
| 2025-08-11 | 13F | Avantax Planning Partners, Inc. | 7 458 | 0,00 | 278 | 4,91 | ||||
| 2025-07-21 | 13F | Patriot Financial Group Insurance Agency, LLC | 38 127 | 5,36 | 1 422 | 10,16 | ||||
| 2025-07-21 | 13F | Seros Financial, LLC | 8 528 | 0,00 | 318 | 4,61 | ||||
| 2025-07-23 | 13F | Motiv8 Investments LLC | 193 988 | −0,40 | 7 234 | 4,15 | ||||
| 2025-07-28 | 13F | Mutual Advisors, LLC | 13 892 | 7,66 | 524 | 14,95 | ||||
| 2025-07-22 | 13F | Belpointe Asset Management LLC | 111 337 | 6,00 | 4 152 | 10,84 | ||||
| 2025-08-12 | 13F | SRS Capital Advisors, Inc. | 7 459 | −1,39 | 278 | 3,35 | ||||
| 2025-07-25 | 13F | We Are One Seven, LLC | 17 261 | 644 | ||||||
| 2025-08-01 | 13F | FSA Advisors, Inc. | 27 267 | 9,55 | 1 017 | 4,74 | ||||
| 2025-08-12 | 13F | LPL Financial LLC | 248 274 | 7,08 | 9 258 | 11,99 | ||||
| 2025-08-04 | 13F | Arkadios Wealth Advisors | 32 696 | 102,90 | 1 219 | 112,37 | ||||
| 2025-08-14 | 13F | Colony Group, LLC | 36 619 | 9,34 | 1 366 | 14,32 | ||||
| 2025-05-15 | 13F | Two Sigma Securities, Llc | 0 | −100,00 | 0 | |||||
| 2025-07-15 | 13F | Armis Advisers, LLC | 34 535 | 2,76 | 1 288 | 7,43 | ||||
| 2025-08-01 | 13F | Integral Investment Advisors, Inc. | 10 835 | −6,88 | 404 | −2,42 | ||||
| 2025-08-01 | 13F | Envestnet Asset Management Inc | 352 119 | 42,48 | 13 131 | 49,00 | ||||
| 2025-08-07 | 13F | Allworth Financial LP | 1 569 | 0,00 | 59 | 5,45 | ||||
| 2025-07-30 | 13F | Brookstone Capital Management | 887 824 | 814,00 | 33 107 | 855,99 | ||||
| 2025-08-01 | 13F | Corrado Advisors, Llc | 66 834 | 17,35 | 2 492 | 22,70 | ||||
| 2025-08-19 | 13F | National Asset Management, Inc. | 0 | −100,00 | 0 | |||||
| 2025-08-13 | 13F | JT Stratford LLC | 15 004 | 1,90 | 559 | 6,48 | ||||
| 2025-07-28 | 13F | Harbour Investments, Inc. | 184 668 | 783,20 | 6 886 | 824,30 | ||||
| 2025-07-10 | 13F | Atticus Wealth Management, Llc | 19 888 | 0,00 | 742 | 4,51 | ||||
| 2025-08-12 | 13F | Sfmg, Llc | 49 693 | −1,74 | 1 853 | 2,77 | ||||
| 2025-08-04 | 13F | Assetmark, Inc | 0 | −100,00 | 0 | |||||
| 2025-08-08 | 13F | Cetera Investment Advisers | 275 595 | 18,46 | 10 277 | 23,87 | ||||
| 2025-07-16 | 13F | Legend Financial Advisors, Inc. | 283 | 11 | ||||||
| 2025-08-12 | 13F | MAI Capital Management | 162 402 | 1 817,15 | 6 056 | 1 904,97 | ||||
| 2025-08-14 | 13F | Aqr Capital Management Llc | 0 | −100,00 | 0 | |||||
| 2025-08-11 | 13F | Bellwether Advisors, LLC | 210 492 | −0,73 | 7 849 | 3,81 | ||||
| 2025-07-17 | 13F | Wagner Wealth Management, Llc | 2 000 | 0,00 | 75 | 4,23 | ||||
| 2025-07-11 | 13F | AA Financial Advisors, LLC | 216 124 | −0,33 | 8 059 | 4,23 | ||||
| 2025-08-01 | 13F | Ashton Thomas Private Wealth, LLC | 15 324 | 11,59 | 571 | 16,77 | ||||
| 2025-07-28 | 13F | Compass Advisory Group LLC | 12 840 | 0,00 | 479 | 4,60 | ||||
| 2025-08-14 | 13F | Mml Investors Services, Llc | 173 077 | 30,68 | 6 | 50,00 | ||||
| 2025-05-15 | 13F/A | Orion Portfolio Solutions, LLC | 187 821 | 1,78 | 6 698 | −1,12 | ||||
| 2025-08-13 | 13F | Capital Analysts, Inc. | 1 156 | 0,00 | 0 | |||||
| 2025-08-05 | 13F | Bank Of Montreal /can/ | 290 | 0,00 | 11 | 0,00 | ||||
| 2025-07-03 | 13F | Fiduciary Financial Group, Llc | 16 548 | 60,21 | 618 | 73,80 | ||||
| 2025-08-14 | 13F | Visionary Wealth Advisors | 9 097 | −0,67 | 339 | 3,99 | ||||
| 2025-08-14 | 13F | Snowden Capital Advisors LLC | 14 866 | 554 | ||||||
| 2025-05-14 | 13F | Frisch Financial Group, Inc. | 0 | −100,00 | 0 | |||||
| 2025-04-10 | 13F | Maltin Wealth Management, Inc. | 0 | −100,00 | 0 | |||||
| 2025-07-23 | 13F | Castle Rock Wealth Management, LLC | 34 579 | −50,11 | 1 298 | −47,51 | ||||
| 2025-08-15 | 13F | Kestra Advisory Services, LLC | 194 258 | 0,92 | 7 244 | 5,54 | ||||
| 2025-08-13 | 13F | Cresset Asset Management, LLC | 75 124 | 18,30 | 2 801 | 23,72 | ||||
| 2025-08-14 | 13F | Kovitz Investment Group Partners, LLC | 278 794 | −6,04 | 10 396 | −1,74 | ||||
| 2025-08-06 | 13F | Founders Financial Securities Llc | 46 877 | 30,93 | 1 748 | 38,07 | ||||
| 2025-04-22 | 13F | Castleview Partners, Llc | 0 | −100,00 | 0 | |||||
| 2025-08-13 | 13F | Continuum Advisory, LLC | 25 208 | 17,18 | 940 | 22,56 | ||||
| 2025-08-07 | 13F | Sound View Wealth Advisors Group, LLC | 11 943 | 0,00 | 445 | 4,71 | ||||
| 2025-07-24 | 13F | Stonebridge Financial Group, LLC | 0 | −100,00 | 0 | |||||
| 2025-08-14 | 13F | Financial Network Wealth Advisors LLC | 7 480 | 52,25 | 279 | 58,86 | ||||
| 2025-08-12 | 13F | Tradition Wealth Management, LLC | 217 110 | −1,52 | 8 096 | 2,99 | ||||
| 2025-08-29 | 13F | Evolution Wealth Management Inc. | 2 235 | 83 | ||||||
| 2025-07-14 | 13F | Kfg Wealth Management, Llc | 175 392 | 14,59 | 6 540 | 19,82 | ||||
| 2025-07-25 | 13F | Envestnet Portfolio Solutions, Inc. | 8 084 | 0,00 | 301 | 4,51 | ||||
| 2025-07-11 | 13F | Seacrest Wealth Management, Llc | 20 186 | 753 | ||||||
| 2025-08-07 | 13F | Tfo-tdc, Llc | 0 | −100,00 | 0 | |||||
| 2025-08-14 | 13F | Alliancebernstein L.p. | 2 319 292 | 0,62 | 86 486 | 5,22 | ||||
| 2025-07-30 | 13F | Red Crane Wealth Management, Llc | 59 733 | 305,71 | 2 227 | 324,19 | ||||
| 2025-08-14 | 13F | UBS Group AG | 847 | −91,26 | 32 | −91,01 | ||||
| 2025-07-14 | 13F | Chris Bulman Inc | 44 472 | 242,09 | 1 658 | 258,10 | ||||
| 2025-07-22 | 13F | Miracle Mile Advisors, LLC | 548 755 | −2,16 | 20 463 | 2,32 | ||||
| 2025-08-13 | 13F | Cerity Partners LLC | 11 968 | −7,71 | 446 | −3,46 | ||||
| 2025-08-08 | 13F | Kingsview Wealth Management, LLC | 12 047 | 4,42 | 449 | 9,25 | ||||
| 2025-07-24 | 13F | IFP Advisors, Inc | 33 512 | 55,21 | 1 250 | 62,42 | ||||
| 2025-08-04 | 13F | Spire Wealth Management | 32 307 | 1,13 | 1 205 | 5,71 | ||||
| 2025-07-02 | 13F | HBW Advisory Services LLC | 34 671 | −57,77 | 1 293 | −55,86 | ||||
| 2025-08-14 | 13F | Atomi Financial Group, Inc. | 27 074 | −0,97 | 1 010 | 3,59 | ||||
| 2025-07-17 | 13F | Janney Montgomery Scott LLC | 285 379 | 9,72 | 11 | 11,11 | ||||
| 2025-08-15 | 13F | Nikulski Financial, Inc. | 109 674 | 0,11 | 4 090 | 4,69 | ||||
| 2025-07-14 | 13F | Southland Equity Partners LLC | 213 823 | 0,29 | 7 973 | 4,87 | ||||
| 2025-07-15 | 13F | BCS Wealth Management | 58 560 | 32,89 | 2 | 100,00 | ||||
| 2025-08-05 | 13F | WorthPointe, LLC | 53 297 | 19,74 | 1 987 | 25,20 | ||||
| 2025-07-24 | 13F | Bernard Wealth Management Corp. | 6 074 | 397,87 | 226 | 425,58 | ||||
| 2025-07-21 | 13F | Triad Wealth Partners, LLC | 65 731 | 137,54 | 2 451 | 148,58 | ||||
| 2025-07-10 | 13F | ARS Wealth Advisors Group, LLC | 7 423 | −25,29 | 277 | −22,03 | ||||
| 2025-07-24 | 13F | Vantage Point Financial LLC | 38 630 | 6,31 | 1 441 | 11,20 | ||||
| 2025-05-16 | 13F | Arete Wealth Advisors, LLC | 0 | −100,00 | 0 | |||||
| 2025-04-01 | 13F/A | Family Wealth Group, LLC | 0 | −100,00 | 0 | −100,00 | ||||
| 2025-07-29 | 13F | Straight Path Wealth Management | 28 980 | 12,89 | 1 081 | 18,03 | ||||
| 2025-08-14 | 13F | Mariner, LLC | 15 356 | 10,07 | 573 | 15,09 | ||||
| 2025-08-04 | 13F | Integrity Alliance, Llc. | 0 | −100,00 | 0 | |||||
| 2025-08-11 | 13F | HighTower Advisors, LLC | 263 404 | 8,56 | 9 822 | 13,52 | ||||
| 2025-08-12 | 13F | Wood Tarver Financial Group, LLC | 12 029 | 4,97 | 0 | −100,00 | ||||
| 2025-08-13 | 13F | Townsquare Capital Llc | 0 | −100,00 | 0 | |||||
| 2025-07-25 | 13F | Sequoia Financial Advisors, LLC | 11 976 | 0,00 | 447 | 4,45 | ||||
| 2025-07-30 | 13F | Caliber Wealth Management, LLC / KS | 0 | −100,00 | 0 | |||||
| 2025-07-30 | 13F | Strategic Blueprint, LLC | 13 366 | −67,12 | 498 | −65,63 | ||||
| 2025-05-12 | 13F | Fmr Llc | 0 | −100,00 | 0 | |||||
| 2025-07-14 | 13F | U.S. Capital Wealth Advisors, LLC | 9 328 | −6,98 | 348 | −2,80 | ||||
| 2025-08-11 | 13F | Principal Securities, Inc. | 63 235 | 1,86 | 2 358 | 3,51 | ||||
| 2025-07-21 | 13F | Ameritas Advisory Services, LLC | 4 850 | −17,60 | 181 | −14,69 | ||||
| 2025-07-11 | 13F | Farther Finance Advisors, LLC | 68 710 | 0,63 | 2 562 | 5,09 | ||||
| 2025-08-05 | 13F | GHP Investment Advisors, Inc. | 2 750 | 0,00 | 103 | 4,08 | ||||
| 2025-07-29 | 13F | BKD Wealth Advisors, LLC | 203 284 | −9,04 | 7 580 | −4,88 | ||||
| 2025-08-12 | 13F | Global Retirement Partners, LLC | 430 | 0,00 | 16 | 6,67 | ||||
| 2025-07-30 | 13F | IMG Wealth Management, Inc. | 9 824 | 239,11 | 366 | 255,34 | ||||
| 2025-07-31 | 13F | Gill Capital Partners, Llc | 159 273 | 1,90 | 5 939 | 6,57 | ||||
| 2025-08-05 | 13F | BCGM Wealth Management, LLC | 8 191 | −16,31 | 305 | −12,61 | ||||
| 2025-08-12 | 13F | Weaver Consulting Group | 23 574 | 2,90 | 879 | 7,72 | ||||
| 2025-08-13 | 13F | M Holdings Securities, Inc. | 20 171 | 0,00 | 1 | |||||
| 2025-08-14 | 13F/A | Barclays Plc | 1 396 | 0 | ||||||
| 2025-07-30 | 13F | Phoenix Holdings Ltd. | 27 765 | 1 031 | ||||||
| 2025-09-04 | 13F/A | Advisor Group Holdings, Inc. | 829 207 | 51,54 | 30 921 | 58,47 | ||||
| 2025-07-28 | 13F | Axxcess Wealth Management, Llc | 6 217 | 0,00 | 232 | 4,52 | ||||
| 2025-08-06 | 13F | Bullseye Investment Management, LLC | 37 031 | 0,00 | 1 321 | 0,00 | ||||
| 2025-08-14 | 13F | Royal Bank Of Canada | 0 | −100,00 | 0 | |||||
| 2025-08-12 | 13F | Jpmorgan Chase & Co | 720 | −67,76 | 27 | −67,09 | ||||
| 2025-08-15 | 13F | Chapman Financial Group, Llc | 15 224 | −57,52 | 568 | −56,88 | ||||
| 2025-07-15 | 13F | Retirement Guys Formula Llc | 8 967 | −0,04 | 334 | 4,70 | ||||
| 2025-07-24 | 13F | Blair William & Co/il | 264 240 | 151,23 | 9 854 | 162,75 | ||||
| 2025-08-06 | 13F | Capasso Planning Partners LLC | 0 | −100,00 | 0 | |||||
| 2025-08-19 | 13F | Advisory Services Network, LLC | 31 484 | 96,55 | 1 185 | 107,36 | ||||
| 2025-08-11 | 13F | Anfield Capital Management, LLC | 340 | 13 | ||||||
| 2025-08-14 | 13F | Benjamin Edwards Inc | 40 038 | 444,36 | 1 493 | 469,85 | ||||
| 2025-05-14 | 13F | Heritage Wealth Partners, LLC | 74 111 | 2 643 | ||||||
| 2025-07-22 | 13F | Beacon Financial Advisory LLC | 7 840 | −15,44 | 292 | −11,52 | ||||
| 2025-08-12 | 13F | Winnow Wealth Llc | 0 | 0 | ||||||
| 2025-08-12 | 13F | O'shaughnessy Asset Management, Llc | 41 | 0,00 | 2 | 0,00 | ||||
| 2025-05-16 | 13F | Coppell Advisory Solutions LLC | 0 | −100,00 | 0 | |||||
| 2025-08-13 | 13F | Beacon Pointe Advisors, LLC | 176 841 | 13,83 | 6 594 | 19,05 | ||||
| 2025-08-15 | 13F | Captrust Financial Advisors | 42 054 | 12,69 | 1 568 | 17,89 |