Grundläggande statistik
| Institutionella ägare | 212 total, 211 long only, 0 short only, 1 long/short - change of 10,99% MRQ |
| Genomsnittlig portföljallokering | 0.5844 % - change of −7,18% MRQ |
| Institutionella aktier (lång) | 28 054 172 (ex 13D/G) - change of 2,49MM shares 9,74% MRQ |
| Institutionellt värde (lång) | $ 798 659 USD ($1000) |
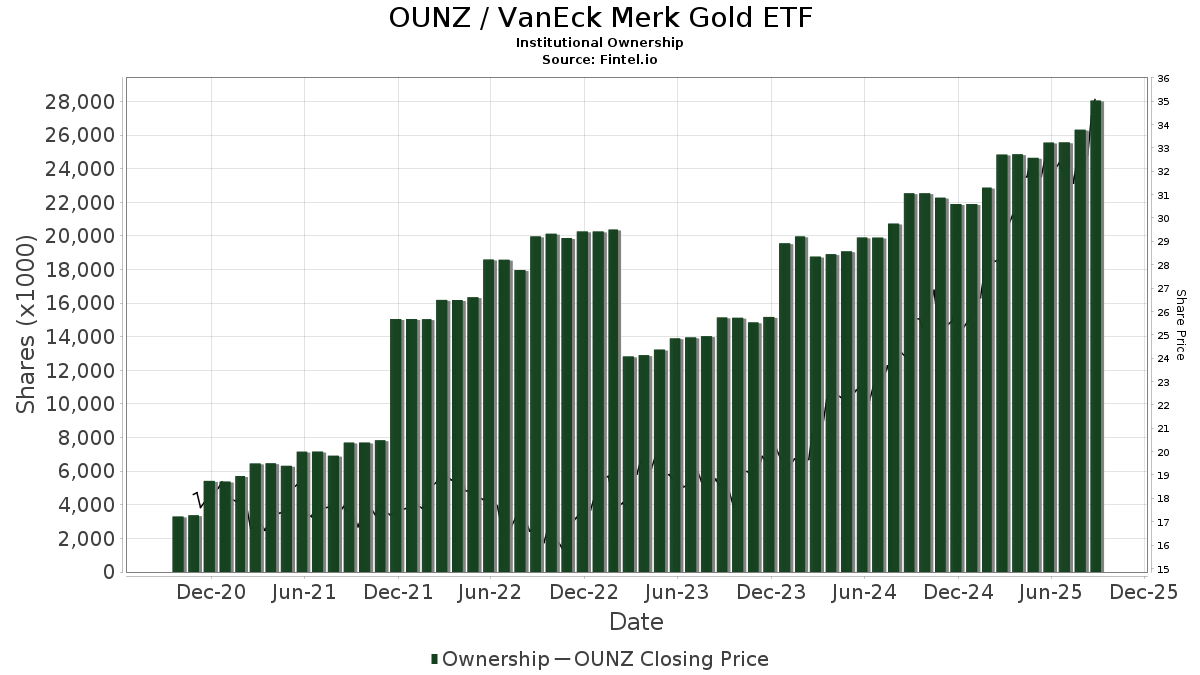
Institutionellt ägande och aktieägare
VanEck Merk Gold ETF (US:OUNZ) har 212 Institutionella ägare och aktieägare som har lämnat in 13D/G- eller 13F-formulär till Securities Exchange Commission (SEC). Dessa institut innehar totalt 28,054,172 aktier. Största aktieägare inkluderar Morton Capital Management LLC/CA, LPL Financial LLC, Cetera Investment Advisers, Van Eck Associates Corp, Pitcairn Co, Envestnet Asset Management Inc, RAAX - VanEck Vectors Real Asset Allocation ETF, Raymond James Financial Inc, Ameriprise Financial Inc, and Wealth Enhancement Advisory Services, Llc .
VanEck Merk Gold ETF (ARCA:OUNZ) Institutionell ägarstruktur visar institutioners och fonders nuvarande positioner i företaget, samt de senaste förändringarna i positionernas storlek. Större aktieägare kan vara enskilda investerare, fonder, hedgefonder eller institutioner. Bilaga 13D visar att investeraren äger (eller ägde) mer än 5% av företaget och avser (eller avsåg) att aktivt eftersträva en förändring av affärsstrategin. Schedule 13G indikerar en passiv investering på över 5%.
The share price as of September 9, 2025 is 34,97 / share. Previously, on September 10, 2024, the share price was 24,31 / share. This represents an increase of 43,85% over that period.
Fondsentimentets poäng
Fondsentimentet poängen(fka Ägarackumulation-poäng) visar vilka aktier som är mest köpta av fonder. Det är resultatet av en sofistikerad kvantitativ flerfaktormodell som identifierar företag med de högsta nivåerna av institutionell ackumulering. Poängsättningsmodellen använder en kombination av den totala ökningen av redovisade ägare, förändringarna i portföljallokeringarna för dessa ägare och andra mått. Siffran sträcker sig från 0 till 100, där högre siffror indikerar en högre nivå av ackumulering i förhållande till sina konkurrenter, och 50 är genomsnittet.
Uppdateringsfrekvens: Dagligen
Se Ownership Explorer, som innehåller en lista över de högst rankade företagen.
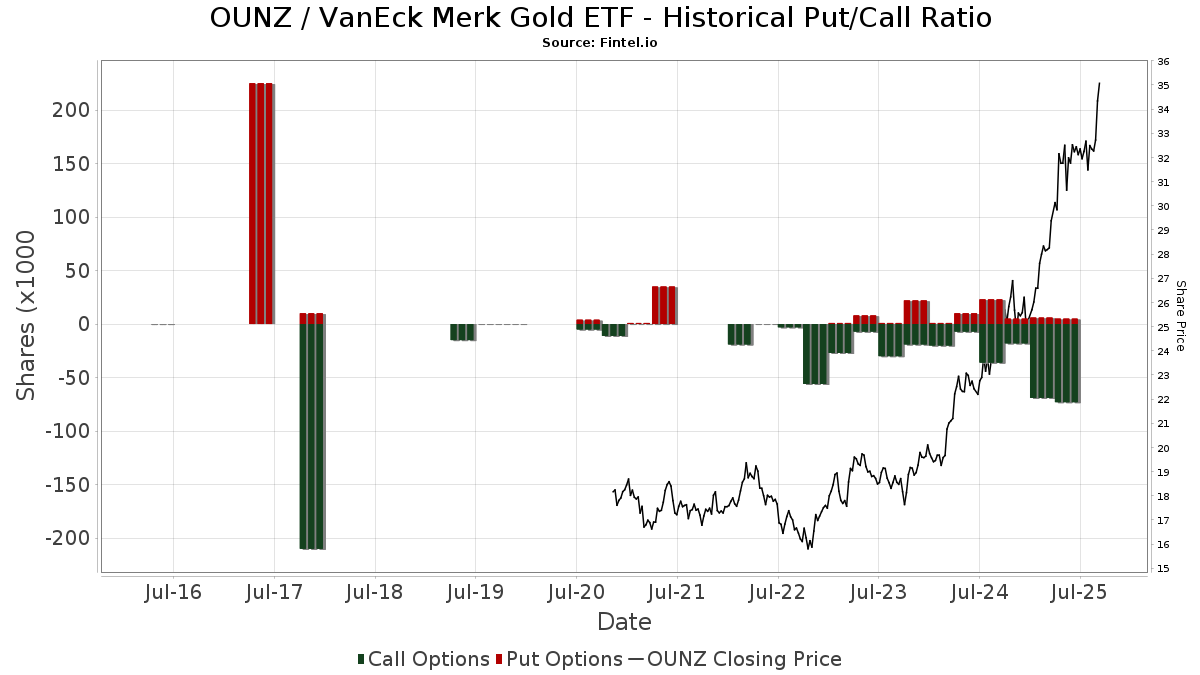
Institutionell sälj/köp-kvot
Förutom att rapportera vanliga eget kapital- och skuldemissioner måste institutioner med mer än 100MM tillgångar under förvaltning också avslöja sina innehav av sälj- och köpoptioner. Eftersom säljoptioner i allmänhet indikerar ett negativt sentiment och köpoptioner indikerar ett positivt sentiment, kan vi få en uppfattning om det övergripande institutionella sentimentet genom att plotta förhållandet mellan säljoptioner och köpoptioner. Diagrammet till höger visar det historiska förhållandet mellan sälj- och köpoptioner för detta instrument.
Genom att använda sälj/köp-kvoten som en indikator på aktieägarnas sentiment undviker man en av de största bristerna med att använda det totala institutionella ägandet, nämligen att en betydande del av de förvaltade tillgångarna investeras passivt för att följa index. Passivt förvaltade fonder köper vanligtvis inte optioner, så indikatorn för sälj/köp-kvoten ger en bättre bild av stämningen i aktivt förvaltade fonder.
13F- och NPORT-arkiveringar
Detaljer om 13F-arkiveringar är gratis. Detaljer om NP-arkiveringar kräver ett premiummedlemskap. Gröna rader indikerar nya positioner. Röda rader indikerar stängda positioner. Klicka på länk symbolen för att se hela transaktionshistoriken.
Uppgradera
för att låsa upp premiumdata och exportera till Excel ![]() .
.
| Fil Datum | Källa | Investerare | Typ | Genomsnittligt pris (beräknat) |
Aktier | Δ Aktier (%) |
Rapporterat värde (1000 USD) |
Δ Värde (%) |
Portföljallokering (%) |
|
|---|---|---|---|---|---|---|---|---|---|---|
| 2025-07-30 | 13F | Whittier Trust Co | 15 285 | −1,61 | 487 | 4,06 | ||||
| 2025-08-13 | 13F | Beacon Pointe Advisors, LLC | 7 559 | −10,64 | 241 | −5,12 | ||||
| 2025-08-14 | 13F | BancorpSouth Bank | 10 419 | 11,76 | 332 | 18,57 | ||||
| 2025-08-12 | 13F | Archer Investment Corp | 882 | 28 | ||||||
| 2025-08-14 | 13F/A | Rockefeller Capital Management L.P. | 55 153 | 0,00 | 1 759 | 5,78 | ||||
| 2025-07-18 | 13F | Pure Financial Advisors, Inc. | 8 078 | 0,00 | 258 | 5,76 | ||||
| 2025-08-11 | 13F | Ritter Daniher Financial Advisory LLC / DE | 13 635 | 0,00 | 435 | 5,85 | ||||
| 2025-07-15 | 13F | North Star Investment Management Corp. | 2 000 | 0,00 | 64 | 5,00 | ||||
| 2025-08-05 | 13F | Lifeworks Advisors, LLC | 204 533 | −21,17 | 6 523 | −16,60 | ||||
| 2025-07-24 | 13F | Edge Financial Advisors LLC | 8 657 | 276 | ||||||
| 2025-08-12 | 13F | Change Path, LLC | 49 536 | −0,16 | 1 580 | 5,62 | ||||
| 2025-07-14 | 13F | Sowell Financial Services LLC | 0 | −100,00 | 0 | |||||
| 2025-07-28 | 13F | Sagespring Wealth Partners, Llc | 7 509 | −11,52 | 239 | −6,27 | ||||
| 2025-08-07 | 13F | Resources Investment Advisors, LLC. | 41 473 | −1,00 | 1 323 | 4,75 | ||||
| 2025-08-01 | 13F | Petra Financial Advisors Inc | 140 130 | 1,58 | 4 469 | 7,48 | ||||
| 2025-05-14 | 13F | Flow Traders U.s. Llc | 0 | −100,00 | 0 | |||||
| 2025-08-12 | 13F | Steward Partners Investment Advisory, Llc | 14 924 | 46,72 | 476 | 55,23 | ||||
| 2025-07-15 | 13F | Mather Group, Llc. | 33 420 | −1,33 | 1 066 | 4,41 | ||||
| 2025-04-29 | 13F | Hm Payson & Co | 4 550 | −16,57 | 137 | 0,00 | ||||
| 2025-07-30 | 13F | Forum Financial Management, LP | 160 123 | 0,00 | 5 106 | 5,80 | ||||
| 2025-07-09 | 13F | Procyon Private Wealth Partners, LLC | 21 929 | 699 | ||||||
| 2025-08-12 | 13F | Northstar Financial Companies, Inc. | 12 719 | −21,35 | 406 | −16,84 | ||||
| 2025-08-13 | 13F | Renaissance Technologies Llc | 98 300 | −80,83 | 3 135 | −79,73 | ||||
| 2025-07-30 | 13F | Whittier Trust Co Of Nevada Inc | 3 575 | 0,00 | 114 | 5,61 | ||||
| 2025-08-07 | 13F | PFG Advisors | 7 717 | 246 | ||||||
| 2025-08-14 | 13F | TCG Advisory Services, LLC | 11 018 | −1,62 | 351 | 4,15 | ||||
| 2025-08-18 | 13F | Geneos Wealth Management Inc. | 6 381 | 0,00 | 203 | 5,73 | ||||
| 2025-08-05 | 13F | Meixler Investment Management, Ltd. | 67 977 | 24,14 | 2 168 | 31,33 | ||||
| 2025-08-12 | 13F | Integrated Advisors Network LLC | 17 649 | −40,08 | 563 | −36,64 | ||||
| 2025-07-23 | 13F | Traphagen Investment Advisors Llc | 6 286 | 200 | ||||||
| 2025-08-08 | 13F | Wealth Quarterback LLC | 12 005 | −5,20 | 383 | 0,26 | ||||
| 2025-07-15 | 13F | Main Street Group, LTD | 4 901 | 1 584,19 | 156 | 1 850,00 | ||||
| 2025-07-07 | 13F | RDA Financial Network | 61 237 | 178,57 | 1 953 | 194,86 | ||||
| 2025-07-29 | 13F | Stratos Wealth Partners, LTD. | 87 625 | −1,76 | 2 794 | 3,94 | ||||
| 2025-07-10 | 13F | CWC Advisors, LLC. | 36 540 | 0,68 | 1 165 | 6,59 | ||||
| 2025-08-20 | 13F/A | Thompson Davis & Co., Inc. | 7 975 | 0,00 | 254 | 5,83 | ||||
| 2025-08-14 | 13F | Mariner, LLC | 19 488 | 55,37 | 621 | 64,29 | ||||
| 2025-07-16 | 13F | Castleview Partners, Llc | 65 156 | −23,38 | 2 078 | −18,93 | ||||
| 2025-07-11 | 13F | Farther Finance Advisors, LLC | 186 906 | 171,43 | 5 960 | 187,78 | ||||
| 2025-09-04 | 13F/A | Advisor Group Holdings, Inc. | 436 407 | 3,15 | 13 917 | 9,13 | ||||
| 2025-05-09 | 13F | Belvedere Trading LLC | Call | 0 | −100,00 | 0 | ||||
| 2025-08-15 | 13F | Kestra Advisory Services, LLC | 10 569 | −25,44 | 337 | −21,08 | ||||
| 2025-08-12 | 13F | Winnow Wealth Llc | 288 706 | 9 207 | ||||||
| 2025-08-13 | 13F | EverSource Wealth Advisors, LLC | 10 355 | 0,00 | 330 | 5,77 | ||||
| 2025-08-14 | 13F | DZ BANK AG Deutsche Zentral Genossenschafts Bank, Frankfurt am Main | 87 539 | −16,20 | 2 792 | −11,34 | ||||
| 2025-08-12 | 13F | Global Retirement Partners, LLC | 5 676 | 92,80 | 181 | 144,59 | ||||
| 2025-07-31 | 13F | Oppenheimer & Co Inc | 132 165 | 3,58 | 4 215 | 9,60 | ||||
| 2025-08-13 | 13F | Continuum Advisory, LLC | 14 032 | 1 936,57 | 447 | 2 135,00 | ||||
| 2025-08-14 | 13F | Camarda Financial Advisors, LLC | 8 832 | −20,23 | 282 | −15,62 | ||||
| 2025-08-13 | 13F | Transce3nd, LLC | 192 | 6 | ||||||
| 2025-04-15 | 13F | Noble Wealth Management PBC | 340 | 0,00 | 10 | 25,00 | ||||
| 2025-08-14 | 13F | Merk Investments LLC | 19 249 | 50,45 | 614 | 59,22 | ||||
| 2025-07-29 | 13F | Lyell Wealth Management, Lp | 59 795 | 0,00 | 1 907 | 5,77 | ||||
| 2025-08-13 | 13F | Smith, Moore & Co. | 14 097 | −3,09 | 450 | 2,51 | ||||
| 2025-08-14 | 13F | Wealth Preservation Advisors, LLC | 800 | 0,00 | 26 | 4,17 | ||||
| 2025-08-05 | 13F | Strategic Financial Concepts, LLC | 7 927 | −42,00 | 253 | −38,69 | ||||
| 2025-08-18 | 13F/A | National Bank Of Canada /fi/ | 480 | 0,00 | 15 | 7,14 | ||||
| 2025-07-10 | 13F | Security National Bank | 225 509 | 348,25 | 7 191 | 374,34 | ||||
| 2025-08-06 | 13F | Smart Money Group LLC | 213 434 | 2,95 | 6 806 | 8,93 | ||||
| 2025-08-14 | 13F | Raymond James Financial Inc | 791 392 | 38,36 | 25 237 | 46,39 | ||||
| 2025-08-14 | 13F | Wick Capital Partners, LLC | 19 064 | 42,15 | 428 | 5,69 | ||||
| 2025-08-12 | 13F | Proequities, Inc. | Put | 0 | 0 | |||||
| 2025-08-19 | 13F/A | Pitcairn Co | 1 110 805 | −28,68 | 35 424 | −24,54 | ||||
| 2025-07-16 | 13F | Littlejohn Financial Services, Inc. | 10 000 | 0,00 | 319 | 5,65 | ||||
| 2025-08-12 | 13F | Proequities, Inc. | Call | 0 | 0 | |||||
| 2025-08-13 | 13F | Financial & Tax Architects, LLC | 13 226 | 16,23 | 422 | 23,10 | ||||
| 2025-08-12 | 13F | Proequities, Inc. | 0 | 0 | ||||||
| 2025-08-14 | 13F | GWM Advisors LLC | 14 203 | −26,38 | 453 | −22,20 | ||||
| 2025-07-08 | 13F | Nbc Securities, Inc. | 9 945 | −1,69 | 0 | |||||
| 2025-08-14 | 13F | Royal Bank Of Canada | 3 797 | 216,42 | 121 | 236,11 | ||||
| 2025-08-04 | 13F | Assetmark, Inc | 483 | 62,63 | 15 | 87,50 | ||||
| 2025-08-01 | 13F | Gwn Securities Inc. | 10 460 | 334 | ||||||
| 2025-07-09 | 13F | Veracity Capital LLC | 9 125 | 1,93 | 291 | 7,81 | ||||
| 2025-07-25 | 13F | Sequoia Financial Advisors, LLC | 28 136 | 0,00 | 897 | 5,78 | ||||
| 2025-08-14 | 13F | Sunbelt Securities, Inc. | 100 | 0,00 | 3 | −33,33 | ||||
| 2025-05-12 | 13F | Fiduciary Family Office, Llc | 0 | −100,00 | 0 | |||||
| 2025-07-29 | 13F | Huntleigh Advisors, Inc. | 0 | −100,00 | 0 | −100,00 | ||||
| 2025-08-11 | 13F | Shufro Rose & Co Llc | 15 049 | −0,21 | 454 | −0,22 | ||||
| 2025-07-21 | 13F | Ameriflex Group, Inc. | 65 | 0,00 | 2 | 100,00 | ||||
| 2025-07-28 | 13F | Kiker Wealth Management, LLC | 364 970 | −3,68 | 11 639 | 1,91 | ||||
| 2025-08-14 | 13F | Ieq Capital, Llc | 0 | −100,00 | 0 | |||||
| 2025-07-10 | 13F | Wealth Enhancement Advisory Services, Llc | 703 054 | −1,48 | 22 593 | 5,04 | ||||
| 2025-08-04 | 13F | Wealth Management Associates, Inc. | 6 755 | 0,00 | 215 | 5,91 | ||||
| 2025-08-01 | 13F | Envestnet Asset Management Inc | 919 041 | 11,81 | 29 308 | 18,30 | ||||
| 2025-07-17 | 13F | Janney Montgomery Scott LLC | 15 225 | 0,00 | 0 | |||||
| 2025-08-12 | 13F | Virtu Financial LLC | 93 188 | 3 | ||||||
| 2025-07-17 | 13F | HB Wealth Management, LLC | 24 417 | 6,88 | 779 | 13,08 | ||||
| 2025-05-14 | 13F | Jane Street Group, Llc | 0 | −100,00 | 0 | |||||
| 2025-08-14 | 13F | Ameriprise Financial Inc | 770 869 | 13,28 | 24 863 | 21,21 | ||||
| 2025-07-28 | 13F | Tower Wealth Partners, Inc. | 48 114 | −5,37 | 1 534 | 0,13 | ||||
| 2025-08-06 | 13F | Commonwealth Equity Services, Llc | 135 446 | 2,77 | 4 | 33,33 | ||||
| 2025-07-14 | 13F | Abound Wealth Management | 1 | 0,00 | 0 | |||||
| 2025-08-14 | 13F | EP Wealth Advisors, Inc. | 63 579 | 1,58 | 2 028 | 7,48 | ||||
| 2025-07-23 | 13F | WESPAC Advisors, LLC | 46 073 | 0,00 | 1 469 | 5,84 | ||||
| 2025-08-14 | 13F | Modern Wealth Management, LLC | 602 481 | −4,29 | 19 213 | 1,28 | ||||
| 2025-07-24 | 13F | IFP Advisors, Inc | 969 | 4,31 | 31 | 7,14 | ||||
| 2025-08-27 | 13F/A | Brinker Capital Investments, LLC | 6 509 | 208 | ||||||
| 2025-07-17 | 13F | Wolff Wiese Magana Llc | 8 236 | 0,00 | 263 | 5,65 | ||||
| 2025-08-08 | 13F | Foundations Investment Advisors, LLC | 38 046 | 12,57 | 1 213 | 19,16 | ||||
| 2025-05-12 | 13F | Independent Advisor Alliance | 0 | −100,00 | 0 | |||||
| 2025-07-24 | 13F | PDS Planning, Inc | 167 778 | 0,00 | 5 350 | 5,81 | ||||
| 2025-08-21 | NP | RAAX - VanEck Vectors Real Asset Allocation ETF | 915 715 | 5,14 | 29 202 | 11,25 | ||||
| 2025-08-27 | NP | APPLX - Appleseed Fund Investor Class | 50 000 | 0,00 | 1 594 | 5,77 | ||||
| 2025-07-08 | 13F | Baker Ellis Asset Management LLC | 37 000 | 0,00 | 1 180 | 5,74 | ||||
| 2025-07-23 | 13F | Morton Capital Management LLC/CA | 3 878 128 | −6,86 | 123 674 | −1,45 | ||||
| 2025-08-11 | 13F | Sprott Inc. | 43 798 | 119,84 | 1 397 | 132,67 | ||||
| 2025-08-15 | 13F | Morgan Stanley | 47 535 | 26,47 | 1 516 | 33,83 | ||||
| 2025-08-13 | 13F | Keystone Financial Group | 9 303 | 297 | ||||||
| 2025-08-14 | 13F | Financial Network Wealth Advisors LLC | 1 702 | 0,00 | 54 | 5,88 | ||||
| 2025-08-14 | 13F | Mml Investors Services, Llc | 348 034 | −10,36 | 11 | 0,00 | ||||
| 2025-05-15 | 13F | Tower Research Capital LLC (TRC) | 0 | −100,00 | 0 | |||||
| 2025-05-07 | 13F | WMS Partners, LLC | 0 | −100,00 | 0 | |||||
| 2025-08-12 | 13F | Ameritas Investment Partners, Inc. | 453 | 14 | ||||||
| 2025-07-17 | 13F | Patton Albertson Miller Group, Llc | 12 365 | 0,00 | 394 | 5,91 | ||||
| 2025-07-15 | 13F | Accurate Wealth Management, LLC | 25 845 | 116,28 | 828 | 122,31 | ||||
| 2025-08-14 | 13F | IHT Wealth Management, LLC | 15 778 | −77,91 | 503 | −76,63 | ||||
| 2025-08-06 | 13F | Legacy Investment Solutions, LLC | 1 100 | 0,00 | 35 | 16,67 | ||||
| 2025-08-06 | 13F/A | Three Cord True Wealth Management, LLC | 117 661 | 3 752 | ||||||
| 2025-08-07 | 13F | Samalin Investment Counsel, LLC | 169 439 | −13,18 | 5 403 | −8,14 | ||||
| 2025-08-12 | 13F | XTX Topco Ltd | 6 340 | 202 | ||||||
| 2025-08-06 | 13F | Destiny Capital Corp/CO | 11 060 | 0,00 | 353 | 5,71 | ||||
| 2025-08-14 | 13F | Susquehanna International Group, Llp | 6 964 | −92,22 | 222 | −91,77 | ||||
| 2025-07-14 | 13F | Westend Capital Management LLC | 30 | 1 | ||||||
| 2025-08-06 | 13F | Golden State Wealth Management, LLC | 5 853 | −21,42 | 187 | −16,96 | ||||
| 2025-08-11 | 13F | HighTower Advisors, LLC | 348 580 | −4,18 | 11 116 | 1,38 | ||||
| 2025-07-23 | 13F/A | Euro Pacific Asset Management, LLC | 455 611 | 0,96 | 15 | 7,69 | ||||
| 2025-08-14 | 13F | Wells Fargo & Company/mn | 0 | −100,00 | 0 | |||||
| 2025-07-16 | 13F | ORG Partners LLC | 20 205 | 57,85 | 650 | 68,57 | ||||
| 2025-08-13 | 13F | Northwestern Mutual Wealth Management Co | 1 949 | −22,44 | 62 | −17,33 | ||||
| 2025-08-14 | 13F | Ambassador Advisors, LLC | 120 636 | 12,31 | 3 847 | 18,84 | ||||
| 2025-08-05 | 13F | Simplex Trading, Llc | 199 | 0 | ||||||
| 2025-08-14 | 13F | Silvercrest Asset Management Group Llc | 7 520 | 0,00 | 240 | 5,75 | ||||
| 2025-08-05 | 13F | Plante Moran Financial Advisors, LLC | 911 | 0,00 | 29 | 7,41 | ||||
| 2025-08-12 | 13F | Jaffetilchin Investment Partners, LLC | 7 600 | 0,00 | 242 | 5,68 | ||||
| 2025-08-14 | 13F | Main Street Financial Solutions, LLC | 40 436 | 1 290 | ||||||
| 2025-08-14 | 13F | Stifel Financial Corp | 42 373 | −12,43 | 1 351 | −7,34 | ||||
| 2025-08-14 | 13F | Financial Advisory Service, Inc. | 34 739 | 1 108 | ||||||
| 2025-07-15 | 13F | Spectrum Planning & Advisory Services Inc. | 19 504 | 0,40 | 622 | 6,15 | ||||
| 2025-08-12 | 13F | MAI Capital Management | 3 326 | 0,00 | 106 | 6,00 | ||||
| 2025-08-14 | 13F | Citadel Advisors Llc | Put | 0 | −100,00 | 0 | ||||
| 2025-08-19 | 13F | Cape Investment Advisory, Inc. | 7 428 | −8,11 | 237 | −2,88 | ||||
| 2025-07-02 | 13F | HBW Advisory Services LLC | 47 478 | 19,47 | 1 514 | 26,48 | ||||
| 2025-08-08 | 13F | Cetera Investment Advisers | 1 697 363 | 2,49 | 54 129 | 8,44 | ||||
| 2025-08-15 | 13F | CI Private Wealth, LLC | 8 572 | 273 | ||||||
| 2025-07-14 | 13F | AdvisorNet Financial, Inc | 1 261 | −20,14 | 40 | −14,89 | ||||
| 2025-08-29 | 13F | Centaurus Financial, Inc. | 98 578 | 3 | ||||||
| 2025-07-29 | 13F | Private Trust Co Na | 2 549 | 221,44 | 81 | 252,17 | ||||
| 2025-08-12 | 13F | Accordant Advisory Group Inc | 288 706 | 4,68 | 9 207 | 10,76 | ||||
| 2025-07-17 | 13F | DiNuzzo Private Wealth, Inc. | 25 480 | 133,25 | 813 | 146,81 | ||||
| 2025-08-14 | 13F | Colony Group, LLC | 32 843 | 51,55 | 1 047 | 60,34 | ||||
| 2025-08-14 | 13F | Group One Trading, L.p. | 594 | 19 | ||||||
| 2025-08-14 | 13F | Group One Trading, L.p. | Call | 100 | 3 | |||||
| 2025-07-28 | 13F | SFG Wealth Management, LLC. | 100 516 | 3,88 | 3 205 | 9,91 | ||||
| 2025-08-04 | 13F | Mayflower Financial Advisors, LLC | 37 090 | 9,44 | 1 183 | 15,77 | ||||
| 2025-07-29 | 13F | Stephens Inc /ar/ | 6 775 | 0,00 | 216 | 5,88 | ||||
| 2025-07-16 | 13F | Perigon Wealth Management, LLC | 13 370 | 90,21 | 426 | 101,90 | ||||
| 2025-07-22 | 13F | Warwick Investment Management, Inc. | 53 661 | 5,51 | 1 711 | 11,68 | ||||
| 2025-08-05 | 13F | Snider Financial Group | 10 532 | 0,00 | 336 | 5,68 | ||||
| 2025-08-13 | 13F | VestGen Advisors, LLC | 12 839 | 409 | ||||||
| 2025-08-14 | 13F | UBS Group AG | 89 | 3 | ||||||
| 2025-08-14 | 13F | Money Concepts Capital Corp | 243 152 | 0,71 | 7 754 | 6,57 | ||||
| 2025-08-04 | 13F | Northwest Financial Advisors | 7 896 | 0,00 | 252 | 5,91 | ||||
| 2025-07-21 | 13F | Ameritas Advisory Services, LLC | 207 547 | −15,71 | 6 619 | 5,11 | ||||
| 2025-08-11 | 13F | Perennial Investment Advisors, LLC | 88 807 | 947,87 | 2 832 | 1 010,59 | ||||
| 2025-08-12 | 13F | Manchester Capital Management LLC | 2 896 | 0,00 | 92 | 5,75 | ||||
| 2025-08-14 | 13F | Van Eck Associates Corp | 1 252 067 | 41,69 | 40 | 50,00 | ||||
| 2025-08-08 | 13F | Creative Planning | 61 692 | 1,08 | 1 967 | 6,96 | ||||
| 2025-08-14 | 13F | Crawford Fund Management, LLC | 0 | −100,00 | 0 | |||||
| 2025-07-14 | 13F | Clear Harbor Asset Management, LLC | 41 750 | −2,34 | 1 331 | 3,34 | ||||
| 2025-08-01 | 13F | Solstein Capital, LLC | 240 374 | 2,44 | 7 666 | 8,39 | ||||
| 2025-08-14 | 13F | Benjamin Edwards Inc | 22 438 | 209,96 | 716 | 227,98 | ||||
| 2025-08-12 | 13F | BlackRock, Inc. | 6 500 | 207 | ||||||
| 2025-08-11 | 13F | Principal Securities, Inc. | 254 | −93,86 | 8 | −92,31 | ||||
| 2025-08-07 | 13F | Montag A & Associates Inc | 20 | 0,00 | 1 | |||||
| 2025-08-11 | 13F | M Wealth Management, LLC | 7 373 | 0,00 | 235 | 5,86 | ||||
| 2025-08-19 | 13F | Advisory Services Network, LLC | 166 729 | 16,89 | 5 285 | 22,94 | ||||
| 2025-08-14 | 13F | Two Sigma Securities, Llc | 10 630 | 339 | ||||||
| 2025-07-23 | 13F | Valmark Advisers, Inc. | 40 195 | 8,44 | 1 282 | 14,68 | ||||
| 2025-08-12 | 13F | Terra Nova Asset Management LLC | 55 695 | 0,00 | 1 776 | 5,84 | ||||
| 2025-07-14 | 13F | Oliver Luxxe Assets LLC | 10 759 | 11,48 | 343 | 18,28 | ||||
| 2025-08-06 | 13F | Pekin Hardy Strauss, Inc. | 336 360 | −2,18 | 10 727 | 3,50 | ||||
| 2025-08-12 | 13F | Jpmorgan Chase & Co | 308 445 | 51,37 | 9 836 | 60,17 | ||||
| 2025-08-14 | 13F | Bank Of America Corp /de/ | Put | 5 000 | 0,00 | 159 | 6,00 | |||
| 2025-08-14 | 13F | Bank Of America Corp /de/ | 150 | −83,92 | 5 | −85,71 | ||||
| 2025-08-12 | 13F | Gladstone Institutional Advisory LLC | 92 418 | 4,03 | 2 947 | 10,09 | ||||
| 2025-05-12 | 13F | Simplex Trading, Llc | Call | 0 | −100,00 | 0 | ||||
| 2025-08-13 | 13F | Mount Yale Investment Advisors, LLC | 13 941 | 445 | ||||||
| 2025-07-30 | 13F | Capital Wealth Alliance, LLC | 147 887 | −0,26 | 4 716 | 5,55 | ||||
| 2025-07-11 | 13F | SILVER OAK SECURITIES, Inc | 377 149 | −2,43 | 12 027 | 4,69 | ||||
| 2025-08-12 | 13F | White Pine Capital Llc | 22 311 | −0,45 | 711 | 5,33 | ||||
| 2025-07-23 | 13F | Drake & Associates, LLC | 400 465 | 12 771 | ||||||
| 2025-08-14 | 13F | Citadel Advisors Llc | Call | 73 400 | 5,01 | 2 341 | 11,11 | |||
| 2025-07-18 | 13F | Bartlett & Co. Wealth Management Llc | 7 500 | 0,00 | 239 | 5,75 | ||||
| 2025-06-03 | 13F | Invst, LLC | 10 924 | 329 | ||||||
| 2025-08-15 | 13F | Equitable Holdings, Inc. | 74 503 | 372,76 | 2 376 | 401,05 | ||||
| 2025-05-14 | 13F | New Harbor Financial Group, LLC | 0 | −100,00 | 0 | |||||
| 2025-07-23 | 13F | Vontobel Holding Ltd. | 9 000 | 0,00 | 287 | 5,90 | ||||
| 2025-08-13 | 13F | Quadrature Capital Ltd | 636 339 | 20 293 | ||||||
| 2025-07-25 | 13F | Atria Wealth Solutions, Inc. | 0 | −100,00 | 0 | |||||
| 2025-07-24 | 13F | Us Bancorp \de\ | 0 | −100,00 | 0 | |||||
| 2025-07-15 | 13F | Sheets Smith Wealth Management | 85 009 | 11,65 | 2 711 | 18,13 | ||||
| 2025-05-09 | 13F | Belvedere Trading LLC | Put | 0 | −100,00 | 0 | ||||
| 2025-08-14 | 13F | Knightsbridge Asset Management, Llc | 23 586 | −12,12 | 752 | −6,93 | ||||
| 2025-07-31 | 13F | Cambridge Investment Research Advisors, Inc. | 523 443 | 182,55 | 17 | 220,00 | ||||
| 2025-07-24 | 13F | Stonebridge Financial Group, LLC | 0 | −100,00 | 0 | |||||
| 2025-07-25 | 13F | Cwm, Llc | 8 781 | 0,48 | 0 | |||||
| 2025-08-12 | 13F | SRS Capital Advisors, Inc. | 31 162 | 994 | ||||||
| 2025-07-07 | 13F | Whitaker-Myers Wealth Managers, LTD. | 14 874 | −2,47 | 474 | 3,27 | ||||
| 2025-08-06 | 13F | Walkner Condon Financial Advisors LLC | 43 664 | 4,92 | 1 392 | 11,01 | ||||
| 2025-07-11 | 13F/A | Umb Bank N A/mo | 64 539 | 0,00 | 2 058 | 5,81 | ||||
| 2025-07-17 | 13F | CWA Asset Management Group, LLC | 7 478 | 0,00 | 238 | 5,78 | ||||
| 2025-07-24 | 13F | Robertson Stephens Wealth Management, LLC | 33 003 | 36,80 | 1 052 | 44,70 | ||||
| 2025-08-04 | 13F | Atria Investments Llc | 95 434 | 3 043 | ||||||
| 2025-08-14 | 13F | Citadel Advisors Llc | 0 | −100,00 | 0 | |||||
| 2025-07-08 | 13F | Atwood & Palmer Inc | 749 | 0,00 | 24 | 4,55 | ||||
| 2025-08-07 | 13F | Evoke Wealth, Llc | 36 299 | 1 158 | ||||||
| 2025-08-14 | 13F | Bnp Paribas Arbitrage, Sa | 0 | −100,00 | 0 | |||||
| 2025-05-14 | 13F | Orion Portfolio Solutions, LLC | 8 552 | 0,00 | 216 | 0,00 | ||||
| 2025-08-18 | 13F | Hollencrest Capital Management | 860 | 0,00 | 27 | 8,00 | ||||
| 2025-07-28 | 13F | Harbour Investments, Inc. | 3 734 | −3,99 | 119 | 1,71 | ||||
| 2025-07-29 | 13F | Chicago Partners Investment Group LLC | 12 575 | 0,00 | 411 | 0,49 | ||||
| 2025-07-22 | 13F | DAVENPORT & Co LLC | 11 900 | 0,00 | 379 | 5,87 | ||||
| 2025-08-13 | 13F | Plan Group Financial, LLC | 93 250 | 11,68 | 2 974 | 18,16 | ||||
| 2025-07-22 | 13F | USAdvisors Wealth Management, LLC | 72 922 | 2 | ||||||
| 2025-08-07 | 13F | Proficio Capital Partners LLC | 14 600 | 0,00 | 466 | 5,68 | ||||
| 2025-08-14 | 13F | Smartleaf Asset Management LLC | 1 069 | 0,00 | 34 | 6,45 | ||||
| 2025-07-30 | 13F | Sloy Dahl & Holst, LLC | 37 860 | 0,00 | 1 207 | 5,78 | ||||
| 2025-07-18 | 13F | Dogwood Wealth Management LLC | 216 953 | 12,32 | 6 906 | 18,62 | ||||
| 2025-08-08 | 13F | Pnc Financial Services Group, Inc. | 608 | 0,00 | 19 | 5,56 | ||||
| 2025-07-23 | 13F | Guild Investment Management, Inc. | 142 420 | 0,61 | 4 542 | 6,45 | ||||
| 2025-08-05 | 13F | Sigma Planning Corp | 68 401 | 26,35 | 2 181 | 33,72 | ||||
| 2025-07-23 | 13F | Kingswood Wealth Advisors, Llc | 9 323 | 297 | ||||||
| 2025-07-25 | 13F | We Are One Seven, LLC | 8 822 | −1,51 | 281 | 4,46 | ||||
| 2025-05-07 | 13F | Spectrum Wealth Counsel, LLC | 9 938 | 300 | ||||||
| 2025-08-14 | 13F | Comerica Bank | 24 748 | −39,10 | 789 | −35,54 | ||||
| 2025-08-14 | 13F | Fmr Llc | 414 | 381,40 | 13 | 550,00 | ||||
| 2025-08-06 | 13F | Legacy Wealth Managment, LLC/ID | 1 100 | 0,00 | 35 | 6,06 | ||||
| 2025-08-12 | 13F | LPL Financial LLC | 3 088 565 | 16,30 | 98 494 | 23,05 |