Grundläggande statistik
| Institutionella ägare | 241 total, 238 long only, 0 short only, 3 long/short - change of 5,24% MRQ |
| Genomsnittlig portföljallokering | 0.0578 % - change of 9,81% MRQ |
| Institutionella aktier (lång) | 74 875 394 (ex 13D/G) - change of 0,50MM shares 0,67% MRQ |
| Institutionellt värde (lång) | $ 479 942 USD ($1000) |
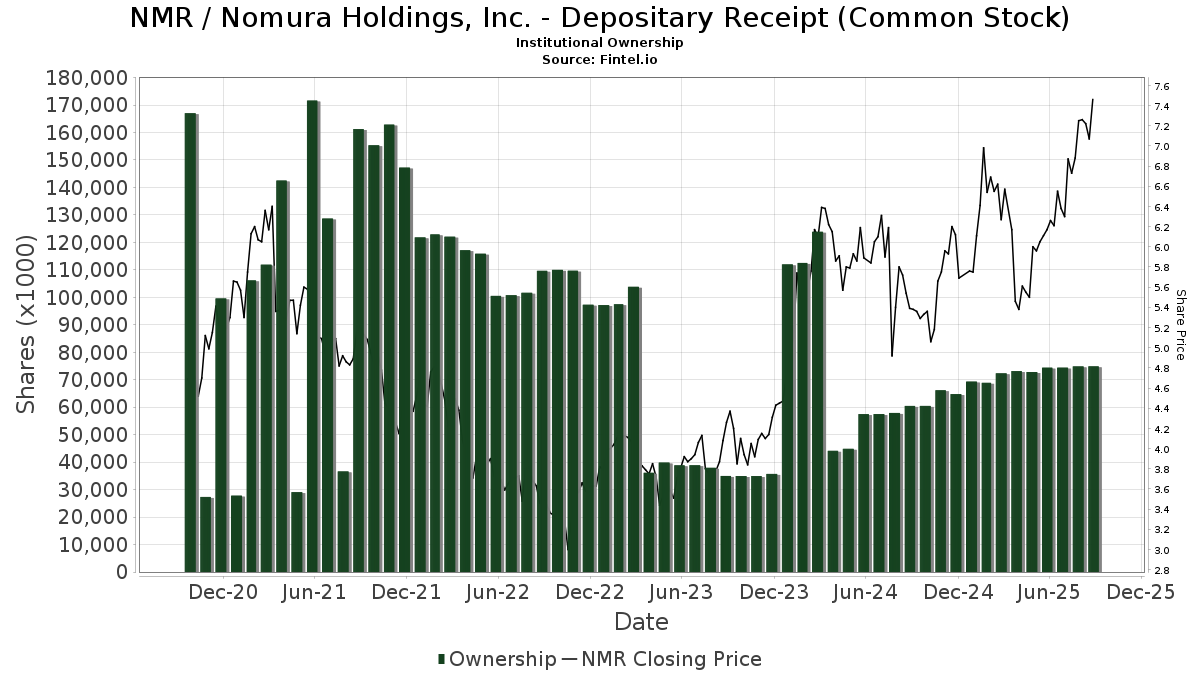
Institutionellt ägande och aktieägare
Nomura Holdings, Inc. - Depositary Receipt (Common Stock) (US:NMR) har 241 Institutionella ägare och aktieägare som har lämnat in 13D/G- eller 13F-formulär till Securities Exchange Commission (SEC). Dessa institut innehar totalt 74,875,394 aktier. Största aktieägare inkluderar Donald Smith & Co., Inc., Fisher Asset Management, LLC, Morgan Stanley, VASVX - Vanguard Selected Value Fund Investor Shares, Goldman Sachs Group Inc, BlackRock, Inc., Dimensional Fund Advisors Lp, Northern Trust Corp, Renaissance Technologies Llc, and Fmr Llc .
Nomura Holdings, Inc. - Depositary Receipt (Common Stock) (NYSE:NMR) Institutionell ägarstruktur visar institutioners och fonders nuvarande positioner i företaget, samt de senaste förändringarna i positionernas storlek. Större aktieägare kan vara enskilda investerare, fonder, hedgefonder eller institutioner. Bilaga 13D visar att investeraren äger (eller ägde) mer än 5% av företaget och avser (eller avsåg) att aktivt eftersträva en förändring av affärsstrategin. Schedule 13G indikerar en passiv investering på över 5%.
The share price as of September 12, 2025 is 7,51 / share. Previously, on September 13, 2024, the share price was 5,43 / share. This represents an increase of 38,31% over that period.
Fondsentimentets poäng
Fondsentimentet poängen(fka Ägarackumulation-poäng) visar vilka aktier som är mest köpta av fonder. Det är resultatet av en sofistikerad kvantitativ flerfaktormodell som identifierar företag med de högsta nivåerna av institutionell ackumulering. Poängsättningsmodellen använder en kombination av den totala ökningen av redovisade ägare, förändringarna i portföljallokeringarna för dessa ägare och andra mått. Siffran sträcker sig från 0 till 100, där högre siffror indikerar en högre nivå av ackumulering i förhållande till sina konkurrenter, och 50 är genomsnittet.
Uppdateringsfrekvens: Dagligen
Se Ownership Explorer, som innehåller en lista över de högst rankade företagen.
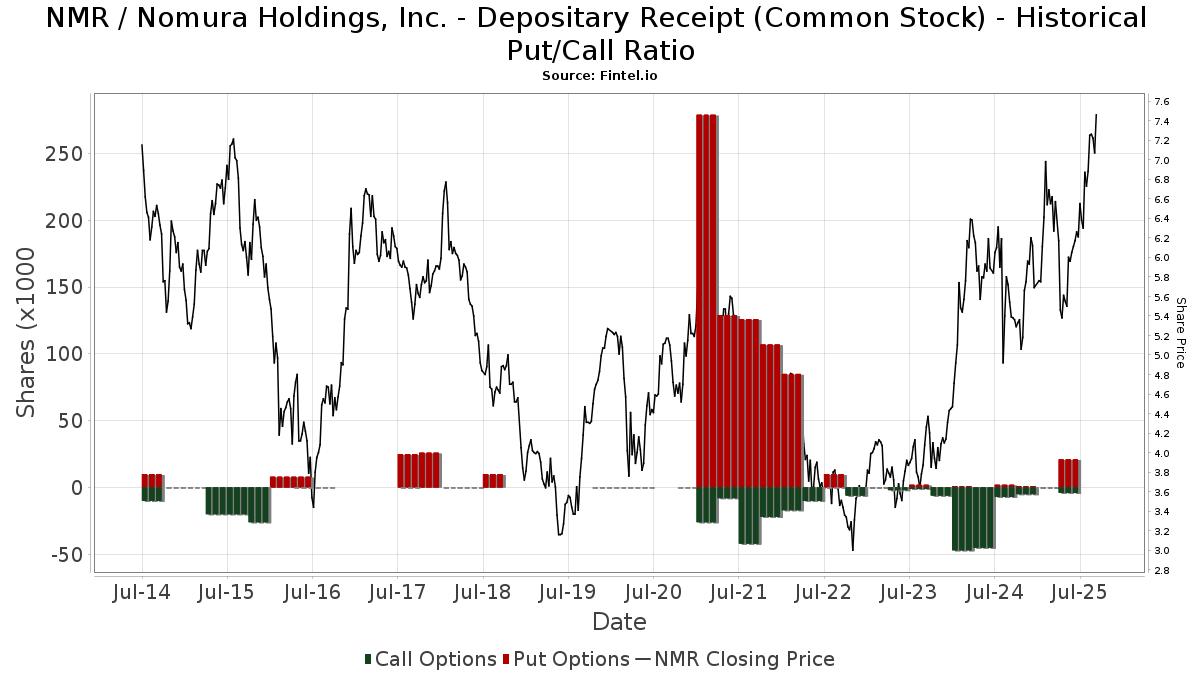
Institutionell sälj/köp-kvot
Förutom att rapportera vanliga eget kapital- och skuldemissioner måste institutioner med mer än 100MM tillgångar under förvaltning också avslöja sina innehav av sälj- och köpoptioner. Eftersom säljoptioner i allmänhet indikerar ett negativt sentiment och köpoptioner indikerar ett positivt sentiment, kan vi få en uppfattning om det övergripande institutionella sentimentet genom att plotta förhållandet mellan säljoptioner och köpoptioner. Diagrammet till höger visar det historiska förhållandet mellan sälj- och köpoptioner för detta instrument.
Genom att använda sälj/köp-kvoten som en indikator på aktieägarnas sentiment undviker man en av de största bristerna med att använda det totala institutionella ägandet, nämligen att en betydande del av de förvaltade tillgångarna investeras passivt för att följa index. Passivt förvaltade fonder köper vanligtvis inte optioner, så indikatorn för sälj/köp-kvoten ger en bättre bild av stämningen i aktivt förvaltade fonder.
13F- och NPORT-arkiveringar
Detaljer om 13F-arkiveringar är gratis. Detaljer om NP-arkiveringar kräver ett premiummedlemskap. Gröna rader indikerar nya positioner. Röda rader indikerar stängda positioner. Klicka på länk symbolen för att se hela transaktionshistoriken.
Uppgradera
för att låsa upp premiumdata och exportera till Excel ![]() .
.
| Fil Datum | Källa | Investerare | Typ | Genomsnittligt pris (beräknat) |
Aktier | Δ Aktier (%) |
Rapporterat värde (1000 USD) |
Δ Värde (%) |
Portföljallokering (%) |
|
|---|---|---|---|---|---|---|---|---|---|---|
| 2025-08-12 | 13F | Pathstone Holdings, LLC | 228 696 | −3,28 | 1 505 | 3,44 | ||||
| 2025-07-23 | 13F | DMG Group, LLC | 61 317 | −4,13 | 403 | 2,54 | ||||
| 2025-07-16 | 13F | Formidable Asset Management, LLC | 62 900 | 414 | ||||||
| 2025-08-15 | 13F | Tower Research Capital LLC (TRC) | 1 047 | 7 | ||||||
| 2025-05-15 | 13F | Point72 Asset Management, L.P. | 0 | −100,00 | 0 | |||||
| 2025-08-14 | 13F | Optiver Holding B.V. | 0 | −100,00 | 0 | |||||
| 2025-08-14 | 13F | Mariner, LLC | 300 400 | 14,40 | 1 977 | 22,35 | ||||
| 2025-08-14 | 13F | Wells Fargo & Company/mn | 63 940 | 67,10 | 421 | 78,72 | ||||
| 2025-08-11 | 13F | Cornerstone Planning Group LLC | 849 | 71,17 | 6 | 150,00 | ||||
| 2025-08-13 | 13F | Flow Traders U.s. Llc | 11 445 | 0 | ||||||
| 2025-08-12 | 13F | Manchester Capital Management LLC | 144 | 1 | ||||||
| 2025-08-08 | 13F | Crossmark Global Holdings, Inc. | 217 354 | −0,01 | 1 430 | 7,04 | ||||
| 2025-08-14 | 13F | Boston Private Wealth Llc | 0 | −100,00 | 0 | |||||
| 2025-06-26 | NP | DFA INVESTMENT DIMENSIONS GROUP INC - World ex U.S. Core Equity Portfolio Institutional Class Shares | 9 532 | −53,16 | 53 | −60,31 | ||||
| 2025-07-16 | 13F | Five Oceans Advisors | 13 507 | −9,40 | 89 | −3,30 | ||||
| 2025-08-01 | 13F | Envestnet Asset Management Inc | 34 913 | 6,02 | 230 | 13,37 | ||||
| 2025-08-08 | 13F | Abc Arbitrage Sa | 117 412 | −60,55 | 773 | −57,81 | ||||
| 2025-08-13 | 13F | Russell Investments Group, Ltd. | 91 559 | 23,67 | 602 | 32,31 | ||||
| 2025-08-14 | 13F | Peak6 Llc | Put | 17 800 | 117 | |||||
| 2025-07-08 | 13F | Parallel Advisors, LLC | 21 002 | −16,69 | 138 | −10,97 | ||||
| 2025-08-12 | 13F | Charles Schwab Investment Management Inc | 526 853 | 13,88 | 3 467 | 21,83 | ||||
| 2025-08-14 | 13F | Peak6 Llc | 1 371 | 9 | ||||||
| 2025-09-12 | 13F/A | Valeo Financial Advisors, LLC | 13 663 | −0,52 | 90 | 5,95 | ||||
| 2025-08-13 | 13F | Baird Financial Group, Inc. | 0 | −100,00 | 0 | |||||
| 2025-05-15 | 13F | Engineers Gate Manager LP | 0 | −100,00 | 0 | |||||
| 2025-07-25 | 13F | JustInvest LLC | 431 978 | 5,96 | 2 842 | 13,36 | ||||
| 2025-08-13 | 13F | Rsm Us Wealth Management Llc | 32 353 | −18,57 | 213 | −13,11 | ||||
| 2025-07-16 | 13F | Highline Wealth Partners Llc | 319 | 0,00 | 2 | 100,00 | ||||
| 2025-08-13 | 13F | Marshall Wace, Llp | 111 987 | −55,29 | 737 | −52,21 | ||||
| 2025-08-04 | 13F | Hantz Financial Services, Inc. | 8 906 | 828,68 | 0 | |||||
| 2025-08-01 | 13F | SYM FINANCIAL Corp | 14 039 | −13,56 | 92 | −7,07 | ||||
| 2025-07-24 | 13F | PDS Planning, Inc | 35 580 | −9,67 | 234 | −3,31 | ||||
| 2025-08-12 | 13F | O'shaughnessy Asset Management, Llc | 161 568 | 60,55 | 1 063 | 72,01 | ||||
| 2025-05-15 | 13F | Two Sigma Investments, Lp | 0 | −100,00 | 0 | |||||
| 2025-07-18 | 13F | Generali Investments CEE, investicni spolecnost, a.s. | 39 500 | 0,00 | 260 | 7,02 | ||||
| 2025-07-15 | 13F | Ballentine Partners, LLC | 61 361 | −16,33 | 404 | −10,64 | ||||
| 2025-08-19 | 13F | Cape Investment Advisory, Inc. | 865 | 36,44 | 6 | 66,67 | ||||
| 2025-07-17 | 13F | Albion Financial Group /ut | 0 | −100,00 | 0 | |||||
| 2025-08-08 | 13F | Creative Planning | 365 734 | −30,44 | 2 407 | −25,58 | ||||
| 2025-06-26 | NP | DFALX - Large Cap International Portfolio - Institutional Class This fund is a listed as child fund of Dimensional Fund Advisors Lp and if that institution has disclosed ownership in this security, then these positions will not be double counted when calculating total shares and total value | 247 991 | −17,36 | 1 376 | −29,22 | ||||
| 2025-08-12 | 13F | Coldstream Capital Management Inc | 74 327 | 973,16 | 489 | 1 064,29 | ||||
| 2025-07-08 | 13F | Gallacher Capital Management LLC | 77 802 | 5,91 | 512 | 13,30 | ||||
| 2025-08-14 | 13F/A | Skopos Labs, Inc. | 11 589 | 260,24 | 76 | 300,00 | ||||
| 2025-07-30 | 13F | Eqis Capital Management, Inc. | 91 643 | −0,75 | 603 | 6,35 | ||||
| 2025-08-12 | 13F | AlphaCore Capital LLC | 23 584 | 155 | ||||||
| 2025-08-05 | 13F | Bank of New York Mellon Corp | 230 623 | −2,25 | 1 518 | 4,62 | ||||
| 2025-08-06 | NP | LINCOLN VARIABLE INSURANCE PRODUCTS TRUST - LVIP Dimensional International Core Equity Fund Standard Class | 13 054 | 0,00 | 86 | 6,25 | ||||
| 2025-08-11 | 13F | Hexagon Capital Partners LLC | 0 | −100,00 | 0 | |||||
| 2025-08-14 | 13F | Bank Of America Corp /de/ | 288 582 | 13,42 | 1 899 | 21,36 | ||||
| 2025-07-21 | 13F | Successful Portfolios LLC | 15 000 | 0,00 | 99 | 6,52 | ||||
| 2025-04-22 | 13F | Mendota Financial Group, LLC | 0 | −100,00 | 0 | |||||
| 2025-07-23 | 13F | Venturi Wealth Management, LLC | 19 733 | 130 | ||||||
| 2025-08-14 | 13F | ICONIQ Capital, LLC | 23 354 | −45,21 | 154 | −31,39 | ||||
| 2025-07-23 | 13F | Optas, LLC | 31 952 | 2,48 | 210 | 9,95 | ||||
| 2025-08-14 | 13F | GWM Advisors LLC | 154 | 0,00 | 1 | |||||
| 2025-05-15 | 13F | Old Mission Capital Llc | 0 | −100,00 | 0 | −100,00 | ||||
| 2025-08-05 | 13F | Ellevest, Inc. | 62 702 | −10,98 | 413 | −4,85 | ||||
| 2025-07-10 | 13F | Baader Bank INC | 0 | −100,00 | 0 | |||||
| 2025-08-11 | 13F | Citigroup Inc | 20 386 | −13,14 | 134 | −6,94 | ||||
| 2025-08-13 | 13F | Centiva Capital, LP | 22 086 | −11,42 | 145 | −5,23 | ||||
| 2025-08-14 | 13F | Toronto Dominion Bank | 340 000 | 277,78 | 2 237 | 304,52 | ||||
| 2025-08-08 | 13F | Campbell Deegan Wealth Management, LLC | 0 | −100,00 | 0 | |||||
| 2025-08-12 | 13F | Franklin Resources Inc | 36 669 | −1,72 | 241 | 5,24 | ||||
| 2025-08-06 | 13F | Vestmark Advisory Solutions, Inc. | 39 372 | 259 | ||||||
| 2025-08-11 | 13F | Rothschild Investment Llc | 4 549 | −15,32 | 30 | −12,12 | ||||
| 2025-08-05 | 13F | South Dakota Investment Council | 36 300 | 0,00 | 0 | |||||
| 2025-08-13 | 13F | EverSource Wealth Advisors, LLC | 23 936 | 47,73 | 157 | 58,59 | ||||
| 2025-08-06 | 13F | Savant Capital, LLC | 23 810 | 97,10 | 157 | 110,81 | ||||
| 2025-08-13 | 13F | New York State Common Retirement Fund | 0 | −100,00 | 0 | |||||
| 2025-08-14 | 13F | Verition Fund Management LLC | 97 846 | 317,90 | 644 | 349,65 | ||||
| 2025-08-13 | 13F | Lido Advisors, LLC | 15 476 | −0,73 | 102 | 6,32 | ||||
| 2025-08-06 | 13F | First Horizon Advisors, Inc. | 0 | −100,00 | 0 | |||||
| 2025-07-31 | 13F | Carrera Capital Advisors | 730 716 | 109,09 | 4 808 | 123,73 | ||||
| 2025-07-07 | 13F | Versant Capital Management, Inc | 52 973 | 12,14 | 349 | 20,00 | ||||
| 2025-08-27 | NP | JNL SERIES TRUST - JNL/DFA International Core Equity Fund (I) | 3 800 | 0,00 | 25 | 8,70 | ||||
| 2025-08-14 | 13F | Group One Trading, L.p. | Call | 400 | 0,00 | 3 | 0,00 | |||
| 2025-08-13 | 13F | Cerity Partners LLC | 297 480 | −9,64 | 1 957 | −3,31 | ||||
| 2025-08-14 | 13F | XY Capital Ltd | 0 | −100,00 | 0 | |||||
| 2025-06-26 | NP | DFSI - Dimensional International Sustainability Core 1 ETF | 35 600 | 0,00 | 198 | −14,35 | ||||
| 2025-05-01 | 13F | Schechter Investment Advisors, LLC | 20 702 | −30,35 | 127 | −26,16 | ||||
| 2025-08-14 | 13F | Aqr Capital Management Llc | 325 555 | 12,44 | 2 142 | 20,34 | ||||
| 2025-08-07 | 13F | Sierra Ocean, Llc | 1 918 | −2,94 | 13 | 0,00 | ||||
| 2025-08-14 | 13F | Group One Trading, L.p. | Put | 1 900 | 13 | |||||
| 2025-08-18 | 13F | Geneos Wealth Management Inc. | 0 | −100,00 | 0 | −100,00 | ||||
| 2025-08-14 | 13F | Aquatic Capital Management LLC | 70 237 | 833,63 | 462 | 904,35 | ||||
| 2025-08-14 | 13F | Evergreen Capital Management Llc | 44 470 | −5,74 | 293 | 0,69 | ||||
| 2025-07-28 | 13F | Private Wealth Asset Management, LLC | 145 | 0,00 | 1 | |||||
| 2025-07-28 | 13F | Rosenberg Matthew Hamilton | 2 777 | 0,00 | 18 | 5,88 | ||||
| 2025-08-11 | 13F | United Capital Financial Advisers, Llc | 44 526 | −15,81 | 293 | −10,15 | ||||
| 2025-08-12 | 13F | Pacer Advisors, Inc. | 0 | −100,00 | 0 | |||||
| 2025-08-14 | 13F | Group One Trading, L.p. | 0 | −100,00 | 0 | |||||
| 2025-08-14 | 13F | Glenmede Investment Management, LP | 26 688 | 176 | ||||||
| 2025-05-15 | 13F | Graham Capital Management, L.P. | 0 | −100,00 | 0 | |||||
| 2025-07-25 | 13F | Allspring Global Investments Holdings, LLC | 48 181 | −12,31 | 316 | −6,25 | ||||
| 2025-07-18 | 13F | BSW Wealth Partners | 77 363 | −2,52 | 509 | 4,30 | ||||
| 2025-05-15 | 13F | Citadel Advisors Llc | 0 | −100,00 | 0 | |||||
| 2025-03-27 | NP | PTIN - Pacer Trendpilot International ETF | 24 739 | 0,16 | 160 | 5,26 | ||||
| 2025-07-09 | 13F | Sivia Capital Partners, LLC | 19 272 | 35,60 | 127 | 44,83 | ||||
| 2025-08-14 | 13F | Principia Wealth Advisory, LLC | 114 | 1 | ||||||
| 2025-07-25 | 13F | Stephens Consulting, LLC | 518 | 3 | ||||||
| 2025-07-29 | NP | GINX - SGI Enhanced Global Income ETF | 94 534 | 8,06 | 576 | 2,13 | ||||
| 2025-08-14 | 13F | Mangrove Partners | 118 858 | 782 | ||||||
| 2025-05-02 | 13F | Cable Hill Partners, LLC | 68 215 | −2,56 | 379 | −6,67 | ||||
| 2025-07-14 | 13F | U.S. Capital Wealth Advisors, LLC | 11 918 | 78 | ||||||
| 2025-08-13 | 13F/A | StoneX Group Inc. | 11 246 | 72 | ||||||
| 2025-08-13 | 13F | Arrowstreet Capital, Limited Partnership | 1 731 744 | −11,70 | 11 395 | −5,53 | ||||
| 2025-08-14 | 13F | Synovus Financial Corp | 13 789 | 0,00 | 91 | 7,14 | ||||
| 2025-07-31 | 13F | AlTi Global, Inc. | 10 610 | 69 | ||||||
| 2025-07-28 | 13F | BRYN MAWR TRUST Co | 4 700 | 0,00 | 31 | 7,14 | ||||
| 2025-08-13 | 13F | Donald Smith & Co., Inc. | 11 063 436 | 6,25 | 72 797 | 13,68 | ||||
| 2025-07-25 | 13F | Cwm, Llc | 12 768 | −8,34 | 0 | |||||
| 2025-07-25 | 13F | Yousif Capital Management, Llc | 50 350 | 5,46 | 331 | 12,97 | ||||
| 2025-08-13 | 13F | Twin Peaks Wealth Advisors, LLC | 837 | 6 | ||||||
| 2025-07-07 | 13F | Investors Research Corp | 22 000 | 0,00 | 145 | 6,67 | ||||
| 2025-08-01 | 13F | Bessemer Group Inc | 1 507 | 0,00 | 0 | |||||
| 2025-08-14 | 13F | EP Wealth Advisors, Inc. | 10 885 | 72 | ||||||
| 2025-08-14 | 13F | Atomi Financial Group, Inc. | 21 296 | −22,58 | 140 | −17,16 | ||||
| 2025-08-13 | 13F | Northwestern Mutual Wealth Management Co | 814 | 5 | ||||||
| 2025-05-05 | 13F | Lindbrook Capital, Llc | 16 310 | −4,16 | 100 | 2,04 | ||||
| 2025-07-21 | 13F | Qrg Capital Management, Inc. | 219 356 | −0,77 | 1 443 | 6,18 | ||||
| 2025-07-28 | 13F | Harbour Investments, Inc. | 800 | 0,00 | 5 | 25,00 | ||||
| 2025-07-23 | 13F | Canopy Partners, LLC | 14 034 | −19,96 | 92 | −14,02 | ||||
| 2025-08-14 | 13F | Ameriprise Financial Inc | 79 499 | 12,98 | 523 | 21,06 | ||||
| 2025-08-05 | 13F | Bank Of Montreal /can/ | 28 924 | 4,79 | 190 | 12,43 | ||||
| 2025-07-09 | 13F | Baron Wealth Management LLC | 14 487 | 95 | ||||||
| 2025-08-13 | 13F | GeoWealth Management, LLC | 11 055 | 2,73 | 73 | 9,09 | ||||
| 2025-08-13 | 13F | Natixis Advisors, L.p. | 261 818 | 16,52 | 2 | 0,00 | ||||
| 2025-07-31 | 13F | Buckingham Strategic Partners | 14 907 | 29,45 | 98 | 38,57 | ||||
| 2025-05-09 | 13F | R Squared Ltd | 0 | −100,00 | 0 | |||||
| 2025-06-26 | NP | DXIV - Dimensional International Vector Equity ETF | 6 900 | 6,15 | 38 | −9,52 | ||||
| 2025-07-30 | 13F | Forum Financial Management, LP | 92 811 | −12,93 | 611 | −6,87 | ||||
| 2025-08-28 | NP | SAMM - Strategas Macro Momentum ETF | 0 | −100,00 | 0 | −100,00 | ||||
| 2025-08-13 | 13F | M&t Bank Corp | 30 734 | −8,13 | 202 | −1,95 | ||||
| 2025-08-12 | 13F | MAI Capital Management | 6 000 | 1 562,05 | 39 | 1 850,00 | ||||
| 2025-08-12 | 13F | Seeds Investor Llc | 15 387 | −12,46 | 101 | −6,48 | ||||
| 2025-06-26 | NP | DFA INVESTMENT DIMENSIONS GROUP INC - International Vector Equity Portfolio Shares | 8 048 | 0,00 | 45 | −15,38 | ||||
| 2025-08-14 | 13F | Vident Advisory, LLC | 293 595 | 16,74 | 1 932 | 24,90 | ||||
| 2025-08-27 | 13F/A | Brinker Capital Investments, LLC | 43 011 | −12,26 | 283 | −5,98 | ||||
| 2025-07-30 | NP | APIE - ActivePassive International Equity ETF | 200 399 | −9,86 | 1 220 | −14,74 | ||||
| 2025-08-14 | 13F | Mercer Global Advisors Inc /adv | 199 496 | −8,55 | 1 313 | −2,16 | ||||
| 2025-05-15 | 13F | Glenmede Trust Co Na | 27 794 | −7,88 | 171 | −2,30 | ||||
| 2025-08-14 | 13F | Hrt Financial Lp | 0 | −100,00 | 0 | |||||
| 2025-07-29 | 13F | Private Trust Co Na | 48 | 0,00 | 0 | |||||
| 2025-08-25 | 13F/A | Neuberger Berman Group LLC | 20 681 | 32,59 | 136 | 43,16 | ||||
| 2025-08-14 | 13F | Raymond James Financial Inc | 182 942 | 3,54 | 1 204 | 10,77 | ||||
| 2025-05-05 | 13F | IFP Advisors, Inc | 0 | −100,00 | 0 | |||||
| 2025-07-30 | 13F | D.a. Davidson & Co. | 18 500 | 2,78 | 122 | 10,00 | ||||
| 2025-08-13 | 13F | First Trust Advisors Lp | 159 150 | −22,50 | 1 047 | −17,04 | ||||
| 2025-07-28 | 13F | Ritholtz Wealth Management | 34 414 | 1,51 | 226 | 8,65 | ||||
| 2025-08-14 | 13F | Smartleaf Asset Management LLC | 38 050 | −16,08 | 251 | −13,15 | ||||
| 2025-07-30 | NP | IAFEX - Fisher Investments Institutional Group All Foreign Equity Environmental and Social Values Fund | 608 | 38,50 | 4 | 50,00 | ||||
| 2025-08-08 | 13F | Avantax Advisory Services, Inc. | 17 288 | −3,67 | 114 | 2,73 | ||||
| 2025-08-07 | 13F | Addison Advisors LLC | 1 618 | 11 | ||||||
| 2025-08-11 | 13F | Dorsey & Whitney Trust CO LLC | 27 357 | −5,15 | 180 | 1,69 | ||||
| 2025-08-14 | 13F | Toroso Investments, LLC | 62 900 | 414 | ||||||
| 2025-05-15 | 13F | Cubist Systematic Strategies, LLC | 0 | −100,00 | 0 | |||||
| 2025-09-04 | 13F/A | Advisor Group Holdings, Inc. | 6 434 | 1 018,96 | 42 | 1 266,67 | ||||
| 2025-08-14 | 13F | Summit Trail Advisors, Llc | 0 | −100,00 | 0 | |||||
| 2025-07-15 | 13F | Maseco Llp | 1 078 | 7 | ||||||
| 2025-05-05 | 13F | Diversify Advisory Services, LLC | 0 | −100,00 | 0 | |||||
| 2025-05-15 | 13F | Gts Securities Llc | 0 | −100,00 | 0 | |||||
| 2025-08-13 | 13F | Jones Financial Companies Lllp | 550 | 4 | ||||||
| 2025-05-08 | 13F | XTX Topco Ltd | 0 | −100,00 | 0 | |||||
| 2025-08-11 | 13F | Private Advisor Group, LLC | 27 206 | −0,93 | 179 | 6,55 | ||||
| 2025-04-21 | 13F | Nelson, Van Denburg & Campbell Wealth Management Group, LLC | 0 | −100,00 | 0 | |||||
| 2025-08-05 | 13F | NewSquare Capital LLC | 4 402 | 288,53 | 29 | 366,67 | ||||
| 2025-08-14 | 13F | D. E. Shaw & Co., Inc. | 1 062 456 | −22,76 | 6 991 | −17,37 | ||||
| 2025-05-15 | 13F | Citadel Advisors Llc | Call | 0 | −100,00 | 0 | ||||
| 2025-08-12 | 13F | Atlas Capital Advisors Llc | 8 081 | −70,93 | 53 | −68,82 | ||||
| 2025-08-14 | 13F | Syon Capital Llc | 28 249 | 186 | ||||||
| 2025-05-15 | 13F | CAPROCK Group, Inc. | 29 871 | −18,89 | 184 | −14,08 | ||||
| 2025-07-24 | 13F | Us Bancorp \de\ | 163 908 | −3,58 | 1 079 | 3,16 | ||||
| 2025-08-07 | 13F | Vise Technologies, Inc. | 10 638 | 70 | ||||||
| 2025-07-25 | 13F | Sequoia Financial Advisors, LLC | 32 188 | −1,99 | 212 | 4,98 | ||||
| 2025-07-23 | 13F | Prime Capital Investment Advisors, LLC | 0 | −100,00 | 0 | |||||
| 2025-08-11 | 13F | Annis Gardner Whiting Capital Advisors, LLC | 403 | 3 | ||||||
| 2025-05-13 | 13F | Cresset Asset Management, LLC | 0 | −100,00 | 0 | |||||
| 2025-06-26 | NP | DFIC - Dimensional International Core Equity 2 ETF | 458 637 | 0,61 | 2 545 | −13,82 | ||||
| 2025-08-14 | 13F | Colony Group, LLC | 43 933 | 94,62 | 289 | 109,42 | ||||
| 2025-08-11 | 13F | HighTower Advisors, LLC | 29 995 | −3,96 | 197 | 2,60 | ||||
| 2025-08-08 | 13F | Cetera Investment Advisers | 12 936 | 28,12 | 85 | 37,10 | ||||
| 2025-06-26 | NP | DFAX - Dimensional World ex U.S. Core Equity 2 ETF | 246 048 | 0,00 | 1 366 | −14,37 | ||||
| 2025-08-12 | 13F | CIBC Private Wealth Group, LLC | 1 | 0,00 | 0 | |||||
| 2025-08-14 | 13F | Wetherby Asset Management Inc | 126 268 | −5,25 | 831 | 7,65 | ||||
| 2025-08-19 | 13F/A | Pitcairn Co | 23 382 | −23,84 | 154 | −18,62 | ||||
| 2025-05-06 | 13F | Y-Intercept (Hong Kong) Ltd | 0 | −100,00 | 0 | −100,00 | ||||
| 2025-08-12 | 13F | Marietta Investment Partners Llc | 140 338 | 8,73 | 923 | 16,39 | ||||
| 2025-08-07 | 13F | Allworth Financial LP | 1 097 | 0,00 | 7 | 16,67 | ||||
| 2025-03-17 | 13F/A | Wealth Enhancement Advisory Services, Llc | 0 | −100,00 | 0 | |||||
| 2025-07-23 | 13F | Abel Hall, LLC | 0 | −100,00 | 0 | |||||
| 2025-08-14 | 13F | Susquehanna International Group, Llp | 0 | −100,00 | 0 | |||||
| 2025-06-26 | NP | DFIEX - International Core Equity Portfolio - Institutional Class This fund is a listed as child fund of Dimensional Fund Advisors Lp and if that institution has disclosed ownership in this security, then these positions will not be double counted when calculating total shares and total value | 122 223 | 0,00 | 678 | −14,39 | ||||
| 2025-08-14 | 13F | Royal Bank Of Canada | 3 613 | −2,38 | 24 | 9,09 | ||||
| 2025-08-04 | 13F | Haven Private, LLC | 15 110 | 99 | ||||||
| 2025-07-29 | 13F | Werba Rubin Papier Wealth Management | 17 488 | −3,67 | 115 | 3,60 | ||||
| 2025-08-07 | 13F | Campbell & CO Investment Adviser LLC | 164 057 | −9,22 | 1 079 | −2,88 | ||||
| 2025-06-26 | NP | DFIV - Dimensional International Value ETF | 879 257 | 0,17 | 4 880 | −14,21 | ||||
| 2025-08-08 | 13F | Larson Financial Group LLC | 949 | 6 | ||||||
| 2025-07-30 | 13F | Journey Advisory Group, LLC | 617 515 | 3,65 | 4 063 | 10,92 | ||||
| 2025-08-05 | 13F | Simplex Trading, Llc | Call | 4 400 | 0 | |||||
| 2025-08-13 | 13F | West Family Investments, Inc. | 21 449 | 0,00 | 141 | 7,63 | ||||
| 2025-07-17 | 13F | HB Wealth Management, LLC | 16 010 | 105 | ||||||
| 2025-08-07 | 13F | Parkside Financial Bank & Trust | 1 312 | 31,46 | 9 | 33,33 | ||||
| 2025-08-14 | 13F | Sei Investments Co | 10 144 | 67 | ||||||
| 2025-07-14 | 13F | Abound Wealth Management | 33 | 0,00 | 0 | |||||
| 2025-07-14 | 13F | GAMMA Investing LLC | 18 033 | 0,62 | 119 | 7,27 | ||||
| 2025-08-14 | 13F | LMR Partners LLP | 0 | −100,00 | 0 | |||||
| 2025-07-24 | 13F | Ronald Blue Trust, Inc. | 17 632 | 14,66 | 116 | 23,40 | ||||
| 2025-08-12 | 13F | BlackRock, Inc. | 3 829 166 | −13,42 | 25 196 | −7,37 | ||||
| 2025-08-11 | 13F | Brown Brothers Harriman & Co | 412 | 3 | ||||||
| 2025-08-12 | 13F | Proequities, Inc. | Put | 0 | 0 | |||||
| 2025-08-12 | 13F | Proequities, Inc. | Call | 0 | 0 | |||||
| 2025-08-12 | 13F | Proequities, Inc. | 0 | 0 | ||||||
| 2025-08-04 | 13F | Capital Performance Advisors Llp | 11 136 | 73 | ||||||
| 2025-07-30 | 13F | Drive Wealth Management, Llc | 31 726 | −2,24 | 209 | 4,52 | ||||
| 2025-07-22 | 13F | Clarius Group, LLC | 11 739 | 77 | ||||||
| 2025-04-09 | 13F | Wallace Advisory Group, LLC | 0 | −100,00 | 0 | |||||
| 2025-08-13 | 13F | Northern Trust Corp | 2 419 553 | 5,98 | 15 921 | 13,39 | ||||
| 2025-07-11 | 13F/A | Umb Bank N A/mo | 1 452 | 0,00 | 10 | 12,50 | ||||
| 2025-08-15 | 13F | Morgan Stanley | 9 166 692 | −6,83 | 60 317 | −0,32 | ||||
| 2025-07-21 | 13F | Cromwell Holdings LLC | 12 467 | 0,00 | 82 | 7,89 | ||||
| 2025-05-01 | 13F | Diversify Wealth Management, Llc | 0 | −100,00 | 0 | |||||
| 2025-08-12 | 13F | Rhumbline Advisers | 96 609 | −0,90 | 636 | 6,01 | ||||
| 2025-07-15 | 13F | Fifth Third Bancorp | 668 | 4 | ||||||
| 2025-08-07 | 13F | Zions Bancorporation, National Association /ut/ | 1 432 | −0,14 | 9 | 12,50 | ||||
| 2025-08-04 | 13F | Simon Quick Advisors, Llc | 28 968 | 48,15 | 191 | 58,33 | ||||
| 2025-08-14 | 13F | Goldman Sachs Group Inc | 4 866 605 | 5,39 | 32 022 | 12,75 | ||||
| 2025-08-12 | 13F | Global Retirement Partners, LLC | 2 222 | −30,06 | 15 | −22,22 | ||||
| 2025-08-06 | 13F | Fox Run Management, L.l.c. | 0 | −100,00 | 0 | |||||
| 2025-07-29 | 13F | Wealthstream Advisors, Inc. | 12 507 | −14,00 | 82 | −7,87 | ||||
| 2025-08-11 | 13F | Principal Securities, Inc. | 2 549 | −20,37 | 17 | −11,11 | ||||
| 2025-05-08 | 13F | Empirical Financial Services, LLC d.b.a. Empirical Wealth Management | 0 | −100,00 | 0 | |||||
| 2025-07-11 | 13F | Pinnacle Bancorp, Inc. | 325 | −59,17 | 2 | −50,00 | ||||
| 2025-05-15 | 13F | Squarepoint Ops LLC | 0 | −100,00 | 0 | |||||
| 2025-08-12 | 13F | SRS Capital Advisors, Inc. | 2 661 | 18 | ||||||
| 2025-05-15 | 13F/A | Orion Portfolio Solutions, LLC | 49 019 | 8,84 | 301 | 15,77 | ||||
| 2025-04-11 | 13F | First Affirmative Financial Network | 22 593 | 9,22 | 139 | 15,97 | ||||
| 2025-07-09 | 13F | Bruce G. Allen Investments, LLC | 5 402 | 1,75 | 36 | 9,38 | ||||
| 2025-08-14 | 13F | Ieq Capital, Llc | 25 448 | 20,71 | 167 | 29,46 | ||||
| 2025-08-13 | 13F | Quadrant Capital Group Llc | 248 314 | −5,91 | 1 634 | 0,62 | ||||
| 2025-08-14 | 13F | Spears Abacus Advisors LLC | 0 | −100,00 | 0 | |||||
| 2025-06-26 | NP | DFA INVESTMENT DIMENSIONS GROUP INC - International Sustainability Core 1 Portfolio Shares | 30 971 | 0,00 | 172 | −14,50 | ||||
| 2025-07-30 | 13F | Ethic Inc. | 980 292 | −6,83 | 6 470 | 0,81 | ||||
| 2025-08-14 | 13F | Mml Investors Services, Llc | 98 251 | 3,86 | 1 | |||||
| 2025-07-30 | NP | ENDW - Cambria Endowment Style ETF | 72 | 0 | ||||||
| 2025-08-14 | 13F | Quantinno Capital Management LP | 779 036 | 49,85 | 5 126 | 60,34 | ||||
| 2025-07-22 | 13F | Checchi Capital Advisers, LLC | 10 759 | 71 | ||||||
| 2025-07-11 | 13F | UMA Financial Services, Inc. | 0 | −100,00 | 0 | |||||
| 2025-08-04 | 13F | Assetmark, Inc | 35 767 | 153,77 | 235 | 173,26 | ||||
| 2025-08-08 | 13F | Pnc Financial Services Group, Inc. | 178 842 | 17,06 | 1 177 | 25,24 | ||||
| 2025-07-16 | 13F | Perigon Wealth Management, LLC | 20 113 | −1,69 | 132 | 5,60 | ||||
| 2025-06-26 | NP | DFAI - Dimensional International Core Equity Market ETF | 694 000 | 0,00 | 3 852 | −14,37 | ||||
| 2025-06-26 | NP | SNTKX - Steward International Enhanced Index Fund Class A | 85 620 | 0,00 | 475 | −14,26 | ||||
| 2025-07-11 | 13F | Diversified Trust Co | 13 773 | −31,00 | 91 | −26,23 | ||||
| 2025-08-27 | NP | FORH - Formidable ETF | 62 900 | 414 | ||||||
| 2025-08-15 | 13F | Captrust Financial Advisors | 26 272 | −12,51 | 173 | −6,52 | ||||
| 2025-07-24 | 13F | Jfs Wealth Advisors, Llc | 2 303 | 9,25 | 15 | 25,00 | ||||
| 2025-06-27 | NP | DFA INVESTMENT DIMENSIONS GROUP INC - International Social Core Equity Portfolio Institutional Class This fund is a listed as child fund of Dimensional Fund Advisors Lp and if that institution has disclosed ownership in this security, then these positions will not be double counted when calculating total shares and total value | 61 247 | 0,00 | 340 | −14,39 | ||||
| 2025-05-15 | 13F | Citadel Advisors Llc | Put | 0 | −100,00 | 0 | ||||
| 2025-08-11 | 13F | GW&K Investment Management, LLC | 578 | −16,35 | 0 | |||||
| 2025-08-14 | 13F | UBS Group AG | 312 716 | 86,08 | 2 058 | 99,13 | ||||
| 2025-08-12 | 13F | Jpmorgan Chase & Co | 172 723 | 40,41 | 1 137 | 50,26 | ||||
| 2025-08-15 | 13F | WealthCollab, LLC | 677 | 203,59 | 4 | 300,00 | ||||
| 2025-08-05 | 13F | Simplex Trading, Llc | Put | 1 900 | 171,43 | 0 | ||||
| 2025-08-07 | 13F | Acadian Asset Management Llc | 63 998 | 37,20 | 0 | |||||
| 2025-07-14 | 13F | Abacus Wealth Partners, LLC | 11 114 | −37,79 | 73 | −33,03 | ||||
| 2025-08-05 | 13F | Simplex Trading, Llc | 0 | −100,00 | 0 | |||||
| 2025-08-14 | 13F | Fmr Llc | 2 168 124 | 16,05 | 14 266 | 24,17 | ||||
| 2025-08-04 | 13F | Syverson Strege & Co | 17 030 | 112 | ||||||
| 2025-07-11 | 13F | Farther Finance Advisors, LLC | 768 | −0,39 | 5 | 25,00 | ||||
| 2025-08-13 | 13F | Renaissance Technologies Llc | 2 211 337 | 12,20 | 14 551 | 20,04 | ||||
| 2025-08-13 | 13F | Fisher Asset Management, LLC | 9 829 802 | 0,34 | 64 680 | 7,35 | ||||
| 2025-08-12 | 13F | Dimensional Fund Advisors Lp | 3 182 173 | −0,11 | 20 939 | 6,88 | ||||
| 2025-07-17 | 13F | Sage Rhino Capital Llc | 18 593 | −3,89 | 122 | 3,39 | ||||
| 2025-08-12 | 13F | Summit Global Investments | 91 593 | 16,89 | 1 | |||||
| 2025-07-30 | 13F | Rnc Capital Management Llc | 57 574 | 13,25 | 379 | 21,15 | ||||
| 2025-05-07 | 13F | LPL Financial LLC | 0 | −100,00 | 0 | |||||
| 2025-08-11 | 13F | Bell Investment Advisors, Inc | 139 | 0,00 | 1 | |||||
| 2025-07-15 | 13F | Td Private Client Wealth Llc | 0 | −100,00 | 0 | |||||
| 2025-08-14 | 13F | Millennium Management Llc | 733 981 | 15,08 | 4 830 | 23,13 | ||||
| 2025-07-24 | 13F | Callan Family Office, LLC | 129 895 | 152,43 | 855 | 170,25 | ||||
| 2025-06-30 | NP | VASVX - Vanguard Selected Value Fund Investor Shares | 5 298 530 | 0,00 | 29 407 | −14,35 | ||||
| 2025-08-08 | 13F | Bailard, Inc. | 0 | −100,00 | 0 | |||||
| 2025-08-11 | 13F | EntryPoint Capital, LLC | 13 562 | −26,97 | 89 | −21,93 | ||||
| 2025-07-17 | 13F | Clean Yield Group | 2 019 | 0,00 | 13 | 8,33 | ||||
| 2025-08-15 | 13F | CI Private Wealth, LLC | 58 028 | 4,87 | 382 | 12,06 | ||||
| 2025-06-25 | NP | GENW - Genter Capital International Dividend ETF | 2 879 | 16 | ||||||
| 2025-08-11 | 13F | Pinnacle Wealth Planning Services, Inc. | 32 099 | −6,06 | 211 | 0,48 | ||||
| 2025-08-14 | 13F | Xponance, Inc. | 19 116 | 1,64 | 126 | 8,70 | ||||
| 2025-08-14 | 13F | Jane Street Group, Llc | 39 896 | −37,20 | 263 | −32,82 | ||||
| 2025-04-17 | 13F | Vista Wealth Management Group, LLC | 12 006 | 18,19 | 74 | 25,86 | ||||
| 2025-07-09 | 13F | Aaron Wealth Advisors LLC | 77 276 | −5,66 | 508 | 0,99 | ||||
| 2025-07-24 | 13F | Lester Murray Antman dba SimplyRich | 72 942 | −31,01 | 0 | |||||
| 2025-08-12 | 13F | Putnam Fl Investment Management Co | 11 386 | 75 | ||||||
| 2025-08-13 | 13F | Townsquare Capital Llc | 0 | −100,00 | 0 | |||||
| 2025-04-29 | 13F | Callan Capital, LLC | 155 985 | 13,16 | 959 | 20,18 | ||||
| 2025-07-16 | 13F | Signaturefd, Llc | 104 136 | −11,28 | 685 | −4,99 | ||||
| 2025-07-17 | 13F | Greenleaf Trust | 19 108 | −6,69 | 126 | 0,00 | ||||
| 2025-08-11 | 13F | Integrated Quantitative Investments LLC | 0 | −100,00 | 0 |
Other Listings
| DE:NSEA | 6,15 € |