Grundläggande statistik
| Institutionella ägare | 184 total, 184 long only, 0 short only, 0 long/short - change of 2,76% MRQ |
| Genomsnittlig portföljallokering | 0.1469 % - change of −0,70% MRQ |
| Institutionella aktier (lång) | 5 883 530 (ex 13D/G) - change of 0,12MM shares 2,11% MRQ |
| Institutionellt värde (lång) | $ 286 125 USD ($1000) |
Institutionellt ägande och aktieägare
iShares Trust - iShares Cybersecurity and Tech ETF (US:IHAK) har 184 Institutionella ägare och aktieägare som har lämnat in 13D/G- eller 13F-formulär till Securities Exchange Commission (SEC). Dessa institut innehar totalt 5,883,530 aktier. Största aktieägare inkluderar Bank Of America Corp /de/, Morgan Stanley, LPL Financial LLC, Wharton Business Group, LLC, UBS Group AG, Advisor Group Holdings, Inc., Ameriprise Financial Inc, Scotia Capital Inc., HighTower Advisors, LLC, and Royal Bank Of Canada .
iShares Trust - iShares Cybersecurity and Tech ETF (ARCA:IHAK) Institutionell ägarstruktur visar institutioners och fonders nuvarande positioner i företaget, samt de senaste förändringarna i positionernas storlek. Större aktieägare kan vara enskilda investerare, fonder, hedgefonder eller institutioner. Bilaga 13D visar att investeraren äger (eller ägde) mer än 5% av företaget och avser (eller avsåg) att aktivt eftersträva en förändring av affärsstrategin. Schedule 13G indikerar en passiv investering på över 5%.
The share price as of September 17, 2025 is 52,10 / share. Previously, on September 18, 2024, the share price was 47,34 / share. This represents an increase of 10,04% over that period.

Fondsentimentets poäng
Fondsentimentet poängen(fka Ägarackumulation-poäng) visar vilka aktier som är mest köpta av fonder. Det är resultatet av en sofistikerad kvantitativ flerfaktormodell som identifierar företag med de högsta nivåerna av institutionell ackumulering. Poängsättningsmodellen använder en kombination av den totala ökningen av redovisade ägare, förändringarna i portföljallokeringarna för dessa ägare och andra mått. Siffran sträcker sig från 0 till 100, där högre siffror indikerar en högre nivå av ackumulering i förhållande till sina konkurrenter, och 50 är genomsnittet.
Uppdateringsfrekvens: Dagligen
Se Ownership Explorer, som innehåller en lista över de högst rankade företagen.
Institutionell sälj/köp-kvot
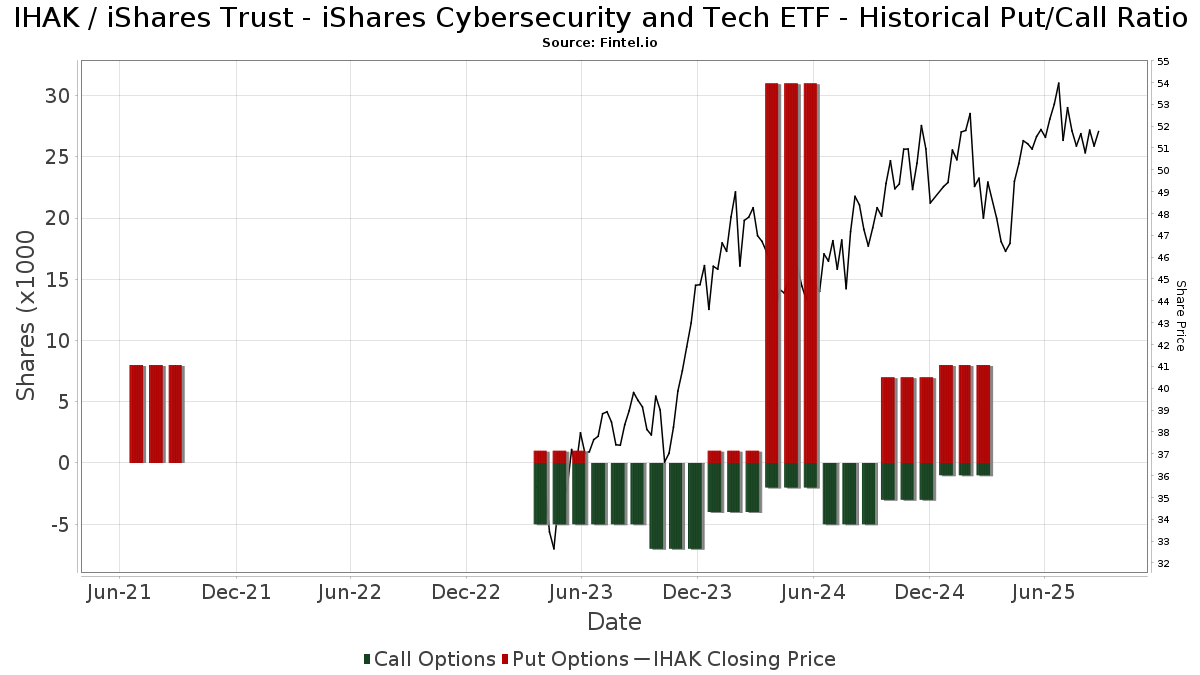
Förutom att rapportera vanliga eget kapital- och skuldemissioner måste institutioner med mer än 100MM tillgångar under förvaltning också avslöja sina innehav av sälj- och köpoptioner. Eftersom säljoptioner i allmänhet indikerar ett negativt sentiment och köpoptioner indikerar ett positivt sentiment, kan vi få en uppfattning om det övergripande institutionella sentimentet genom att plotta förhållandet mellan säljoptioner och köpoptioner. Diagrammet till höger visar det historiska förhållandet mellan sälj- och köpoptioner för detta instrument.
Genom att använda sälj/köp-kvoten som en indikator på aktieägarnas sentiment undviker man en av de största bristerna med att använda det totala institutionella ägandet, nämligen att en betydande del av de förvaltade tillgångarna investeras passivt för att följa index. Passivt förvaltade fonder köper vanligtvis inte optioner, så indikatorn för sälj/köp-kvoten ger en bättre bild av stämningen i aktivt förvaltade fonder.
13F- och NPORT-arkiveringar
Detaljer om 13F-arkiveringar är gratis. Detaljer om NP-arkiveringar kräver ett premiummedlemskap. Gröna rader indikerar nya positioner. Röda rader indikerar stängda positioner. Klicka på länk symbolen för att se hela transaktionshistoriken.
Uppgradera
för att låsa upp premiumdata och exportera till Excel ![]() .
.
| Fil Datum | Källa | Investerare | Typ | Genomsnittligt pris (beräknat) |
Aktier | Δ Aktier (%) |
Rapporterat värde (1000 USD) |
Δ Värde (%) |
Portföljallokering (%) |
|
|---|---|---|---|---|---|---|---|---|---|---|
| 2025-08-05 | 13F | GHP Investment Advisors, Inc. | 175 | 9 | ||||||
| 2025-08-11 | 13F | Blue Bell Private Wealth Management, Llc | 1 970 | −0,56 | 105 | 11,83 | ||||
| 2025-07-24 | 13F | Capital Advisors, Ltd. LLC | 1 752 | 79,69 | 0 | |||||
| 2025-07-17 | 13F | HB Wealth Management, LLC | 0 | −100,00 | 0 | |||||
| 2025-07-28 | 13F | Private Wealth Asset Management, LLC | 555 | 30 | ||||||
| 2025-08-06 | 13F | AE Wealth Management LLC | 9 231 | 527,53 | 491 | 611,59 | ||||
| 2025-08-06 | 13F | Mascagni Wealth Management, Inc. | 4 957 | −11,73 | 264 | 0,00 | ||||
| 2025-08-14 | 13F | Valley Financial Group, Inc. | 7 371 | −1,82 | 392 | 11,36 | ||||
| 2025-08-11 | 13F | Y.D. More Investments Ltd | 2 395 | 2,57 | 127 | 16,51 | ||||
| 2025-08-12 | 13F | Coston, McIsaac & Partners | 539 | 0,00 | 0 | |||||
| 2025-08-13 | 13F | Virtue Capital Management, LLC | 0 | −100,00 | 0 | |||||
| 2025-07-15 | 13F | Cora Capital Advisors Llc | 21 228 | −2,18 | 1 130 | 10,79 | ||||
| 2025-08-14 | 13F | Susquehanna International Group, Llp | 6 469 | −24,30 | 344 | −14,21 | ||||
| 2025-07-16 | 13F | Crowley Wealth Management, Inc. | 300 | 0,00 | 16 | 7,14 | ||||
| 2025-05-08 | 13F | Arkadios Wealth Advisors | 0 | −100,00 | 0 | |||||
| 2025-07-15 | 13F | Bfsg, Llc | 237 | 0,00 | 13 | 9,09 | ||||
| 2025-08-07 | 13F | Allworth Financial LP | 1 026 | −18,44 | 55 | −10,00 | ||||
| 2025-08-14 | 13F | BTG Pactual Asset Management US LLC | 500 | 0,00 | 27 | 13,04 | ||||
| 2025-07-29 | 13F | Chicago Partners Investment Group LLC | 14 467 | −1,36 | 764 | 3,66 | ||||
| 2025-08-01 | 13F | Gwn Securities Inc. | 3 998 | 213 | ||||||
| 2025-08-08 | 13F | Glassman Wealth Services | 22 | 0,00 | 1 | 0,00 | ||||
| 2025-08-14 | 13F | Mml Investors Services, Llc | 19 711 | 6,42 | 1 | |||||
| 2025-08-01 | 13F | Centerpoint Advisors, LLC | 100 | 0,00 | 0 | |||||
| 2025-08-12 | 13F | Accredited Wealth Management, LLC | 0 | −100,00 | 0 | |||||
| 2025-07-24 | 13F | Cyndeo Wealth Partners, LLC | 0 | −100,00 | 0 | |||||
| 2025-08-12 | 13F | AlphaCore Capital LLC | 1 100 | 0,00 | 59 | 13,73 | ||||
| 2025-08-14 | 13F | Connecticut Wealth Management, LLC | 0 | −100,00 | 0 | |||||
| 2025-08-07 | 13F | McClarren Financial Advisors, Inc. | 0 | −100,00 | 0 | |||||
| 2025-08-12 | 13F | Global Retirement Partners, LLC | 14 214 | −8,49 | 756 | −0,13 | ||||
| 2025-05-13 | 13F | Watts Gwilliam & Co., LLC | 44 978 | 0,66 | 2 113 | −3,56 | ||||
| 2025-05-15 | 13F | Marshall Wace, Llp | 0 | −100,00 | 0 | |||||
| 2025-08-12 | 13F | MAI Capital Management | 382 | 0,26 | 20 | 17,65 | ||||
| 2025-08-01 | 13F | Envestnet Asset Management Inc | 9 075 | 51,48 | 483 | 71,53 | ||||
| 2025-08-12 | 13F | Steward Partners Investment Advisory, Llc | 31 653 | 3,63 | 1 684 | 17,35 | ||||
| 2025-05-09 | 13F | Fairfield Financial Advisors, LTD | 0 | −100,00 | 0 | |||||
| 2025-07-23 | 13F | Valmark Advisers, Inc. | 3 780 | 201 | ||||||
| 2025-07-31 | 13F | Rational Advisors Llc | 7 816 | −9,94 | 416 | 1,97 | ||||
| 2025-08-13 | 13F | Providence Capital Advisors, LLC | 386 | 21 | ||||||
| 2025-08-07 | 13F | Fountainhead AM, LLC | 7 469 | −4,27 | 397 | 8,47 | ||||
| 2025-08-14 | 13F | Qube Research & Technologies Ltd | 838 | 45 | ||||||
| 2025-08-05 | 13F | Carolinas Wealth Consulting Llc | 0 | −100,00 | 0 | |||||
| 2025-07-29 | 13F | Portland Financial Advisors Inc | 6 105 | 0,41 | 325 | 13,68 | ||||
| 2025-08-14 | 13F | Mariner, LLC | 29 486 | 7,90 | 1 569 | 22,21 | ||||
| 2025-07-25 | 13F | Retirement Planning Group, Llc / Ny | 3 921 | 209 | ||||||
| 2025-05-02 | 13F | Apollon Wealth Management, LLC | 0 | −100,00 | 0 | |||||
| 2025-05-15 | 13F | IHT Wealth Management, LLC | 0 | −100,00 | 0 | |||||
| 2025-07-14 | 13F | Sowell Financial Services LLC | 5 073 | −1,17 | 270 | 11,62 | ||||
| 2025-08-14 | 13F | Wharton Business Group, LLC | 318 135 | −0,08 | 17 | 14,29 | ||||
| 2025-08-12 | 13F | Franklin Resources Inc | 7 381 | 0,01 | 393 | 13,29 | ||||
| 2025-05-12 | 13F | Sandy Spring Bank | 2 497 | 117 | ||||||
| 2025-08-11 | 13F | ICICI Prudential Asset Management Co Ltd | 6 480 | 0,00 | 345 | 13,91 | ||||
| 2025-08-12 | 13F | LPL Financial LLC | 341 669 | 7,39 | 18 180 | 21,64 | ||||
| 2025-08-13 | 13F | Brentview Investment Management LLC | 500 | 0,00 | 27 | 13,04 | ||||
| 2025-08-14 | 13F | Stifel Financial Corp | 52 638 | 3,39 | 2 801 | 17,11 | ||||
| 2025-07-16 | 13F | Signature Resources Capital Management, LLC | 389 | 21 | ||||||
| 2025-08-12 | 13F | Minot DeBlois Advisors LLC | 115 | 0,00 | 6 | 20,00 | ||||
| 2025-04-23 | 13F | Gimbal Financial | 0 | −100,00 | 0 | |||||
| 2025-08-05 | 13F | Bank Of Montreal /can/ | 43 786 | 0,37 | 2 330 | 13,67 | ||||
| 2025-08-05 | 13F | Huntington National Bank | 50 | −39,02 | ||||||
| 2025-08-14 | 13F | Citadel Advisors Llc | 0 | −100,00 | 0 | |||||
| 2025-08-14 | 13F | Citadel Advisors Llc | Call | 0 | −100,00 | 0 | ||||
| 2025-08-11 | 13F | HighTower Advisors, LLC | 129 798 | 2,74 | 6 907 | 16,36 | ||||
| 2025-08-13 | 13F | Kilter Group LLC | 0 | 0 | ||||||
| 2025-08-14 | 13F | Comerica Bank | 11 029 | 1,93 | 587 | 15,35 | ||||
| 2025-08-13 | 13F | Capital Analysts, Inc. | 0 | −100,00 | 0 | |||||
| 2025-08-14 | 13F | Sunbelt Securities, Inc. | 3 542 | 26,50 | 173 | 31,30 | ||||
| 2025-07-25 | 13F | NorthRock Partners, LLC | 147 | 0,00 | 8 | 16,67 | ||||
| 2025-08-14 | 13F/A | Barclays Plc | 741 | −61,82 | 0 | |||||
| 2025-08-08 | 13F | Hartland & Co., LLC | 1 137 | 0,00 | 60 | 13,21 | ||||
| 2025-07-31 | 13F | Cambridge Investment Research Advisors, Inc. | 28 424 | 3,14 | 2 | 0,00 | ||||
| 2025-04-28 | 13F | Buffington Mohr McNeal | 0 | −100,00 | 0 | |||||
| 2025-08-12 | 13F | Titleist Asset Management, Llc | 12 005 | 2,13 | 639 | 15,58 | ||||
| 2025-08-06 | 13F | Csenge Advisory Group | 35 374 | −0,42 | 1 804 | 9,87 | ||||
| 2025-08-13 | 13F | Baird Financial Group, Inc. | 51 752 | 49,71 | 2 754 | 69,52 | ||||
| 2025-08-12 | 13F | Richard W. Paul & Associates, LLC | 182 | 5,20 | 10 | 12,50 | ||||
| 2025-04-21 | 13F | Nelson, Van Denburg & Campbell Wealth Management Group, LLC | 0 | −100,00 | 0 | |||||
| 2025-07-15 | 13F | Mather Group, Llc. | 0 | −100,00 | 0 | |||||
| 2025-08-08 | 13F | Smithfield Trust Co | 485 | 0,00 | 0 | |||||
| 2025-07-21 | 13F | Warner Financial, Inc | 6 747 | −19,34 | 0 | |||||
| 2025-07-25 | 13F | Cwm, Llc | 13 577 | −0,21 | 1 | |||||
| 2025-08-08 | 13F | Creative Planning | 18 292 | −2,03 | 973 | 10,95 | ||||
| 2025-08-08 | 13F | Pnc Financial Services Group, Inc. | 2 174 | −58,44 | 116 | −53,06 | ||||
| 2025-07-23 | 13F | Detalus Advisors, LLC | 4 351 | −3,61 | 232 | 8,96 | ||||
| 2025-08-06 | 13F | Wedbush Securities Inc | 0 | −100,00 | 0 | |||||
| 2025-07-25 | 13F | Stonehage Fleming Financial Services Holdings Ltd | 15 000 | 0,00 | 798 | 13,35 | ||||
| 2025-08-13 | 13F | WCG Wealth Advisors LLC | 21 871 | −3,74 | 1 164 | 9,00 | ||||
| 2025-09-04 | 13F/A | Advisor Group Holdings, Inc. | 146 412 | 189,44 | 7 793 | 227,67 | ||||
| 2025-08-14 | 13F | Integrated Wealth Concepts LLC | 6 085 | 0,00 | 324 | 13,33 | ||||
| 2025-07-29 | NP | EBI - Longview Advantage ETF | 0 | −100,00 | 0 | −100,00 | ||||
| 2025-07-11 | 13F | SILVER OAK SECURITIES, Inc | 8 533 | 5,25 | 454 | 17,62 | ||||
| 2025-08-05 | 13F | C2P Capital Advisory Group, LLC d.b.a. Prosperity Capital Advisors | 8 331 | 22,53 | 443 | 37,58 | ||||
| 2025-08-15 | 13F | Morgan Stanley | 430 947 | −8,73 | 22 931 | 3,37 | ||||
| 2025-07-24 | 13F | Us Bancorp \de\ | 3 228 | 1 334,67 | 172 | 1 610,00 | ||||
| 2025-08-08 | 13F | Larson Financial Group LLC | 93 | 0,00 | 5 | 0,00 | ||||
| 2025-08-08 | 13F | Intrua Financial, LLC | 22 481 | 3,76 | 1 196 | 17,60 | ||||
| 2025-07-17 | 13F | Janney Montgomery Scott LLC | 4 708 | 0 | ||||||
| 2025-07-11 | 13F | Farther Finance Advisors, LLC | 2 378 | 23,34 | 127 | 38,46 | ||||
| 2025-08-11 | 13F/A | Purus Wealth Management, LLC | 6 436 | −0,69 | 342 | 12,50 | ||||
| 2025-08-14 | 13F | Raymond James Financial Inc | 46 182 | 0,64 | 2 457 | 14,01 | ||||
| 2025-08-11 | 13F | VSM Wealth Advisory, LLC | 74 | 0,00 | 4 | 0,00 | ||||
| 2025-07-23 | 13F | West Paces Advisors Inc. | 0 | −100,00 | 0 | |||||
| 2025-08-13 | 13F | Northwestern Mutual Wealth Management Co | 10 823 | 16,85 | 576 | 32,18 | ||||
| 2025-08-14 | 13F | Visionary Wealth Advisors | 15 898 | 4,16 | 846 | 17,85 | ||||
| 2025-08-12 | 13F | O'shaughnessy Asset Management, Llc | 1 | 0,00 | 0 | |||||
| 2025-07-18 | 13F | PFG Investments, LLC | 3 845 | 205 | ||||||
| 2025-08-14 | 13F | Ieq Capital, Llc | 9 411 | 5,98 | 501 | 19,90 | ||||
| 2025-05-12 | 13F | Independent Advisor Alliance | 0 | −100,00 | 0 | |||||
| 2025-08-13 | 13F | Northern Trust Corp | 5 478 | 2,72 | 291 | 16,40 | ||||
| 2025-07-09 | 13F | Bulwark Capital Corp | 11 976 | 637 | ||||||
| 2025-08-15 | 13F | Provenance Wealth Advisors, LLC | 342 | 0,00 | 18 | 12,50 | ||||
| 2025-05-12 | 13F | Kohmann Bosshard Financial Services, LLC | 0 | −100,00 | 0 | |||||
| 2025-08-08 | 13F | Cetera Investment Advisers | 24 405 | 0,33 | 1 299 | 13,66 | ||||
| 2025-05-15 | 13F | Talon Private Wealth, LLC | 0 | −100,00 | 0 | −100,00 | ||||
| 2025-07-28 | 13F | Mowery & Schoenfeld Wealth Management, LLC | 109 | 0,00 | 6 | 0,00 | ||||
| 2025-08-13 | 13F | Crosspoint Financial, Llc | 52 181 | 2,44 | 2 777 | 16,01 | ||||
| 2025-08-06 | 13F/A | Flagship Private Wealth, LLC | 4 161 | 221 | ||||||
| 2025-08-08 | 13F | Avantax Advisory Services, Inc. | 29 474 | 513,28 | 1 568 | 596,89 | ||||
| 2025-07-07 | 13F | Roxbury Financial LLC | 1 810 | −5,14 | 96 | 4,35 | ||||
| 2025-07-17 | 13F | Halbert Hargrove Global Advisors, Llc | 0 | −100,00 | 0 | |||||
| 2025-04-29 | 13F | Lee Danner & Bass Inc | 0 | −100,00 | 0 | −100,00 | ||||
| 2025-08-11 | 13F | Retirement Capital Strategies | 6 015 | 0,00 | 320 | 13,48 | ||||
| 2025-08-04 | 13F | Spire Wealth Management | 32 184 | 1,38 | 1 713 | 14,82 | ||||
| 2025-08-26 | NP | USAF - Atlas America Fund | 4 421 | 235 | ||||||
| 2025-08-13 | 13F | Scotia Capital Inc. | 135 726 | 2 704,84 | 7 222 | 3 081,06 | ||||
| 2025-07-21 | 13F | Ameritas Advisory Services, LLC | 753 | 40 | ||||||
| 2025-07-23 | 13F | Clear Creek Financial Management, LLC | 4 332 | 0,56 | 231 | 13,86 | ||||
| 2025-07-31 | 13F | City State Bank | 7 899 | −7,98 | 420 | 4,22 | ||||
| 2025-08-12 | 13F | Forum Private Client Group LLC | 4 504 | 0,00 | 240 | 13,27 | ||||
| 2025-05-19 | 13F | Heck Capital Advisors, LLC | 0 | −100,00 | 0 | −100,00 | ||||
| 2025-08-14 | 13F/A | Rockefeller Capital Management L.P. | 10 268 | 0,97 | 546 | 14,47 | ||||
| 2025-07-28 | 13F | Harbour Investments, Inc. | 2 065 | 30,45 | 110 | 47,30 | ||||
| 2025-08-04 | 13F | Creative Financial Designs Inc /adv | 251 | 0,40 | 13 | 18,18 | ||||
| 2025-07-07 | 13F | Centurion Wealth Management LLC | 88 568 | 22,26 | 4 713 | 33,33 | ||||
| 2025-08-14 | 13F | Jane Street Group, Llc | 0 | −100,00 | 0 | |||||
| 2025-07-28 | 13F | Moran Wealth Management, LLC | 11 011 | 84,53 | 586 | 108,93 | ||||
| 2025-08-11 | 13F | Private Advisor Group, LLC | 9 127 | 46,50 | 486 | 66,10 | ||||
| 2025-08-12 | 13F | CIBC Private Wealth Group, LLC | 12 | 1 | ||||||
| 2025-04-23 | 13F | Consolidated Portfolio Review Corp | 0 | −100,00 | 0 | |||||
| 2025-07-22 | 13F | Mascoma Wealth Management LLC | 830 | 0,00 | 44 | 15,79 | ||||
| 2025-08-14 | 13F | Federation des caisses Desjardins du Quebec | 3 438 | 2,50 | 183 | 15,92 | ||||
| 2025-08-14 | 13F | Ameriprise Financial Inc | 141 667 | 4,09 | 7 534 | 17,81 | ||||
| 2025-08-29 | 13F | Centaurus Financial, Inc. | 8 645 | −6,20 | 0 | |||||
| 2025-07-08 | 13F | Nbc Securities, Inc. | 309 | 0,00 | 0 | |||||
| 2025-08-14 | 13F | Royal Bank Of Canada | 127 180 | 14,52 | 6 768 | 29,70 | ||||
| 2025-08-05 | 13F | Mountain Hill Investment Partners Corp. | 0 | −100,00 | 0 | |||||
| 2025-07-17 | 13F | Fifth Third Securities, Inc. | 4 855 | 9,22 | 258 | 24,04 | ||||
| 2025-07-22 | 13F | Wealthcare Advisory Partners LLC | 29 430 | 48,66 | 1 566 | 68,28 | ||||
| 2025-08-13 | 13F | Brown Advisory Inc | 4 067 | 216 | ||||||
| 2025-08-14 | 13F | Citadel Advisors Llc | Put | 0 | −100,00 | 0 | ||||
| 2025-07-28 | 13F | BRYN MAWR TRUST Co | 150 | 0,00 | 8 | 0,00 | ||||
| 2025-08-11 | 13F | TD Waterhouse Canada Inc. | 85 | 4 | ||||||
| 2025-08-08 | 13F | POM Investment Strategies, LLC | 221 | 12 | ||||||
| 2025-07-22 | 13F | Penobscot Investment Management Company, Inc. | 9 508 | 0,00 | 506 | 13,23 | ||||
| 2025-08-13 | 13F | Mount Yale Investment Advisors, LLC | 70 | 4 | ||||||
| 2025-07-24 | 13F | IFP Advisors, Inc | 1 919 | −0,10 | 102 | 13,33 | ||||
| 2025-08-13 | 13F | Financial Freedom, LLC | 1 635 | 0,00 | 87 | 13,16 | ||||
| 2025-08-12 | 13F | Proequities, Inc. | 0 | 0 | ||||||
| 2025-07-09 | 13F | Triumph Capital Management | 0 | −100,00 | 0 | −100,00 | ||||
| 2025-07-25 | 13F | Ellis Investment Partners, LLC | 14 944 | 1,50 | 795 | 15,05 | ||||
| 2025-08-15 | 13F | Sugar Maple Asset Management, LLC | 6 043 | 322 | ||||||
| 2025-08-13 | 13F | Lido Advisors, LLC | 32 966 | −30,33 | 1 754 | −21,10 | ||||
| 2025-08-04 | 13F | Pensionmark Financial Group, Llc | 5 749 | 0,44 | 306 | 13,81 | ||||
| 2025-07-18 | 13F | Naples Global Advisors, Llc | 15 460 | 0,98 | 823 | 14,33 | ||||
| 2025-08-13 | 13F | Mackenzie Financial Corp | 5 750 | −6,35 | 306 | 5,90 | ||||
| 2025-08-13 | 13F | Flow Traders U.s. Llc | 5 082 | 0 | ||||||
| 2025-09-02 | 13F | Pvg Asset Management Corp | 7 804 | 415 | ||||||
| 2025-08-14 | 13F | Fmr Llc | 2 295 | −26,21 | 122 | −16,44 | ||||
| 2025-08-15 | 13F | Kestra Advisory Services, LLC | 14 496 | 135,17 | 771 | 166,78 | ||||
| 2025-08-05 | 13F | Simplex Trading, Llc | 270 | 0 | ||||||
| 2025-07-29 | 13F | Private Trust Co Na | 389 | 0,00 | 21 | 11,11 | ||||
| 2025-08-14 | 13F | Gould Capital, LLC | 129 | 2,38 | 7 | 20,00 | ||||
| 2025-08-27 | NP | HDCAX - Rational Equity Armor Fund Class A Shares | 7 816 | −9,94 | 416 | 1,97 | ||||
| 2025-08-14 | 13F | Goldman Sachs Group Inc | 55 144 | 4,93 | 2 934 | 18,88 | ||||
| 2025-08-06 | 13F | Mark Sheptoff Financial Planning, Llc | 28 041 | −1,23 | 1 492 | 11,93 | ||||
| 2025-08-04 | 13F | Assetmark, Inc | 39 | −29,09 | 2 | 0,00 | ||||
| 2025-08-14 | 13F | UBS Group AG | 305 246 | −4,52 | 16 242 | 8,14 | ||||
| 2025-07-16 | 13F | Rainier Family Wealth Inc | 17 896 | 952 | ||||||
| 2025-07-25 | 13F | LRI Investments, LLC | 3 900 | 0,00 | 208 | 13,11 | ||||
| 2025-07-09 | 13F | Krilogy Financial LLC | 33 169 | 7,51 | 1 765 | 21,74 | ||||
| 2025-08-06 | 13F | First Horizon Advisors, Inc. | 1 751 | −0,11 | 93 | 13,41 | ||||
| 2025-07-09 | 13F | Bank of New Hampshire | 200 | 0,00 | 11 | 11,11 | ||||
| 2025-08-14 | 13F | Arete Wealth Advisors, LLC | 0 | −100,00 | 0 | |||||
| 2025-08-19 | 13F | Anchor Investment Management, LLC | 1 970 | 6,78 | 105 | 20,93 | ||||
| 2025-08-15 | 13F | Northeast Financial Consultants Inc | 25 400 | 0,00 | 1 352 | 13,24 | ||||
| 2025-08-14 | 13F | Bnp Paribas | 10 387 | 6,46 | 553 | 20,52 | ||||
| 2025-04-30 | 13F | Phillips Financial Management, Llc | 0 | −100,00 | 0 | |||||
| 2025-08-08 | 13F | TD Capital Management LLC | 206 | 0,00 | 11 | 11,11 | ||||
| 2025-08-07 | 13F | Parkside Financial Bank & Trust | 8 | 0,00 | 0 | |||||
| 2025-08-13 | 13F | PineBridge Investments, L.P. | 18 120 | −14,03 | 964 | −2,63 | ||||
| 2025-08-14 | 13F | Wells Fargo & Company/mn | 1 | −99,88 | 0 | −100,00 | ||||
| 2025-07-29 | 13F | Koa Wealth Management, LLC | 26 804 | −1,17 | 1 426 | 11,93 | ||||
| 2025-07-23 | 13F | Nelson Capital Management, LLC | 89 866 | 2,12 | 4 782 | 15,65 | ||||
| 2025-08-04 | 13F | Integrity Alliance, Llc. | 4 330 | −3,78 | 230 | 9,00 | ||||
| 2025-07-10 | 13F | Wealth Enhancement Advisory Services, Llc | 8 763 | 25,19 | 471 | 43,60 | ||||
| 2025-05-08 | 13F | IFG Advisory, LLC | 0 | −100,00 | 0 | |||||
| 2025-08-14 | 13F | Riggs Asset Managment Co. Inc. | 756 | 0,00 | 40 | 14,29 | ||||
| 2025-07-21 | 13F | Future Financial Wealth Managment LLC | 100 | 0,00 | 5 | 25,00 | ||||
| 2025-08-18 | 13F | Geneos Wealth Management Inc. | 152 | 0,00 | 8 | 14,29 | ||||
| 2025-08-14 | 13F | Aprio Wealth Management, LLC | 52 309 | −25,87 | 2 783 | −16,05 | ||||
| 2025-08-12 | 13F | PSI Advisors, LLC | 0 | −100,00 | 0 | |||||
| 2025-08-14 | 13F | 10Elms LLP | 3 200 | 0,00 | 170 | 13,33 | ||||
| 2025-08-14 | 13F | Pecaut & Co. | 4 580 | −1,25 | 244 | 11,98 | ||||
| 2025-07-08 | 13F | Parallel Advisors, LLC | 77 | 2,67 | 4 | 33,33 | ||||
| 2025-05-27 | 13F | Advisors Capital Management, LLC | 0 | −100,00 | 0 | |||||
| 2025-08-06 | 13F | Commonwealth Equity Services, Llc | 87 372 | −6,28 | 5 | 0,00 | ||||
| 2025-08-05 | 13F | GPS Wealth Strategies Group, LLC | 4 926 | −0,30 | 262 | 12,93 | ||||
| 2025-09-12 | 13F/A | Valeo Financial Advisors, LLC | 3 928 | 209 | ||||||
| 2025-07-15 | 13F | BostonPremier Wealth LLC | 4 370 | −93,86 | 233 | −93,06 | ||||
| 2025-07-18 | 13F | SOA Wealth Advisors, LLC. | 125 | 0,00 | 7 | 20,00 | ||||
| 2025-08-13 | 13F | Crescent Grove Advisors, LLC | 32 138 | 0,00 | 1 710 | 13,32 | ||||
| 2025-08-01 | 13F | Petra Financial Advisors Inc | 28 215 | 62,42 | 1 501 | 83,95 | ||||
| 2025-07-30 | 13F | Evermay Wealth Management Llc | 300 | 0,00 | 16 | 7,14 | ||||
| 2025-07-23 | 13F | 1 North Wealth Services Llc | 42 171 | 0,16 | 2 244 | 13,45 | ||||
| 2025-08-08 | 13F | Capital Investment Advisory Services, LLC | 200 | −76,19 | 11 | −74,36 | ||||
| 2025-08-14 | 13F | GWM Advisors LLC | 9 305 | 11,87 | 495 | 26,92 | ||||
| 2025-08-14 | 13F | Old Mission Capital Llc | 24 202 | −0,47 | 1 288 | 12,70 | ||||
| 2025-07-15 | 13F | North Star Investment Management Corp. | 1 120 | 1 020,00 | 60 | 1 375,00 | ||||
| 2025-07-18 | 13F | Truist Financial Corp | 14 073 | 9,64 | 749 | 24,05 | ||||
| 2025-08-12 | 13F | Wood Tarver Financial Group, LLC | 60 | 0,00 | 0 | −100,00 | ||||
| 2025-08-11 | 13F | Principal Securities, Inc. | 4 669 | −5,26 | 248 | 3,33 | ||||
| 2025-08-12 | 13F | Jpmorgan Chase & Co | 73 | 4,29 | 4 | 0,00 | ||||
| 2025-07-10 | 13F | Peoples Bank/KS | 0 | −100,00 | 0 | |||||
| 2025-08-14 | 13F | CoreCap Advisors, LLC | 47 | 0,00 | 3 | 0,00 | ||||
| 2025-05-15 | 13F | Hilltop Holdings Inc. | 0 | −100,00 | 0 | |||||
| 2025-08-14 | 13F | Bank Of America Corp /de/ | 1 831 781 | 0,74 | 97 469 | 14,10 | ||||
| 2025-08-13 | 13F | Solutions 4 Wealth, Ltd | 21 932 | 0,00 | 1 167 | 13,30 | ||||
| 2025-08-13 | 13F | Jones Financial Companies Lllp | 60 471 | 32,69 | 3 163 | 45,58 |