Grundläggande statistik
| Institutionella ägare | 145 total, 145 long only, 0 short only, 0 long/short - change of 62,92% MRQ |
| Genomsnittlig portföljallokering | 0.5301 % - change of 60,41% MRQ |
| Institutionella aktier (lång) | 12 652 138 (ex 13D/G) - change of 6,92MM shares 120,67% MRQ |
| Institutionellt värde (lång) | $ 568 677 USD ($1000) |
Institutionellt ägande och aktieägare
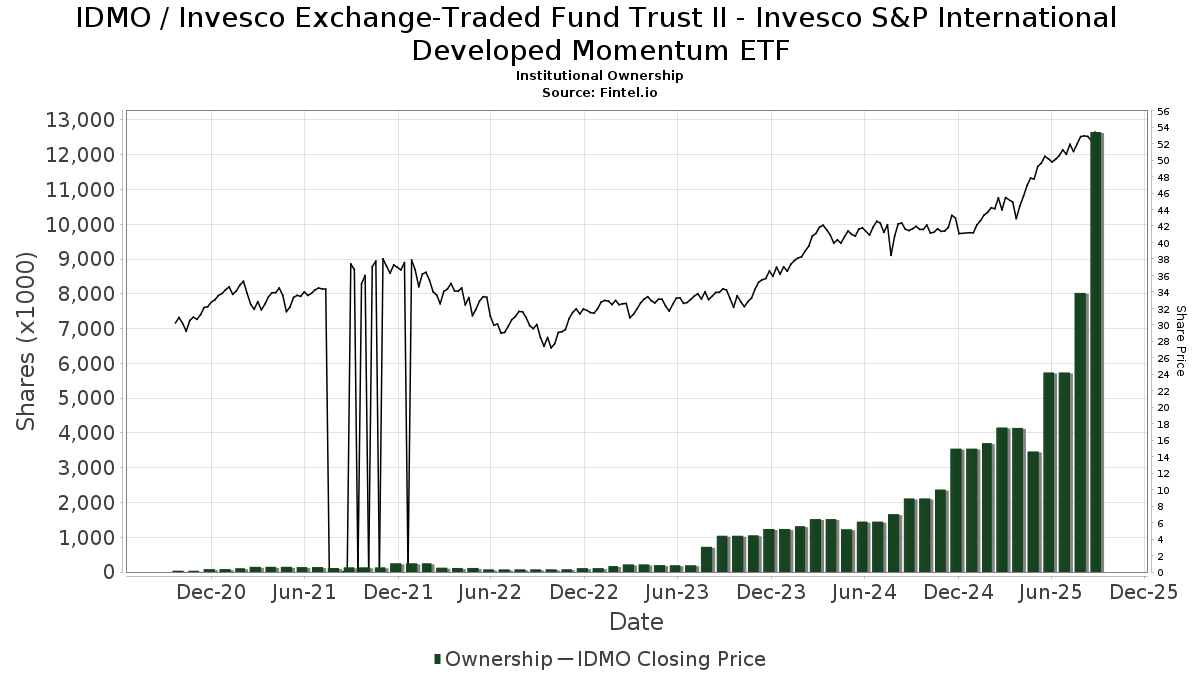
Invesco Exchange-Traded Fund Trust II - Invesco S&P International Developed Momentum ETF (US:IDMO) har 145 Institutionella ägare och aktieägare som har lämnat in 13D/G- eller 13F-formulär till Securities Exchange Commission (SEC). Dessa institut innehar totalt 12,652,138 aktier. Största aktieägare inkluderar LPL Financial LLC, Northwestern Mutual Wealth Management Co, Jane Street Group, Llc, Great Valley Advisor Group, Inc., Equitable Holdings, Inc., Mml Investors Services, Llc, McIlrath & Eck, LLC, Envestnet Asset Management Inc, Cwm, Llc, and Drake & Associates, LLC .
Invesco Exchange-Traded Fund Trust II - Invesco S&P International Developed Momentum ETF (ARCA:IDMO) Institutionell ägarstruktur visar institutioners och fonders nuvarande positioner i företaget, samt de senaste förändringarna i positionernas storlek. Större aktieägare kan vara enskilda investerare, fonder, hedgefonder eller institutioner. Bilaga 13D visar att investeraren äger (eller ägde) mer än 5% av företaget och avser (eller avsåg) att aktivt eftersträva en förändring av affärsstrategin. Schedule 13G indikerar en passiv investering på över 5%.
The share price as of September 12, 2025 is 53,75 / share. Previously, on September 16, 2024, the share price was 42,44 / share. This represents an increase of 26,65% over that period.
Fondsentimentets poäng
Fondsentimentet poängen(fka Ägarackumulation-poäng) visar vilka aktier som är mest köpta av fonder. Det är resultatet av en sofistikerad kvantitativ flerfaktormodell som identifierar företag med de högsta nivåerna av institutionell ackumulering. Poängsättningsmodellen använder en kombination av den totala ökningen av redovisade ägare, förändringarna i portföljallokeringarna för dessa ägare och andra mått. Siffran sträcker sig från 0 till 100, där högre siffror indikerar en högre nivå av ackumulering i förhållande till sina konkurrenter, och 50 är genomsnittet.
Uppdateringsfrekvens: Dagligen
Se Ownership Explorer, som innehåller en lista över de högst rankade företagen.
Institutionell sälj/köp-kvot
Förutom att rapportera vanliga eget kapital- och skuldemissioner måste institutioner med mer än 100MM tillgångar under förvaltning också avslöja sina innehav av sälj- och köpoptioner. Eftersom säljoptioner i allmänhet indikerar ett negativt sentiment och köpoptioner indikerar ett positivt sentiment, kan vi få en uppfattning om det övergripande institutionella sentimentet genom att plotta förhållandet mellan säljoptioner och köpoptioner. Diagrammet till höger visar det historiska förhållandet mellan sälj- och köpoptioner för detta instrument.
Genom att använda sälj/köp-kvoten som en indikator på aktieägarnas sentiment undviker man en av de största bristerna med att använda det totala institutionella ägandet, nämligen att en betydande del av de förvaltade tillgångarna investeras passivt för att följa index. Passivt förvaltade fonder köper vanligtvis inte optioner, så indikatorn för sälj/köp-kvoten ger en bättre bild av stämningen i aktivt förvaltade fonder.
13F- och NPORT-arkiveringar
Detaljer om 13F-arkiveringar är gratis. Detaljer om NP-arkiveringar kräver ett premiummedlemskap. Gröna rader indikerar nya positioner. Röda rader indikerar stängda positioner. Klicka på länk symbolen för att se hela transaktionshistoriken.
Uppgradera
för att låsa upp premiumdata och exportera till Excel ![]() .
.
| Fil Datum | Källa | Investerare | Typ | Genomsnittligt pris (beräknat) |
Aktier | Δ Aktier (%) |
Rapporterat värde (1000 USD) |
Δ Värde (%) |
Portföljallokering (%) |
|
|---|---|---|---|---|---|---|---|---|---|---|
| 2025-08-05 | 13F | Harel Insurance Investments & Financial Services Ltd. | 2 000 | 104,08 | 0 | |||||
| 2025-08-12 | 13F | Jpmorgan Chase & Co | 150 | 8 | ||||||
| 2025-07-18 | 13F | Truist Financial Corp | 7 928 | 31,61 | 406 | 52,63 | ||||
| 2025-07-23 | 13F | Capstone Wealth Management Group, Llc | 0 | −100,00 | 0 | |||||
| 2025-07-23 | 13F | Clear Creek Financial Management, LLC | 63 998 | 3 279 | ||||||
| 2025-08-11 | 13F | Western Wealth Management, LLC | 96 273 | 1 241,78 | 4 933 | 1 461,08 | ||||
| 2025-08-12 | 13F | Steward Partners Investment Advisory, Llc | 23 124 | 90,01 | 1 185 | 120,48 | ||||
| 2025-08-13 | 13F | Continuum Advisory, LLC | 5 286 | 271 | ||||||
| 2025-08-14 | 13F | Wiley Bros.-aintree Capital, Llc | 15 456 | 839 | ||||||
| 2025-08-14 | 13F | Operose Advisors LLC | 5 306 | −0,02 | 272 | 15,81 | ||||
| 2025-04-10 | 13F | Retireful, LLC | 0 | −100,00 | 0 | |||||
| 2025-08-14 | 13F | GWM Advisors LLC | 27 692 | 1 419 | ||||||
| 2025-08-12 | 13F | Solano Wealth Investment Advisors LLC | 4 821 | 247 | ||||||
| 2025-07-21 | 13F | Ameritas Advisory Services, LLC | 29 558 | 1 515 | ||||||
| 2025-08-13 | 13F | Valued Retirements, Inc. | 13 875 | 191,19 | 711 | 238,10 | ||||
| 2025-07-07 | 13F | TruWealth Advisors, LLC | 7 657 | 392 | ||||||
| 2025-07-16 | 13F | ORG Wealth Partners, LLC | 705 | 0,00 | 36 | 12,90 | ||||
| 2025-08-12 | 13F | Change Path, LLC | 17 029 | −1,22 | 873 | 14,59 | ||||
| 2025-08-14 | 13F | Mml Investors Services, Llc | 370 591 | 131,53 | 19 | 157,14 | ||||
| 2025-07-17 | 13F | Janney Montgomery Scott LLC | 42 970 | 77,50 | 2 | 100,00 | ||||
| 2025-04-28 | 13F | Sterling Group Wealth Management, LLC | 0 | −100,00 | 0 | |||||
| 2025-08-04 | 13F | Assetmark, Inc | 131 | 7 | ||||||
| 2025-08-14 | 13F | Ausdal Financial Partners, Inc. | 7 133 | 366 | ||||||
| 2025-07-25 | 13F | Apollon Wealth Management, LLC | 14 945 | 766 | ||||||
| 2025-08-08 | 13F | Thoroughbred Financial Services, Llc | 31 570 | 251,44 | 2 | |||||
| 2025-08-19 | 13F | Newbridge Financial Services Group, Inc. | 19 | 0,00 | 1 | |||||
| 2025-07-22 | 13F | Kraematon Investment Advisors, Inc | 14 201 | 728 | ||||||
| 2025-07-28 | 13F | Harbour Investments, Inc. | 110 958 | 294,28 | 5 685 | 357,73 | ||||
| 2025-08-26 | NP | EVTTX - The E-Valuator Conservative/Moderate (30%-50%) RMS Fund Service Class Shares | 5 451 | 27,24 | 279 | 47,62 | ||||
| 2025-08-14 | 13F | Raymond James Financial Inc | 224 078 | 65,85 | 11 482 | 92,44 | ||||
| 2025-08-06 | 13F | Commonwealth Equity Services, Llc | 154 681 | 426,22 | 8 | 600,00 | ||||
| 2025-08-14 | 13F | Royal Bank Of Canada | 29 147 | 1 494 | ||||||
| 2025-08-26 | NP | EVVLX - The E-Valuator Very Conservative (0%-15%) RMS Fund Service Class Shares | 641 | 20,94 | 33 | 39,13 | ||||
| 2025-08-06 | 13F | Legacy Investment Solutions, LLC | 0 | −100,00 | 0 | |||||
| 2025-08-26 | NP | EVAGX - The E-Valuator Aggressive Growth (85%-99%) RMS Fund Service Class Shares | 48 326 | −0,50 | 2 476 | 15,49 | ||||
| 2025-08-04 | 13F | Pensionmark Financial Group, Llc | 8 580 | −9,69 | 440 | 4,77 | ||||
| 2025-07-10 | 13F | Wealth Enhancement Advisory Services, Llc | 260 149 | 60,15 | 13 197 | 83,98 | ||||
| 2025-08-08 | 13F | Gts Securities Llc | 0 | −100,00 | 0 | |||||
| 2025-08-14 | 13F | Modern Wealth Management, LLC | 198 724 | 10 183 | ||||||
| 2025-05-28 | NP | NDOW - Anydrus Advantage ETF | 42 817 | 17,69 | 1 891 | 27,88 | ||||
| 2025-04-23 | 13F | Crewe Advisors LLC | 0 | −100,00 | 0 | |||||
| 2025-08-14 | 13F | Aqr Capital Management Llc | 5 757 | 295 | ||||||
| 2025-08-14 | 13F | Ambassador Advisors, LLC | 36 895 | 1 890 | ||||||
| 2025-07-23 | 13F | WESPAC Advisors, LLC | 13 271 | 680 | ||||||
| 2025-08-11 | 13F | Principal Securities, Inc. | 10 059 | 515 | ||||||
| 2025-07-28 | 13F | Tower Wealth Partners, Inc. | 21 174 | 1 085 | ||||||
| 2025-07-18 | 13F | Lockerman Financial Group, Inc. | 4 362 | 224 | ||||||
| 2025-08-05 | 13F | Sigma Planning Corp | 58 202 | 23,10 | 2 982 | 42,88 | ||||
| 2025-07-17 | 13F | Cyr Financial Inc. | 158 632 | 15,99 | 8 128 | 34,59 | ||||
| 2025-07-10 | 13F | Professional Financial Advisors, LLC | 68 136 | 2,04 | 3 491 | 18,42 | ||||
| 2025-08-05 | 13F | Bank Of Montreal /can/ | 90 | 0,00 | 5 | 33,33 | ||||
| 2025-08-11 | 13F | Tidemark, LLC | 137 267 | −10,61 | 7 034 | 3,72 | ||||
| 2025-09-04 | 13F/A | Advisor Group Holdings, Inc. | 125 842 | 93,20 | 6 450 | 124,24 | ||||
| 2025-08-13 | 13F | Capital Analysts, Inc. | 163 | 0 | ||||||
| 2025-08-19 | 13F | Advisory Services Network, LLC | 9 111 | 464 | ||||||
| 2025-07-09 | 13F | WealthCare Investment Partners, LLC | 42 352 | 2 148 | ||||||
| 2025-07-15 | 13F | StoneCrest Wealth Management, Inc. | 160 476 | 8 223 | ||||||
| 2025-08-12 | 13F | Atlas Capital Advisors Llc | 28 148 | 0,00 | 1 442 | 16,01 | ||||
| 2025-07-11 | 13F | SILVER OAK SECURITIES, Inc | 145 966 | 43 602,40 | 7 479 | 53 321,43 | ||||
| 2025-08-13 | 13F | Flow Traders U.s. Llc | 55 788 | 167,86 | 3 | |||||
| 2025-08-13 | 13F | Congress Wealth Management LLC / DE / | 4 405 | 226 | ||||||
| 2025-07-09 | 13F | Baron Wealth Management LLC | 5 068 | 0,86 | 260 | 17,19 | ||||
| 2025-07-09 | 13F | Key Client Fiduciary Advisors, LLC | 9 762 | 35,10 | 500 | 56,74 | ||||
| 2025-08-14 | 13F | Betterment LLC | 19 358 | 73,10 | 1 | |||||
| 2025-07-16 | 13F | Legend Financial Advisors, Inc. | 117 485 | 11,31 | 6 020 | 29,16 | ||||
| 2025-07-31 | 13F | Leavell Investment Management, Inc. | 5 735 | −2,22 | 294 | 13,57 | ||||
| 2025-07-21 | 13F | Ameriflex Group, Inc. | 12 833 | 8,11 | 651 | 24,24 | ||||
| 2025-07-14 | 13F | Armstrong Advisory Group, Inc | 1 480 | 76 | ||||||
| 2025-07-11 | 13F | Farther Finance Advisors, LLC | 2 472 | 127 | ||||||
| 2025-08-13 | 13F | Smith, Moore & Co. | 80 077 | 4 103 | ||||||
| 2025-07-23 | 13F | Drake & Associates, LLC | 336 654 | 17 250 | ||||||
| 2025-07-10 | 13F | Redhawk Wealth Advisors, Inc. | 0 | −100,00 | 0 | |||||
| 2025-07-31 | 13F | Trademark Financial Management, LLC | 97 301 | 114,46 | 4 986 | 148,88 | ||||
| 2025-07-28 | 13F | CGC Financial Services, LLC | 14 026 | −10,13 | 719 | 4,21 | ||||
| 2025-08-14 | 13F | Main Street Financial Solutions, LLC | 5 660 | 0,00 | 290 | 16,47 | ||||
| 2025-08-04 | 13F | Amplius Wealth Advisors, LLC | 145 347 | 7,06 | 7 448 | 24,22 | ||||
| 2025-07-21 | 13F | Mirae Asset Global Investments Co., Ltd. | 185 000 | 15,62 | 9 479 | 33,32 | ||||
| 2025-08-14 | 13F | Great Valley Advisor Group, Inc. | 542 290 | 2,41 | 27 787 | 18,83 | ||||
| 2025-08-06 | 13F | Horizon Investment Services, LLC | 74 211 | 9,55 | 3 803 | 27,11 | ||||
| 2025-07-30 | 13F | Brookstone Capital Management | 89 688 | 20,51 | 4 596 | 39,84 | ||||
| 2025-08-13 | 13F | Daner Wealth Management, LLC | 13 119 | 691 | ||||||
| 2025-07-09 | 13F | Brand Asset Management Group, Inc. | 10 988 | 563 | ||||||
| 2025-08-26 | NP | EVMLX - The E-Valuator Moderate (50%-70%) RMS Fund Service Class Shares | 31 176 | −11,08 | 1 597 | 3,17 | ||||
| 2025-08-13 | 13F | Per Stirling Capital Management, LLC. | 10 054 | 515 | ||||||
| 2025-08-26 | NP | EVGLX - The E-Valuator Growth (70%-85%) RMS Fund Service Class Shares | 70 262 | −6,66 | 3 600 | 8,30 | ||||
| 2025-08-08 | 13F | Avantax Advisory Services, Inc. | 13 673 | 14,42 | 701 | 32,83 | ||||
| 2025-07-29 | 13F | Stratos Wealth Partners, LTD. | 9 660 | 5,32 | 495 | 21,98 | ||||
| 2025-08-05 | 13F | GPS Wealth Strategies Group, LLC | 758 | 39 | ||||||
| 2025-08-12 | 13F | Gladstone Institutional Advisory LLC | 48 760 | 2 498 | ||||||
| 2025-08-14 | 13F | Stifel Financial Corp | 59 287 | 90,46 | 3 038 | 121,03 | ||||
| 2025-08-12 | 13F | Riverstone Advisors, LLC | 9 447 | 484 | ||||||
| 2025-07-23 | 13F | Wise Wealth Partners | 44 507 | 2 281 | ||||||
| 2025-07-28 | 13F | WJ Wealth Management, LLC | 50 588 | 2 592 | ||||||
| 2025-08-14 | 13F | Jane Street Group, Llc | 549 800 | 3 902,62 | 28 172 | 4 548,68 | ||||
| 2025-08-14 | 13F | Wells Fargo & Company/mn | 1 385 | 138 400,00 | 71 | |||||
| 2025-04-18 | 13F | Bfsg, Llc | 0 | −100,00 | 0 | |||||
| 2025-07-16 | 13F | ORG Partners LLC | 111 146 | 91,49 | 5 680 | 127,75 | ||||
| 2025-07-25 | 13F | NorthRock Partners, LLC | 0 | −100,00 | 0 | |||||
| 2025-07-29 | 13F | Private Trust Co Na | 1 107 | 99,82 | 57 | 133,33 | ||||
| 2025-08-14 | 13F | Susquehanna International Group, Llp | 34 421 | 128,67 | 1 764 | 165,51 | ||||
| 2025-08-12 | 13F | SRS Capital Advisors, Inc. | 605 | 31 | ||||||
| 2025-08-08 | 13F | D'Orazio & Associates, Inc. | 48 637 | 2 492 | ||||||
| 2025-08-12 | 13F | LPL Financial LLC | 2 082 693 | 122,90 | 106 717 | 158,65 | ||||
| 2025-08-13 | 13F | Northwestern Mutual Wealth Management Co | 683 555 | 181,20 | 35 025 | 226,30 | ||||
| 2025-08-14 | 13F | Arizona PSPRS Trust | 103 868 | 10,89 | 5 322 | 28,68 | ||||
| 2025-07-16 | 13F | Perigon Wealth Management, LLC | 7 650 | 392 | ||||||
| 2025-04-30 | 13F | Stratos Wealth Advisors, LLC | 0 | −100,00 | 0 | −100,00 | ||||
| 2025-07-28 | 13F | RFG Advisory, LLC | 13 557 | 695 | ||||||
| 2025-08-15 | 13F/A | MONECO Advisors, LLC | 0 | −100,00 | 0 | −100,00 | ||||
| 2025-07-11 | 13F | Meriwether Wealth & Planning, LLC | 11 345 | 581 | ||||||
| 2025-08-14 | 13F | Integrated Wealth Concepts LLC | 22 087 | 23,46 | 1 132 | 43,16 | ||||
| 2025-05-16 | 13F/A | Goldman Sachs Group Inc | 0 | −100,00 | 0 | −100,00 | ||||
| 2025-07-08 | 13F | Adamsbrown Wealth Consultants Llc | 55 602 | 12,92 | 2 849 | 31,05 | ||||
| 2025-07-16 | 13F | Embree Financial Group | 38 783 | 131,21 | 1 987 | 168,51 | ||||
| 2025-08-12 | 13F | Global Retirement Partners, LLC | 4 523 | 232 | ||||||
| 2025-08-13 | 13F | Dana Investment Advisors, Inc. | 15 200 | 94,50 | 779 | 125,51 | ||||
| 2025-07-18 | 13F | Dogwood Wealth Management LLC | 99 891 | 5 077 | ||||||
| 2025-07-31 | 13F | Cambridge Investment Research Advisors, Inc. | 321 409 | 1 125,91 | 16 | 1 500,00 | ||||
| 2025-07-22 | 13F | USAdvisors Wealth Management, LLC | 62 023 | 3 | ||||||
| 2025-08-26 | NP | EVCLX - The E-Valuator Conservative (15%-30%) RMS Fund Service Class Shares | 5 916 | 30,05 | 303 | 51,50 | ||||
| 2025-08-12 | 13F | Titleist Asset Management, Llc | 125 711 | 1,06 | 6 441 | 17,26 | ||||
| 2025-07-17 | 13F | Alpine Bank Wealth Management | 97 132 | 33,69 | 4 977 | 55,14 | ||||
| 2025-08-14 | 13F | D. E. Shaw & Co., Inc. | 78 309 | 4 013 | ||||||
| 2025-08-04 | 13F | Atria Investments Llc | 74 283 | 3 806 | ||||||
| 2025-08-14 | 13F | Citadel Advisors Llc | 32 141 | 1 647 | ||||||
| 2025-08-15 | 13F | Kestra Advisory Services, LLC | 5 323 | 273 | ||||||
| 2025-08-14 | 13F | Fmr Llc | 363 | −80,69 | 19 | −78,31 | ||||
| 2025-08-06 | 13F | Golden State Wealth Management, LLC | 6 821 | 62,99 | 350 | 89,67 | ||||
| 2025-04-15 | 13F | Collier Financial | 3 638 | 0,00 | 161 | 8,84 | ||||
| 2025-08-08 | 13F | Cetera Investment Advisers | 330 060 | 208,04 | 16 912 | 257,47 | ||||
| 2025-08-26 | 13F/A | Thrivent Financial For Lutherans | 31 734 | 2 | ||||||
| 2025-05-16 | 13F | Legacy Wealth Managment, LLC/ID | 0 | −100,00 | 0 | |||||
| 2025-08-18 | 13F | Geneos Wealth Management Inc. | 1 881 | 0,00 | 96 | 15,66 | ||||
| 2025-08-04 | 13F | Creative Financial Designs Inc /adv | 492 | 25 | ||||||
| 2025-07-24 | 13F | FinDec Wealth Services, Inc. | 4 366 | −46,30 | 224 | −37,88 | ||||
| 2025-08-01 | 13F | Envestnet Asset Management Inc | 339 277 | 131,85 | 17 385 | 169,02 | ||||
| 2025-07-07 | 13F | RDA Financial Network | 42 682 | 2 187 | ||||||
| 2025-07-14 | 13F | Southland Equity Partners LLC | 18 131 | 4,54 | 929 | 21,44 | ||||
| 2025-08-12 | 13F | O'shaughnessy Asset Management, Llc | 1 682 | 271,30 | 86 | 330,00 | ||||
| 2025-08-15 | 13F | Equitable Holdings, Inc. | 476 065 | 30,41 | 24 394 | 51,32 | ||||
| 2025-08-14 | 13F | UBS Group AG | 19 | 1 | ||||||
| 2025-08-06 | 13F | Founders Financial Securities Llc | 81 291 | 4 165 | ||||||
| 2025-08-06 | 13F | AE Wealth Management LLC | 4 | 0 | ||||||
| 2025-08-15 | 13F | Morgan Stanley | 0 | −100,00 | 0 | |||||
| 2025-08-29 | 13F | Centaurus Financial, Inc. | 114 829 | 6 | ||||||
| 2025-07-28 | 13F | Perfromance Wealth Partners, LLC | 23 055 | 1 181 | ||||||
| 2025-08-08 | 13F | Creative Planning | 5 254 | 269 | ||||||
| 2025-08-11 | 13F | Private Advisor Group, LLC | 85 407 | 105,18 | 4 376 | 138,08 | ||||
| 2025-08-14 | 13F | McIlrath & Eck, LLC | 356 399 | 31,83 | 18 262 | 52,97 | ||||
| 2025-07-28 | 13F | Lunt Capital Management, Inc. | 30 408 | −6,39 | 1 558 | 8,65 | ||||
| 2025-07-29 | 13F | Systelligence, LLC | 161 772 | −3,86 | 8 289 | 11,56 | ||||
| 2025-08-08 | 13F | Kingsview Wealth Management, LLC | 10 910 | 559 | ||||||
| 2025-07-25 | 13F | Cwm, Llc | 337 472 | 16,00 | 17 | 41,67 | ||||
| 2025-08-13 | 13F | Kilter Group LLC | 78 | 4 | ||||||
| 2025-08-14 | 13F | Bank Of America Corp /de/ | 62 797 | −45,07 | 3 218 | −36,27 | ||||
| 2025-05-15 | 13F | Mariner, LLC | 0 | −100,00 | 0 | |||||
| 2025-08-06 | 13F | Able Wealth Management LLC | 96 152 | 4 927 | ||||||
| 2025-08-06 | 13F/A | Three Cord True Wealth Management, LLC | 243 526 | 12 478 | ||||||
| 2025-05-07 | 13F/A | Meridian Management Co | 0 | −100,00 | 0 | −100,00 | ||||
| 2025-08-12 | 13F | MAI Capital Management | 1 844 | 0,00 | 94 | 16,05 | ||||
| 2025-07-23 | 13F | Foresight Capital Management Advisors, Inc. | 6 835 | 350 | ||||||
| 2025-08-12 | 13F | Proequities, Inc. | 0 | 0 | ||||||
| 2025-07-24 | 13F | IFP Advisors, Inc | 0 | −100,00 | 0 |