Grundläggande statistik
| Institutionella ägare | 155 total, 155 long only, 0 short only, 0 long/short - change of 9,93% MRQ |
| Genomsnittlig portföljallokering | 0.1209 % - change of −15,45% MRQ |
| Institutionella aktier (lång) | 15 384 005 (ex 13D/G) - change of 0,95MM shares 6,55% MRQ |
| Institutionellt värde (lång) | $ 377 736 USD ($1000) |
Institutionellt ägande och aktieägare
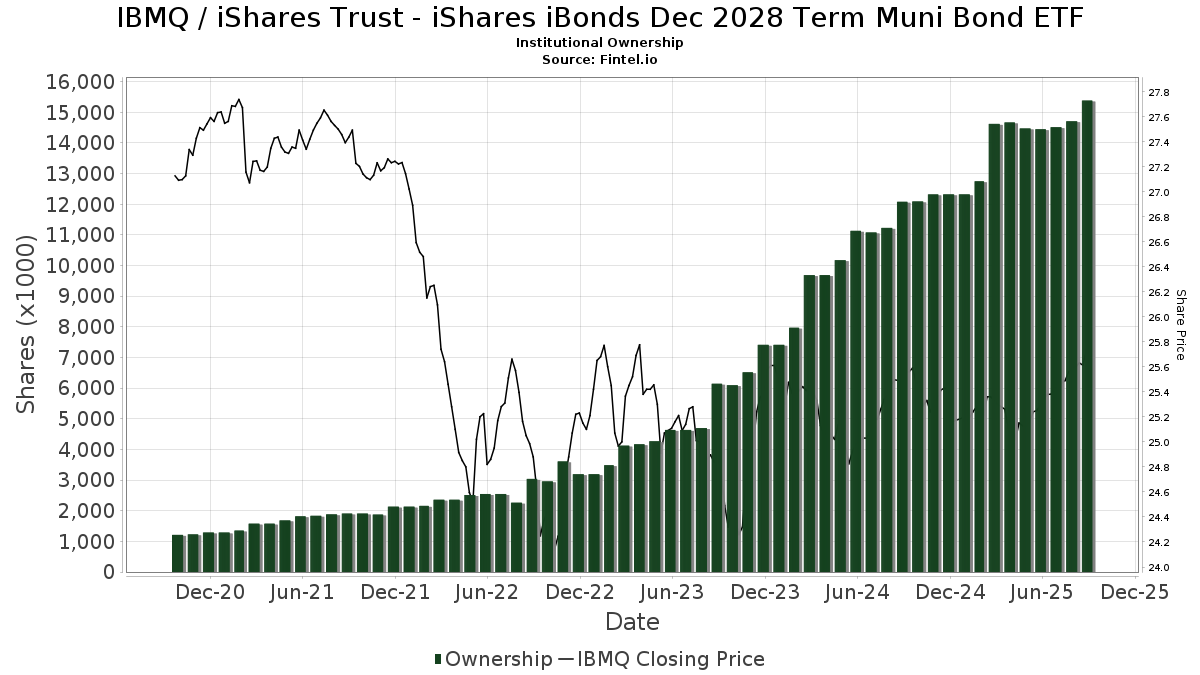
iShares Trust - iShares iBonds Dec 2028 Term Muni Bond ETF (US:IBMQ) har 155 Institutionella ägare och aktieägare som har lämnat in 13D/G- eller 13F-formulär till Securities Exchange Commission (SEC). Dessa institut innehar totalt 15,384,005 aktier. Största aktieägare inkluderar Bank Of America Corp /de/, Hartland & Co., LLC, Mercer Global Advisors Inc /adv, Envestnet Asset Management Inc, Us Bancorp \de\, HighTower Advisors, LLC, Wells Fargo & Company/mn, GWM Advisors LLC, Hengehold Capital Management Llc, and Hills Bank & Trust Co .
iShares Trust - iShares iBonds Dec 2028 Term Muni Bond ETF (BATS:IBMQ) Institutionell ägarstruktur visar institutioners och fonders nuvarande positioner i företaget, samt de senaste förändringarna i positionernas storlek. Större aktieägare kan vara enskilda investerare, fonder, hedgefonder eller institutioner. Bilaga 13D visar att investeraren äger (eller ägde) mer än 5% av företaget och avser (eller avsåg) att aktivt eftersträva en förändring av affärsstrategin. Schedule 13G indikerar en passiv investering på över 5%.
The share price as of September 8, 2025 is 25,69 / share. Previously, on September 9, 2024, the share price was 25,52 / share. This represents an increase of 0,67% over that period.
Fondsentimentets poäng
Fondsentimentet poängen(fka Ägarackumulation-poäng) visar vilka aktier som är mest köpta av fonder. Det är resultatet av en sofistikerad kvantitativ flerfaktormodell som identifierar företag med de högsta nivåerna av institutionell ackumulering. Poängsättningsmodellen använder en kombination av den totala ökningen av redovisade ägare, förändringarna i portföljallokeringarna för dessa ägare och andra mått. Siffran sträcker sig från 0 till 100, där högre siffror indikerar en högre nivå av ackumulering i förhållande till sina konkurrenter, och 50 är genomsnittet.
Uppdateringsfrekvens: Dagligen
Se Ownership Explorer, som innehåller en lista över de högst rankade företagen.
Institutionell sälj/köp-kvot
Förutom att rapportera vanliga eget kapital- och skuldemissioner måste institutioner med mer än 100MM tillgångar under förvaltning också avslöja sina innehav av sälj- och köpoptioner. Eftersom säljoptioner i allmänhet indikerar ett negativt sentiment och köpoptioner indikerar ett positivt sentiment, kan vi få en uppfattning om det övergripande institutionella sentimentet genom att plotta förhållandet mellan säljoptioner och köpoptioner. Diagrammet till höger visar det historiska förhållandet mellan sälj- och köpoptioner för detta instrument.
Genom att använda sälj/köp-kvoten som en indikator på aktieägarnas sentiment undviker man en av de största bristerna med att använda det totala institutionella ägandet, nämligen att en betydande del av de förvaltade tillgångarna investeras passivt för att följa index. Passivt förvaltade fonder köper vanligtvis inte optioner, så indikatorn för sälj/köp-kvoten ger en bättre bild av stämningen i aktivt förvaltade fonder.
13F- och NPORT-arkiveringar
Detaljer om 13F-arkiveringar är gratis. Detaljer om NP-arkiveringar kräver ett premiummedlemskap. Gröna rader indikerar nya positioner. Röda rader indikerar stängda positioner. Klicka på länk symbolen för att se hela transaktionshistoriken.
Uppgradera
för att låsa upp premiumdata och exportera till Excel ![]() .
.
| Fil Datum | Källa | Investerare | Typ | Genomsnittligt pris (beräknat) |
Aktier | Δ Aktier (%) |
Rapporterat värde (1000 USD) |
Δ Värde (%) |
Portföljallokering (%) |
|
|---|---|---|---|---|---|---|---|---|---|---|
| 2025-07-08 | 13F | FF Advisors,LLC | 21 309 | 3,66 | 541 | 4,84 | ||||
| 2025-08-14 | 13F | Garden State Investment Advisory Services LLC | 0 | −100,00 | 0 | |||||
| 2025-07-28 | 13F | Harbour Investments, Inc. | 294 | 0,00 | 7 | 0,00 | ||||
| 2025-07-23 | 13F | Sax Wealth Advisors, Llc | 13 241 | 336 | ||||||
| 2025-08-07 | 13F | Kestra Private Wealth Services, Llc | 8 031 | 204 | ||||||
| 2025-07-24 | 13F | Cyndeo Wealth Partners, LLC | 97 284 | −9,73 | 2 472 | −9,32 | ||||
| 2025-08-13 | 13F | Peloton Wealth Strategists | 13 000 | 0,00 | 0 | |||||
| 2025-08-13 | 13F | RIA Advisory Group LLC | 49 569 | 9,03 | 1 260 | 9,57 | ||||
| 2025-08-04 | 13F | Spinnaker Trust | 54 020 | 13,48 | 1 373 | 14,05 | ||||
| 2025-07-29 | 13F | Stratos Wealth Partners, LTD. | 28 281 | −17,44 | 719 | −17,09 | ||||
| 2025-08-08 | 13F | Hartland & Co., LLC | 891 719 | 3,39 | 22 659 | 3,88 | ||||
| 2025-07-08 | 13F | Parallel Advisors, LLC | 16 279 | 7,67 | 414 | 8,12 | ||||
| 2025-07-16 | 13F | Kathmere Capital Management, LLC | 301 088 | −45,68 | 7 651 | −45,43 | ||||
| 2025-08-12 | 13F | BlackRock, Inc. | 150 | 0,67 | 4 | 0,00 | ||||
| 2025-08-07 | 13F | Rossmore Private Capital | 13 887 | 353 | ||||||
| 2025-07-17 | 13F | Archford Capital Strategies, LLC | 13 065 | 4,74 | 332 | 5,08 | ||||
| 2025-08-11 | 13F | Arrow Financial Corp | 9 448 | 0,00 | 240 | 0,84 | ||||
| 2025-07-28 | 13F | Nestegg Advisors, Inc. | 13 225 | −39,34 | 336 | −39,02 | ||||
| 2025-07-30 | 13F | Rehmann Capital Advisory Group | 11 065 | 0,00 | 281 | 0,72 | ||||
| 2025-08-14 | 13F | Wells Fargo & Company/mn | 454 319 | 4,82 | 11 544 | 5,32 | ||||
| 2025-08-15 | 13F | Morgan Stanley | 192 905 | 5,83 | 4 902 | 6,34 | ||||
| 2025-08-15 | 13F | Captrust Financial Advisors | 19 844 | −2,53 | 504 | −1,95 | ||||
| 2025-07-17 | 13F | Hengehold Capital Management Llc | 386 615 | 3,24 | 9 824 | 3,73 | ||||
| 2025-08-11 | 13F | United Capital Financial Advisers, Llc | 107 202 | 0,06 | 2 724 | 0,55 | ||||
| 2025-08-13 | 13F | Smith, Moore & Co. | 14 163 | 360 | ||||||
| 2025-07-22 | 13F | Valley National Advisers Inc | 3 943 | 0 | ||||||
| 2025-07-18 | 13F | Precision Wealth Strategies, LLC | 10 392 | 264 | ||||||
| 2025-08-08 | 13F | Cetera Investment Advisers | 34 100 | 42,15 | 866 | 42,90 | ||||
| 2025-08-04 | 13F | Jim Saulnier & Associates, Llc | 13 612 | 0,61 | 346 | 0,88 | ||||
| 2025-08-08 | 13F | Meridian Wealth Management, LLC | 12 954 | 329 | ||||||
| 2025-07-07 | 13F | Trust Co | 13 728 | 0,00 | 349 | 0,29 | ||||
| 2025-07-08 | 13F | Heartwood Wealth Advisors LLC | 252 883 | 0,05 | 6 426 | 0,53 | ||||
| 2025-08-12 | 13F | LPL Financial LLC | 265 242 | 2,44 | 6 740 | 2,92 | ||||
| 2025-07-09 | 13F | Massmutual Trust Co Fsb/adv | 19 660 | 14 462,96 | 500 | 16 533,33 | ||||
| 2025-07-29 | 13F | Stratos Wealth Advisors, LLC | 97 842 | 137,99 | 2 486 | 139,27 | ||||
| 2025-07-22 | 13F | Partners Wealth Management, Llc | 11 593 | 0,00 | 293 | −0,34 | ||||
| 2025-08-12 | 13F | YANKCOM Partnership | 0 | −100,00 | 0 | |||||
| 2025-08-14 | 13F | Mercer Global Advisors Inc /adv | 856 888 | 13,85 | 21 774 | 14,39 | ||||
| 2025-08-14 | 13F | Snowden Capital Advisors LLC | 31 000 | 0,00 | 788 | 0,51 | ||||
| 2025-07-16 | 13F | Evergreen Private Wealth LLC | 43 810 | 1,33 | 1 113 | 1,83 | ||||
| 2025-07-17 | 13F/A | Capital Investment Advisors, LLC | 58 555 | 13,15 | 1 488 | 13,69 | ||||
| 2025-07-15 | 13F | Postrock Partners Llc | 16 841 | 26,71 | 428 | 27,08 | ||||
| 2025-07-11 | 13F | Quantum Financial Advisors, LLC | 87 204 | 5,12 | 2 216 | 5,58 | ||||
| 2025-08-27 | 13F/A | Brinker Capital Investments, LLC | 27 000 | 27,92 | 686 | 28,71 | ||||
| 2025-07-15 | 13F | Droms Strauss Advisors Inc /mo/ /adv | 15 443 | 10,77 | 392 | 11,36 | ||||
| 2025-07-31 | 13F | Leavell Investment Management, Inc. | 50 439 | 93,17 | 1 282 | 94,09 | ||||
| 2025-07-08 | 13F | Legacy Private Trust Co. | 82 149 | 0,00 | 2 087 | 0,48 | ||||
| 2025-08-14 | 13F | STAR Financial Bank | 0 | −100,00 | 0 | |||||
| 2025-08-14 | 13F | Ameriprise Financial Inc | 113 132 | 3,51 | 2 875 | 4,02 | ||||
| 2025-08-14 | 13F | Citadel Advisors Llc | 0 | −100,00 | 0 | |||||
| 2025-08-12 | 13F | Steward Partners Investment Advisory, Llc | 11 666 | 33,51 | 296 | 34,55 | ||||
| 2025-08-14 | 13F | Royal Bank Of Canada | 92 733 | −1,27 | 2 356 | −0,80 | ||||
| 2025-07-18 | 13F | Client 1st Advisory Group, Llc | 19 920 | 0,00 | 506 | 0,60 | ||||
| 2025-08-12 | 13F | Covington Investment Advisors Inc. | 308 365 | 9,30 | 8 | 0,00 | ||||
| 2025-08-14 | 13F | Comerica Bank | 5 889 | 0,00 | 150 | 0,68 | ||||
| 2025-08-11 | 13F | Avantax Planning Partners, Inc. | 12 459 | −0,01 | 317 | 0,32 | ||||
| 2025-08-14 | 13F | Mariner, LLC | 14 536 | 0,00 | 369 | 0,54 | ||||
| 2025-05-14 | 13F | Evergreen Wealth Solutions, LLC | 0 | −100,00 | 0 | |||||
| 2025-08-12 | 13F | OneAscent Financial Services LLC | 9 066 | −7,38 | 0 | |||||
| 2025-08-14 | 13F | UBS Group AG | 335 095 | −8,03 | 8 515 | −7,60 | ||||
| 2025-07-17 | 13F | Catalytic Wealth RIA, LLC | 31 217 | −2,05 | 793 | −1,49 | ||||
| 2025-08-06 | 13F | Rialto Wealth Management, LLC | 828 | 0,00 | 21 | 5,00 | ||||
| 2025-08-15 | 13F | CI Private Wealth, LLC | 11 656 | −65,87 | 296 | −65,70 | ||||
| 2025-05-12 | 13F | Sandy Spring Bank | 61 833 | 15,14 | 1 564 | 15,61 | ||||
| 2025-08-01 | 13F | First National Trust Co | 14 433 | 4,28 | 367 | 4,57 | ||||
| 2025-07-30 | 13F | Granite Harbor Advisors, Inc. | 41 059 | −9,39 | 1 043 | −8,91 | ||||
| 2025-08-12 | 13F | Proequities, Inc. | 0 | 0 | ||||||
| 2025-08-07 | 13F | Allworth Financial LP | 813 | 0,00 | 21 | 0,00 | ||||
| 2025-08-13 | 13F | MONECO Advisors, LLC | 10 933 | 0,00 | 278 | 0,36 | ||||
| 2025-08-12 | 13F | Passive Capital Management, LLC. | 13 803 | 0,00 | 350 | 0,29 | ||||
| 2025-07-24 | 13F | IFP Advisors, Inc | 30 559 | 14,36 | 776 | 14,96 | ||||
| 2025-07-29 | 13F | Roof Eidam & Maycock/adv | 31 789 | 0,14 | 808 | 0,62 | ||||
| 2025-08-07 | 13F | CENTRAL TRUST Co | 151 130 | 0,76 | 3 840 | 1,24 | ||||
| 2025-08-14 | 13F | Fmr Llc | 2 043 | −75,05 | 52 | −75,36 | ||||
| 2025-08-14 | 13F | Benjamin Edwards Inc | 81 830 | 150,56 | 2 079 | 152,00 | ||||
| 2025-07-09 | 13F | Praetorian Wealth Management, Inc. | 242 261 | 1,30 | 6 156 | 1,79 | ||||
| 2025-08-04 | 13F | ArborFi Advisors, LLC | 0 | −100,00 | 0 | |||||
| 2025-08-13 | 13F | Beacon Pointe Advisors, LLC | 23 464 | 0,32 | 596 | 0,85 | ||||
| 2025-07-11 | 13F | Financial Advisory Corp | 27 255 | 693 | ||||||
| 2025-08-06 | 13F | Commonwealth Equity Services, Llc | 62 636 | 3,26 | 2 | 0,00 | ||||
| 2025-08-14 | 13F | Jane Street Group, Llc | 117 601 | 91,66 | 2 988 | 92,65 | ||||
| 2025-05-16 | 13F/A | Kestra Investment Management, LLC | 0 | −100,00 | 0 | |||||
| 2025-07-23 | 13F | Valmark Advisers, Inc. | 59 642 | 11,45 | 1 516 | 11,97 | ||||
| 2025-08-06 | 13F | Atlantic Union Bankshares Corp | 63 186 | 1 606 | ||||||
| 2025-08-14 | 13F | Glen Eagle Advisors, LLC | 2 725 | 0,00 | 69 | 1,47 | ||||
| 2025-08-08 | 13F | Wrapmanager Inc | 13 905 | −4,43 | 353 | −3,81 | ||||
| 2025-08-13 | 13F | Lido Advisors, LLC | 185 542 | 10,01 | 4 715 | 10,53 | ||||
| 2025-07-22 | 13F | Woodmont Investment Counsel Llc | 95 929 | 17,12 | 2 438 | 17,67 | ||||
| 2025-07-09 | 13F | Bank of New Hampshire | 4 770 | 0,00 | 121 | 0,83 | ||||
| 2025-07-21 | 13F | Crews Bank & Trust | 31 482 | 0,00 | 800 | 0,38 | ||||
| 2025-08-11 | 13F | CFS Investment Advisory Services, LLC | 24 308 | −0,32 | 1 | |||||
| 2025-07-30 | 13F | Phillips Financial Management, Llc | 48 020 | 106,27 | 1 220 | 107,48 | ||||
| 2025-08-01 | 13F | Envestnet Asset Management Inc | 841 032 | 4,56 | 21 371 | 5,06 | ||||
| 2025-08-11 | 13F | Private Advisor Group, LLC | 8 726 | 222 | ||||||
| 2025-08-13 | 13F | Jones Financial Companies Lllp | 9 776 | 22,31 | 248 | 23,38 | ||||
| 2025-07-25 | 13F | Cwm, Llc | 39 362 | 18,93 | 1 | |||||
| 2025-08-14 | 13F | Integrated Wealth Concepts LLC | 115 028 | 3,23 | 2 923 | 3,69 | ||||
| 2025-08-14 | 13F | GWM Advisors LLC | 434 996 | 2,27 | 11 053 | 2,75 | ||||
| 2025-07-29 | 13F | Private Trust Co Na | 8 883 | −3,31 | 226 | −3,02 | ||||
| 2025-08-14 | 13F | Stifel Financial Corp | 193 861 | 80,61 | 4 926 | 81,50 | ||||
| 2025-08-05 | 13F | American Capital Advisory, LLC | 2 217 | 0,00 | 56 | 0,00 | ||||
| 2025-08-14 | 13F | Bank Of America Corp /de/ | 2 070 507 | 7,45 | 52 612 | 7,96 | ||||
| 2025-08-07 | 13F | Gryphon Financial Partners LLC | 24 940 | 634 | ||||||
| 2025-08-13 | 13F | Cary Street Partners Financial Llc | 7 956 | 0,00 | 202 | 0,50 | ||||
| 2025-08-13 | 13F | Northwestern Mutual Wealth Management Co | 185 252 | 12,72 | 4 707 | 13,26 | ||||
| 2025-07-31 | 13F | Cambridge Investment Research Advisors, Inc. | 30 265 | 275,64 | 1 | |||||
| 2025-08-12 | 13F | Ameritas Investment Partners, Inc. | 18 062 | 0,03 | 459 | 0,44 | ||||
| 2025-07-21 | 13F | Barrett & Company, Inc. | 1 794 | 46 | ||||||
| 2025-07-28 | 13F | WJ Wealth Management, LLC | 39 200 | 996 | ||||||
| 2025-07-22 | 13F | Penobscot Investment Management Company, Inc. | 8 000 | 0,00 | 203 | 0,50 | ||||
| 2025-08-01 | 13F | Paradigm, Strategies in Wealth Management, LLC | 22 906 | −16,44 | 582 | −16,02 | ||||
| 2025-08-13 | 13F | Flow Traders U.s. Llc | 9 668 | 0 | ||||||
| 2025-08-14 | 13F | 10Elms LLP | 19 160 | 0,00 | 487 | 0,41 | ||||
| 2025-07-07 | 13F | Vishria Bird Financial Group, LLC | 15 929 | 405 | ||||||
| 2025-05-15 | 13F/A | Orion Portfolio Solutions, LLC | 21 107 | 534 | ||||||
| 2025-08-19 | 13F | Asset Dedication, LLC | 2 004 | 0,00 | 51 | 0,00 | ||||
| 2025-08-13 | 13F | Green Harvest Asset Management LLC | 11 385 | 289 | ||||||
| 2025-08-14 | 13F | Envision Financial Planning, LLC | 84 482 | −6,02 | 2 147 | −5,59 | ||||
| 2025-07-25 | 13F | Commonwealth Financial Services, LLC | 10 367 | −2,44 | 263 | −1,87 | ||||
| 2025-08-14 | 13F | Colony Group, LLC | 62 843 | 3,26 | 1 597 | 3,70 | ||||
| 2025-07-29 | 13F | Accretive Wealth Partners, LLC | 8 274 | 210 | ||||||
| 2025-08-14 | 13F | Raymond James Financial Inc | 239 730 | −35,92 | 6 092 | −35,62 | ||||
| 2025-08-11 | 13F | PFG Private Wealth Management, LLC | 11 649 | 0,00 | 296 | 0,68 | ||||
| 2025-07-21 | 13F | Atwater Malick LLC | 10 921 | 278 | ||||||
| 2025-09-04 | 13F/A | Advisor Group Holdings, Inc. | 36 609 | 16,11 | 930 | 16,69 | ||||
| 2025-07-22 | 13F | Blue Square Asset Management, Llc | 29 176 | −2,99 | 741 | −2,50 | ||||
| 2025-07-21 | 13F | Cliftonlarsonallen Wealth Advisors, Llc | 181 110 | 4,87 | 4 602 | 5,38 | ||||
| 2025-08-05 | 13F | Hills Bank & Trust Co | 382 180 | 15,54 | 9 711 | 16,09 | ||||
| 2025-08-12 | 13F | Wealthbridge Capital Management, Llc | 12 732 | 5,64 | 324 | 6,25 | ||||
| 2025-07-30 | 13F | Klingman & Associates, LLC | 18 088 | −11,47 | 460 | −11,05 | ||||
| 2025-07-30 | 13F | Brookstone Capital Management | 11 292 | 21,94 | 287 | 22,22 | ||||
| 2025-08-14 | 13F/A | Rockefeller Capital Management L.P. | 18 154 | 8,56 | 461 | 9,24 | ||||
| 2025-07-14 | 13F | Sentinel Pension Advisors Inc | 51 221 | 0,61 | 1 302 | 1,09 | ||||
| 2025-07-24 | 13F | Us Bancorp \de\ | 734 646 | 7,39 | 18 667 | 7,90 | ||||
| 2025-07-01 | 13F | Confluence Investment Management Llc | 98 908 | 200,29 | 2 513 | 202,04 | ||||
| 2025-07-29 | 13F | Regions Financial Corp | 27 089 | 24,18 | 688 | 24,86 | ||||
| 2025-08-11 | 13F | HighTower Advisors, LLC | 653 576 | −6,72 | 16 607 | −6,28 | ||||
| 2025-07-21 | 13F | Segment Wealth Management, LLC | 9 500 | 0,00 | 241 | 0,42 | ||||
| 2025-05-14 | 13F | Stonebridge Capital Advisors LLC | 0 | −100,00 | 0 | |||||
| 2025-08-07 | 13F | Addison Advisors LLC | 995 | 947,37 | 25 | 1 150,00 | ||||
| 2025-08-01 | 13F | James Investment Research Inc | 13 800 | −6,76 | 351 | −6,42 | ||||
| 2025-08-15 | 13F | Howland Capital Management Llc | 338 675 | 1,73 | 8 606 | 2,21 | ||||
| 2025-07-25 | 13F | Stephens Consulting, LLC | 313 | 0,00 | 8 | 0,00 | ||||
| 2025-07-21 | 13F | Cornell Pochily Investment Advisors, Inc. | 8 045 | 204 | ||||||
| 2025-08-13 | 13F | Baird Financial Group, Inc. | 10 000 | 0,00 | 254 | 0,79 | ||||
| 2025-08-12 | 13F | Coldstream Capital Management Inc | 83 958 | 2,41 | 2 133 | 2,89 | ||||
| 2025-05-07 | 13F | Mb, Levis & Associates, Llc | 0 | −100,00 | 0 | −100,00 | ||||
| 2025-07-18 | 13F | Newman Dignan & Sheerar, Inc. | 48 256 | 0,00 | 1 226 | 0,49 | ||||
| 2025-08-04 | 13F | Assetmark, Inc | 20 448 | 110,20 | 520 | 110,98 | ||||
| 2025-08-07 | 13F | Sound View Wealth Advisors Group, LLC | 112 390 | 26,63 | 2 856 | 27,23 | ||||
| 2025-08-14 | 13F | Goldman Sachs Group Inc | 8 456 | −26,21 | 215 | −25,95 | ||||
| 2025-07-10 | 13F | Cypress Point Wealth Management, LLC | 119 536 | 0,00 | 3 037 | 0,46 | ||||
| 2025-08-11 | 13F | Principal Securities, Inc. | 20 | −86,49 | 1 | −100,00 | ||||
| 2025-07-02 | 13F | Crumly & Associates Inc. | 0 | −100,00 | 0 | |||||
| 2025-08-07 | 13F | Hughes Financial Services, LLC | 5 930 | 0,00 | 152 | 1,34 | ||||
| 2025-08-12 | 13F | Jpmorgan Chase & Co | 81 923 | 2 082 | ||||||
| 2025-08-15 | 13F | Kestra Advisory Services, LLC | 19 081 | 45,82 | 485 | 46,67 | ||||
| 2025-07-09 | 13F | Lbmc Investment Advisors, Llc | 375 752 | 17,16 | 9 548 | 17,72 | ||||
| 2025-07-21 | 13F | Exchange Capital Management, Inc. | 14 484 | −6,67 | 368 | −6,12 | ||||
| 2025-08-01 | 13F | Schmidt P J Investment Management Inc | 8 562 | 218 | ||||||
| 2025-07-17 | 13F | Janney Montgomery Scott LLC | 14 809 | −7,68 | 0 | |||||
| 2025-08-01 | 13F | Signature Wealth Management Group | 47 520 | 1,96 | 1 207 | 2,46 | ||||
| 2025-08-14 | 13F | Glenview Trust Co | 36 400 | 0,00 | 925 | 0,43 | ||||
| 2025-07-18 | 13F | TPG Advisors LLC | 9 143 | 0,00 | 232 | 0,43 | ||||
| 2025-04-15 | 13F | Collier Financial | 402 | 0,50 | 10 | 0,00 | ||||
| 2025-05-05 | 13F | Creekmur Asset Management LLC | 0 | −100,00 | 0 | |||||
| 2025-08-14 | 13F | Godshalk Welsh Capital Management, Inc. | 25 750 | 128,89 | 654 | 130,28 |